Pick one machine to be the host. The other one is the target.
I used an Azure FLARE-VM as the host and an Azure Window 10 VM as the target.
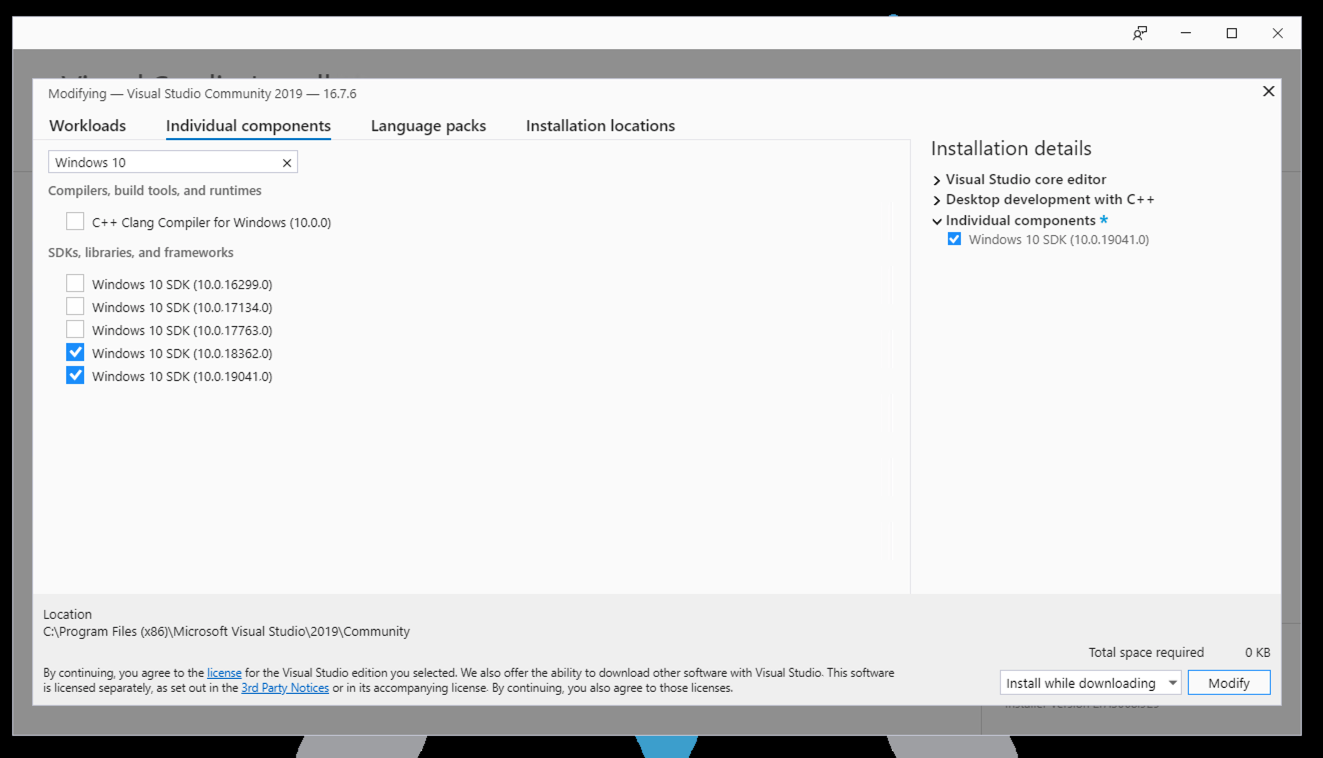
Click Modify.
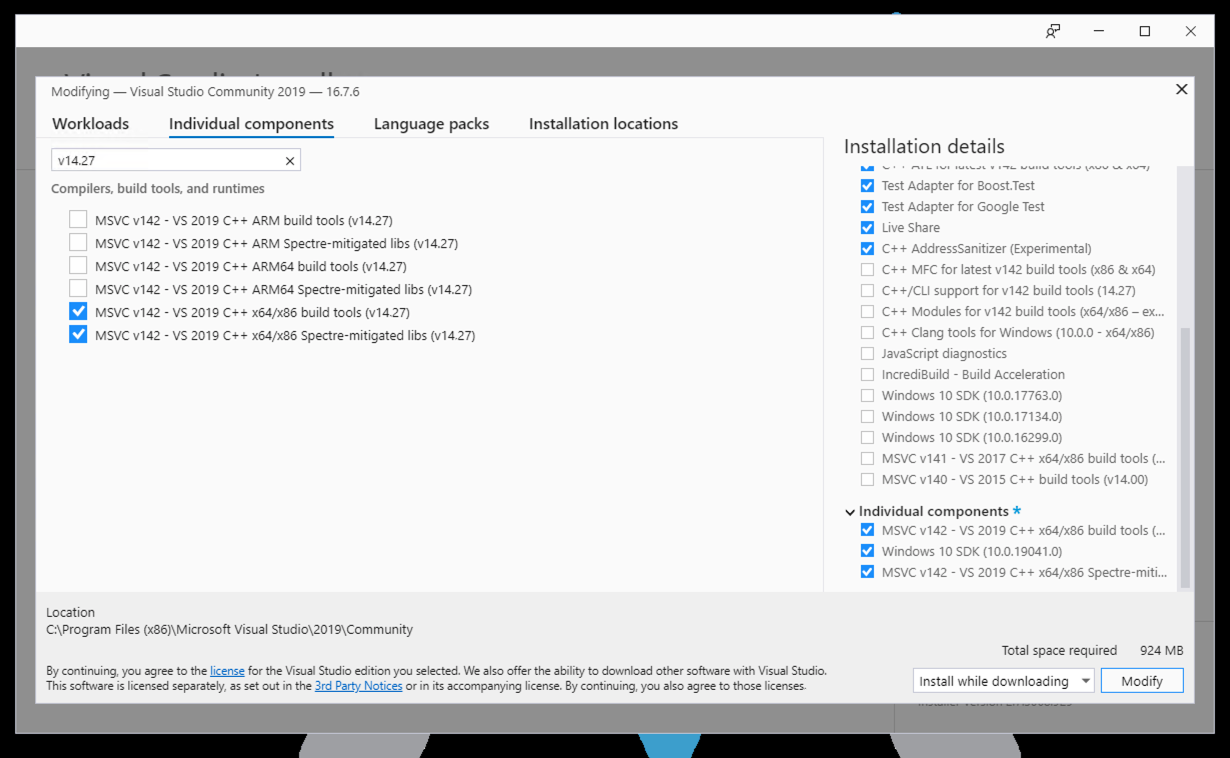
In Visual Studio Installer, on the Individual components tab, search for Windows 10. Check the box for "Windows 10 SDK (10.0.19041.0)", as shown below.
At the lower right, click the Modify button.
On the Workloads tab, in the right pane, under installation details, expand "Desktop development with C++.
Hover the mouse over MSVC, as shown below. Find the version number at the end of the first line.
On my system it was v14.27.
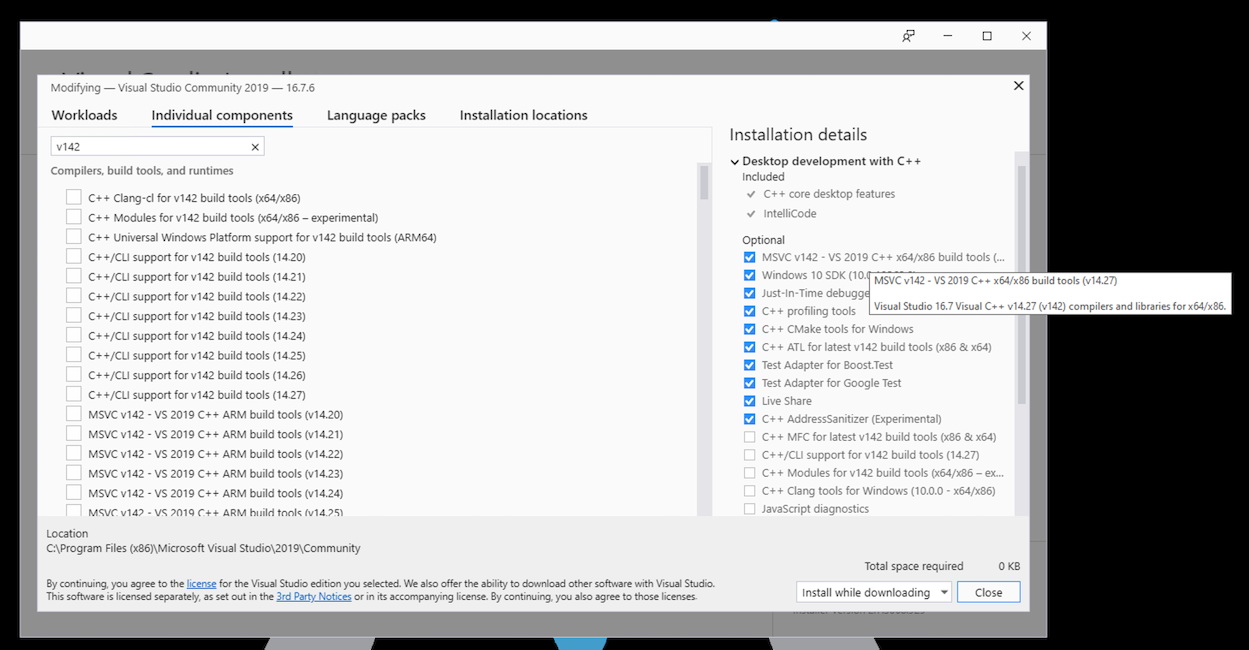
Check both the "x64/x86 build tools" and the corresponding "Spectre-mitigated libs", as shown below.
At the lower right, click the Modify button.
https://go.microsoft.com/fwlink/?linkid=2128854
Click Run.
Install the WDK with the default options.
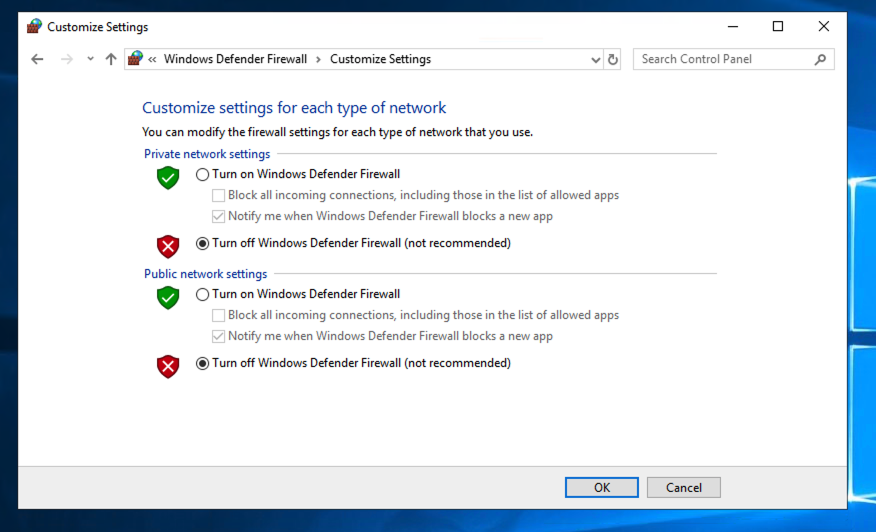
Click "Windows Defender Firewall".
In the left pane, click "Turn Windows Defender Firewall on or off".
Click both "Turn off..." buttons, as shown below.
Then click OK.
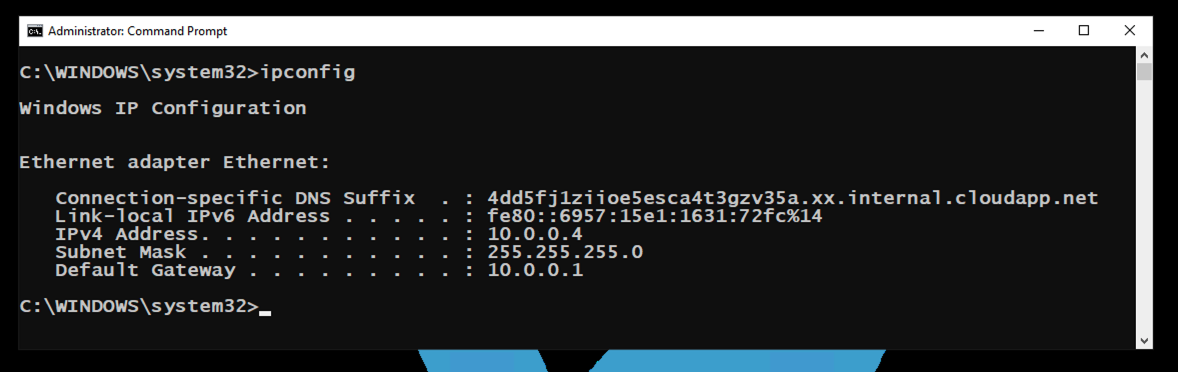
In the Command Prompt, execute this command:
ipconfig
On my system, it was 10.0.0.4, as shown below.
On the target computer, click the Start button and type CMD. Right-click "Command Prompt" and click "Run as Administrator".
If a User Account Control box pops up, click Yes.
In the Administrator Command Prompt, execute this command:
ipconfig
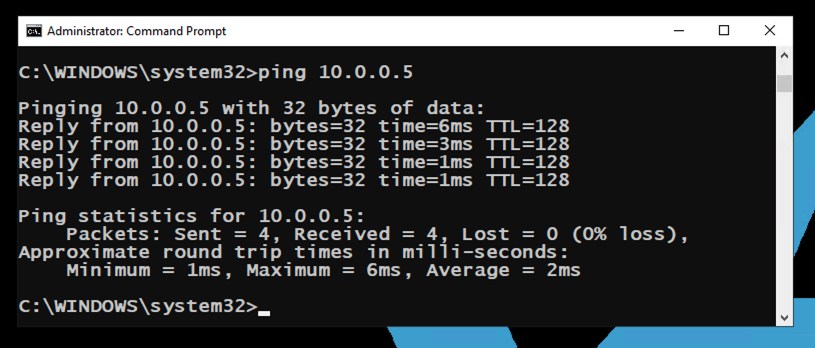
On my system, it was 10.0.0.5. On the host computer, in the Command Prompt and execute this command, replacing the IP address with the IP address of your target computer.
ping 10.0.0.5
https://github.com/Microsoft/Windows-driver-samples/archive/master.zip
These samples from from Microsoft. You can read about them here:
If you are using the FLARE-VM, right-click Windows-driver-samples-master.zip, point to 7-Zip, 'Extract to "Windows-driver-samples-master\"'.
If you are using a default Windows 10 machine, right-click Windows-driver-samples-master.zip and click "Extract All", Extract.
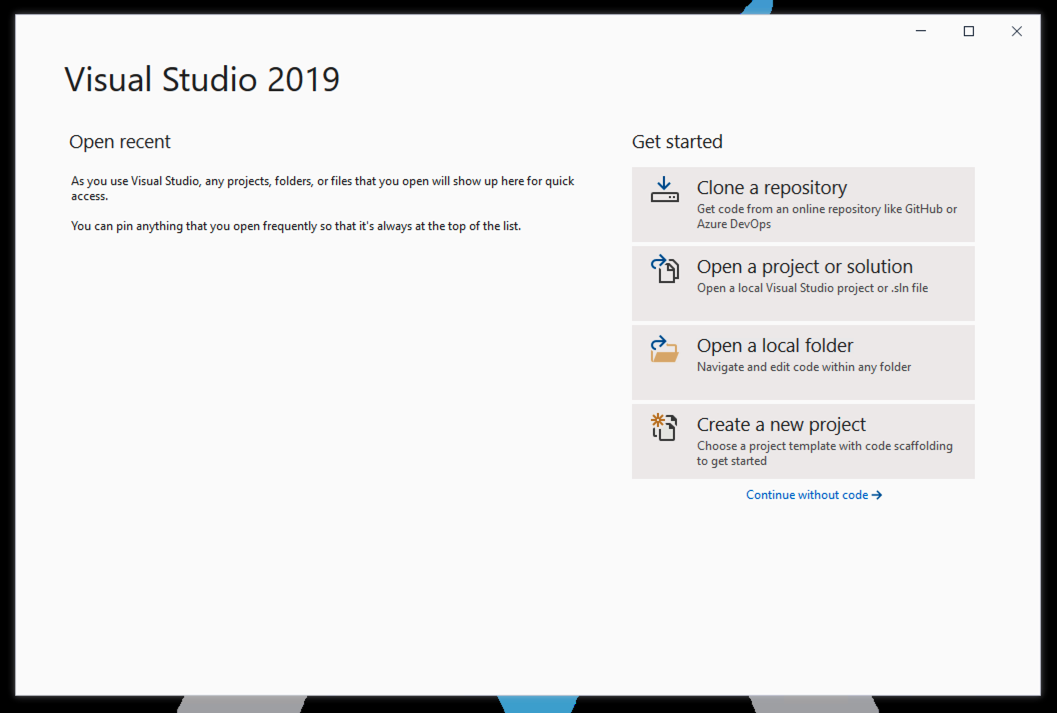
In the first page, at the lower right, click "Open a project or solution", as shown below.
In the "Open Project/Solution" box, navigate to your Downloads folder.
Double-click the "Windows-driver-samples-master" folder.
Double-click general, echo, and kmdf.
Double-click the kmdfecho.sln file.
The project opens, as shown below.
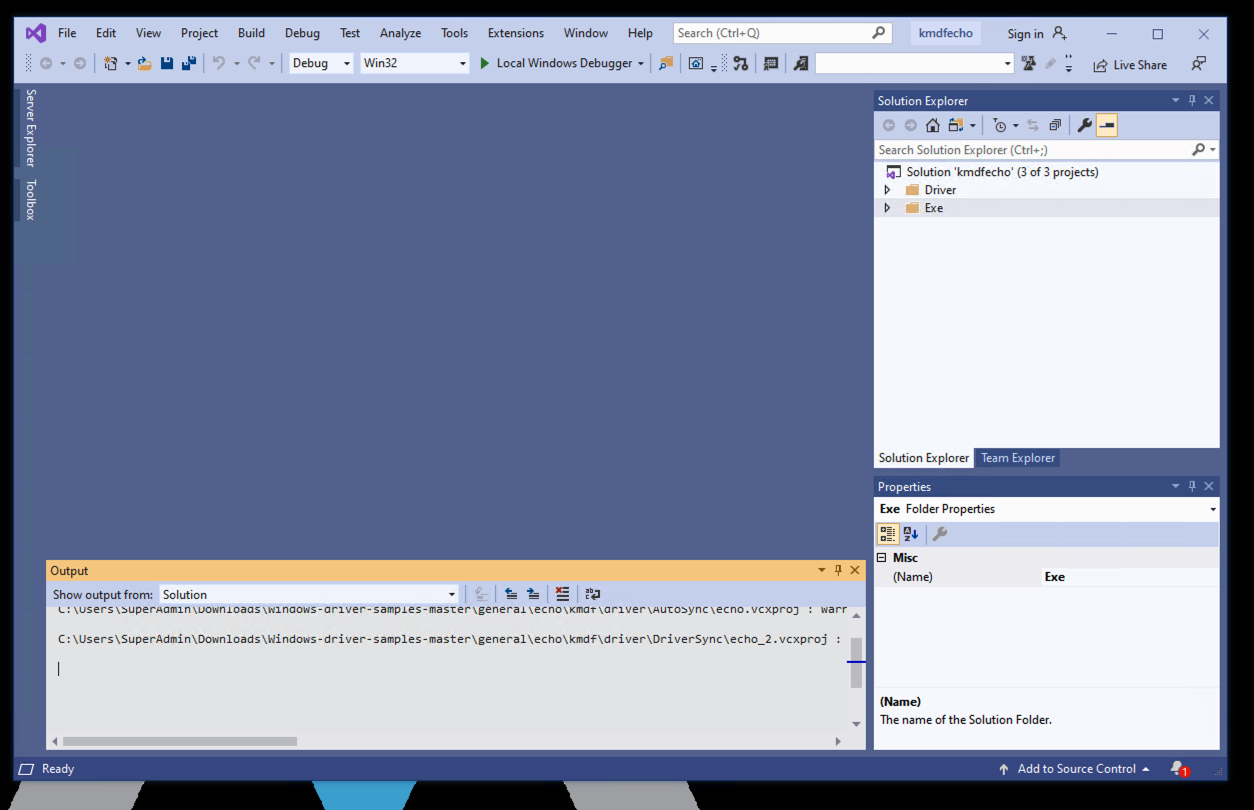
Then click Close.
In Solution Explorer, right-click echo and click Properties.
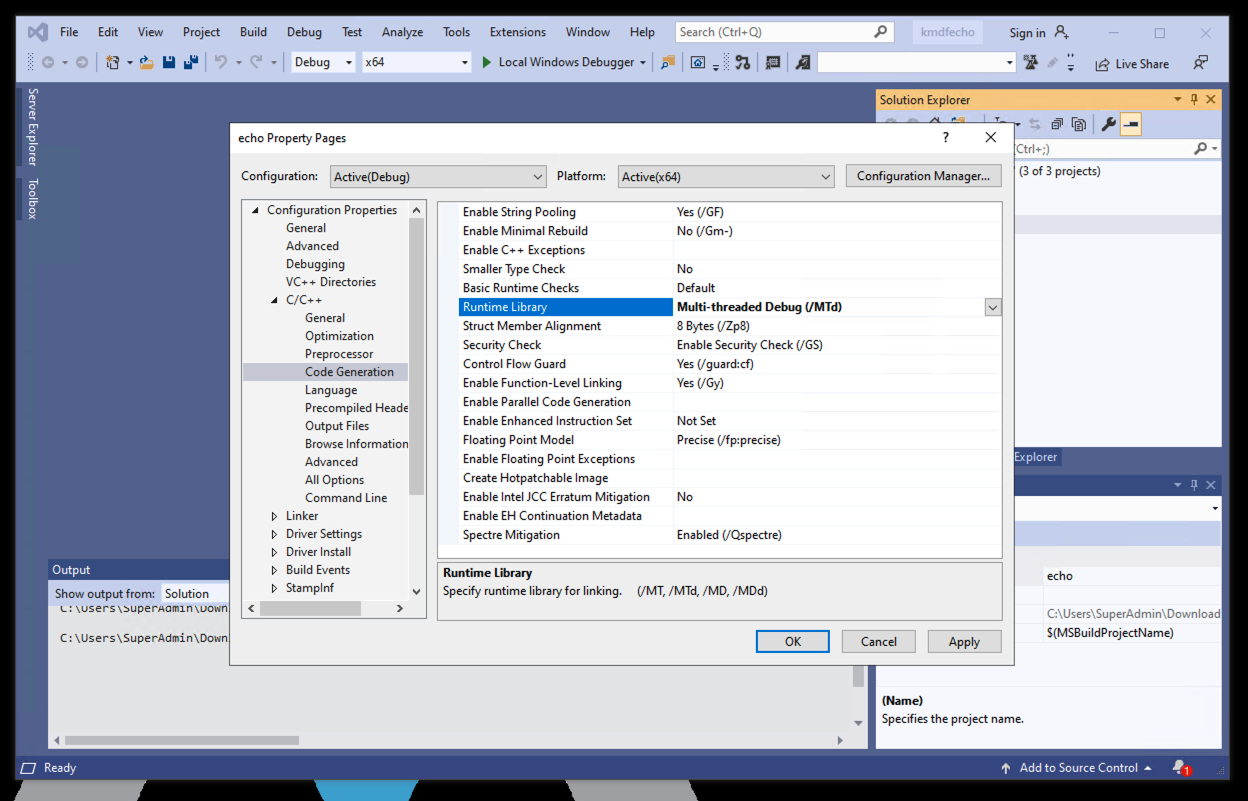
In the "echo Property Pages" box, on the left, expand C/C++ and click "Code Generation".
On the right side, set the "Runtime Library" to "Multi-threaded Debug (/MTd)", as shown below.
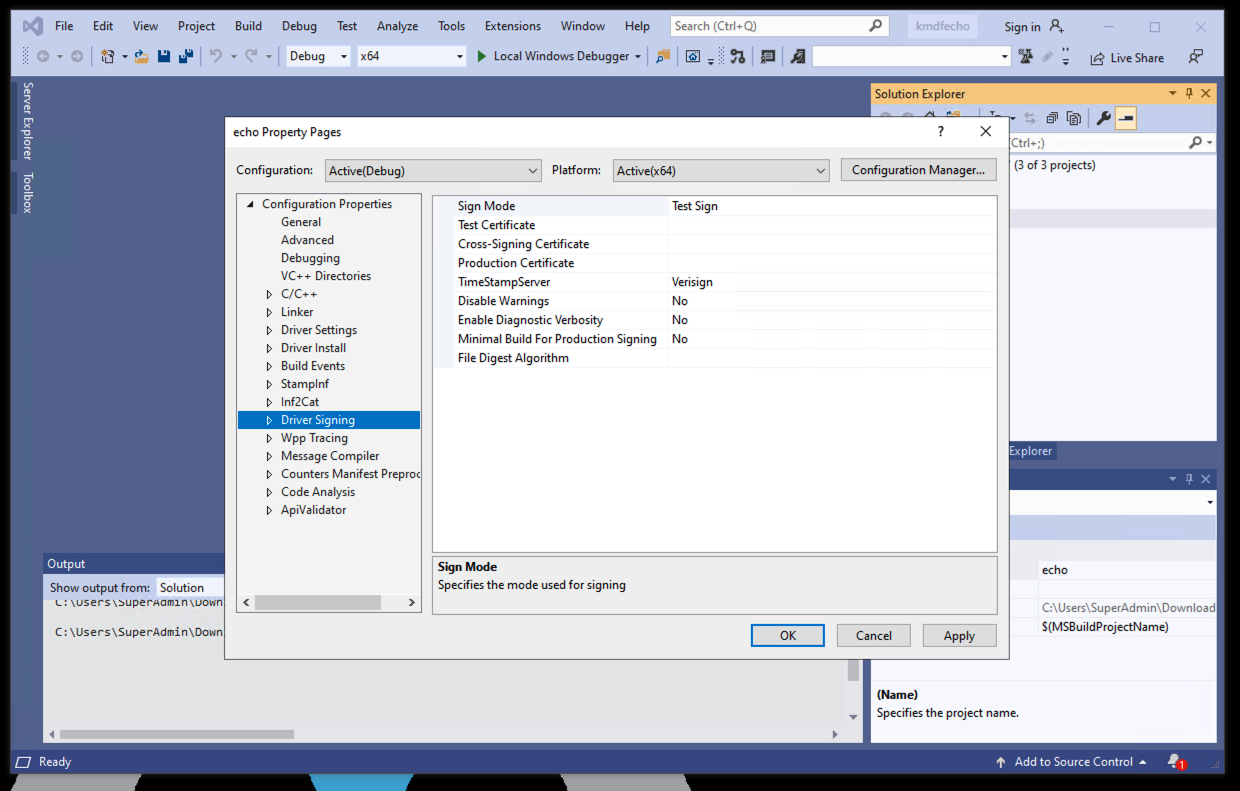
On the right side, set the "Sign Mode" to "Test Sign", as shown below.
Then click OK.
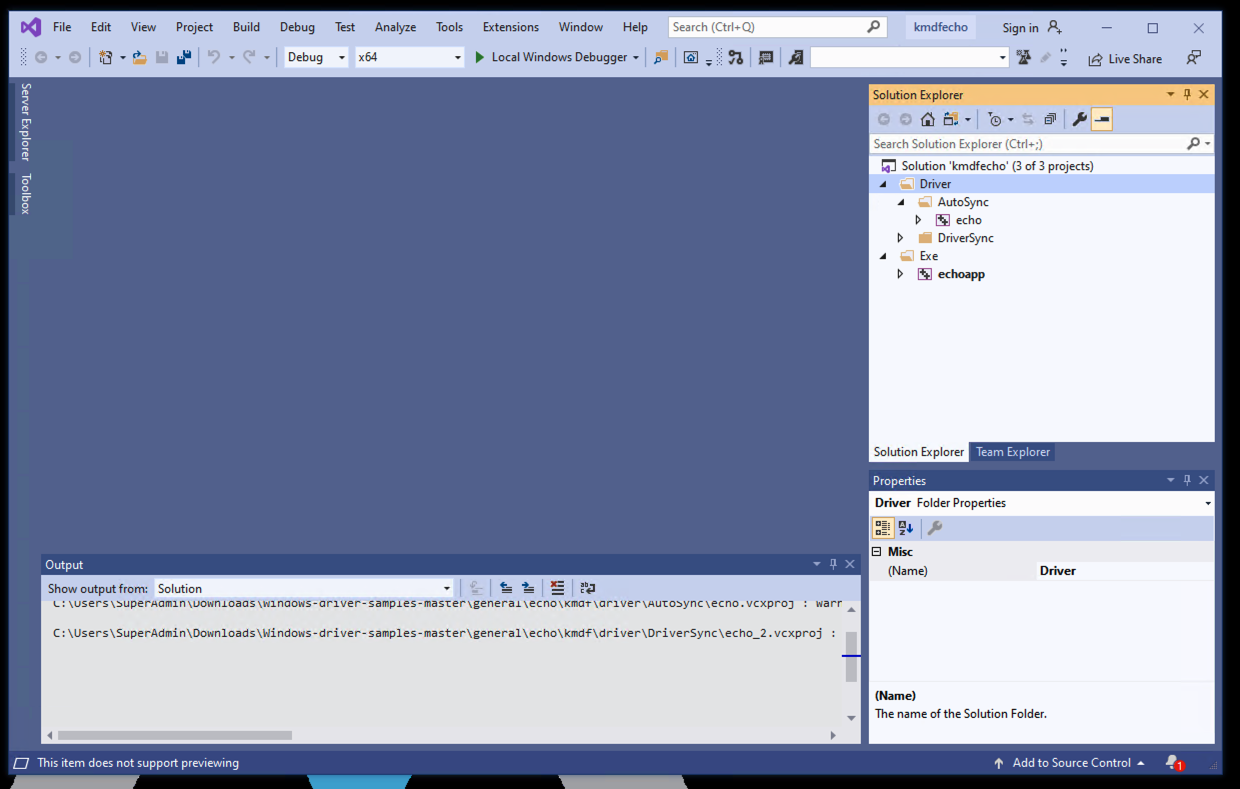
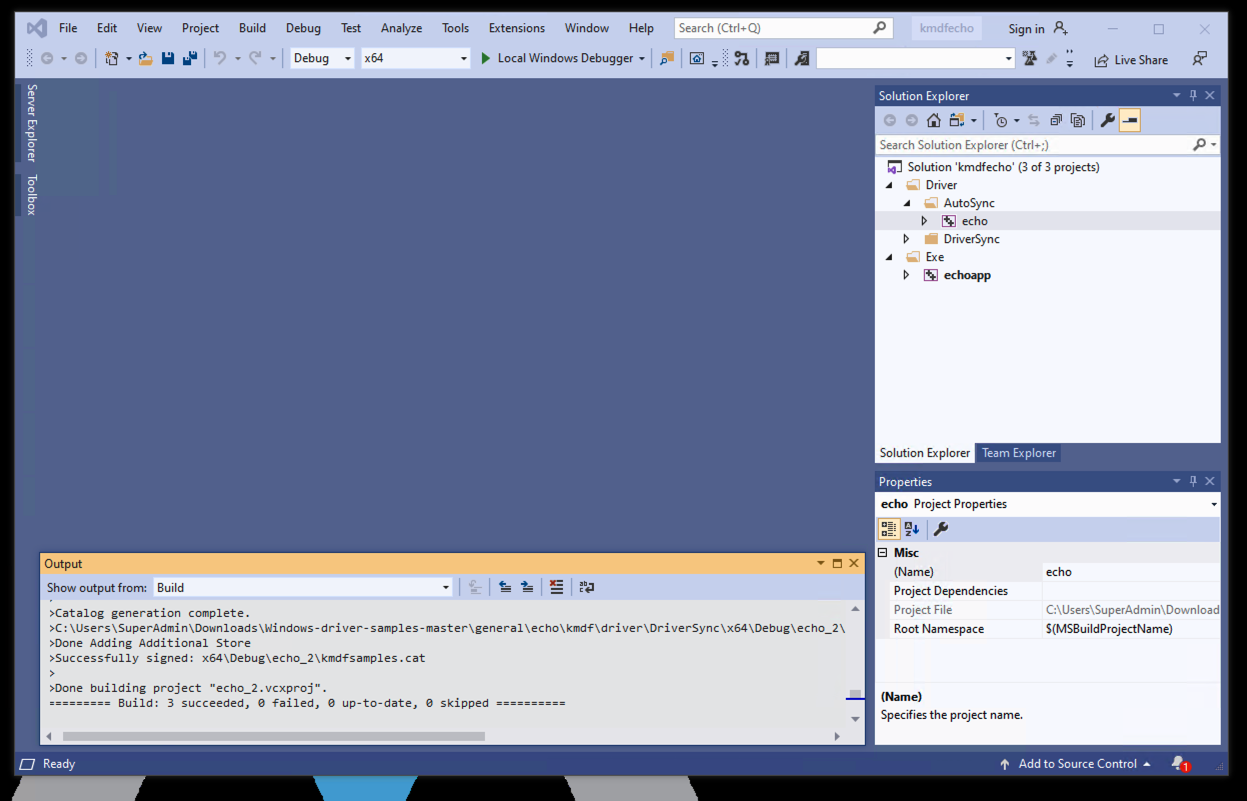
At the bottom, messages scroll by, ending with "3 succeeded", as shown below.
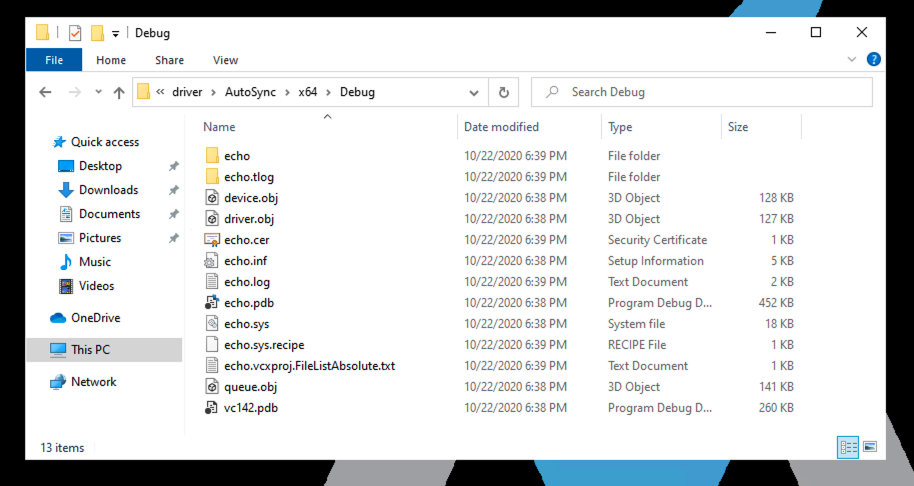
Open these subfolders:
Windows-driver-samples-master\general\echo\kmdf\driver\AutoSync\x64\Debug
Open your Downloads folder.
Open these subfolders:
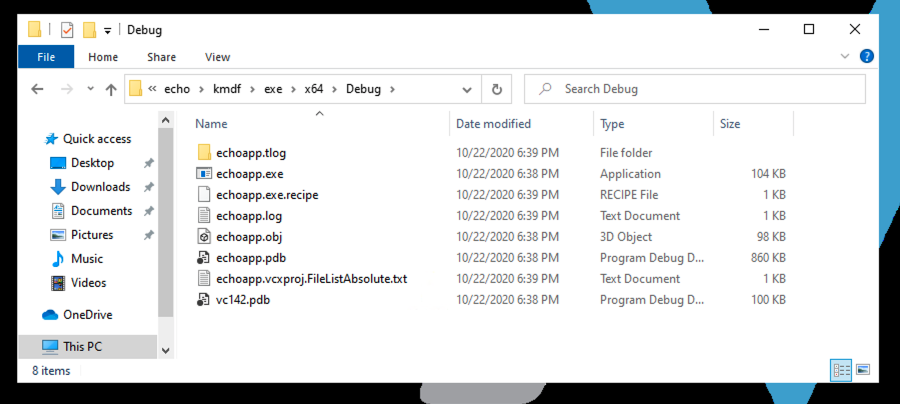
Windows-driver-samples-master\general\echo\kmdf\exe\x64\Debug
On your host computer, right-click the echo.sys file and click Copy.
On your target computer's desktop, right-click and click Paste.
Repeat the process for these five files, two of which are in different folders than the ones you opened above. Note that your username may be different from the "SuperAdmin" name I used.
C:\Users\SuperAdmin\Downloads\Windows-driver-samples-master\general\echo\kmdf\driver\AutoSync\x64\Debug\echo.cer
C:\Users\SuperAdmin\Downloads\Windows-driver-samples-master\general\echo\kmdf\driver\AutoSync\x64\Debug\echo.sys
C:\Users\SuperAdmin\Downloads\Windows-driver-samples-master\general\echo\kmdf\driver\AutoSync\x64\Debug\echo.inf

C:\Users\SuperAdmin\Downloads\Windows-driver-samples-master\general\echo\kmdf\driver\AutoSync\x64\Debug\echo\kmdfsamples.cat

C:\Program Files (x86)\Windows Kits\10\Tools\x64\devcon.exe
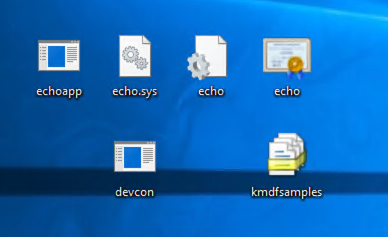
Note that a default Windows 10 machine will not show the file extension, but you can identify the file from its icon.
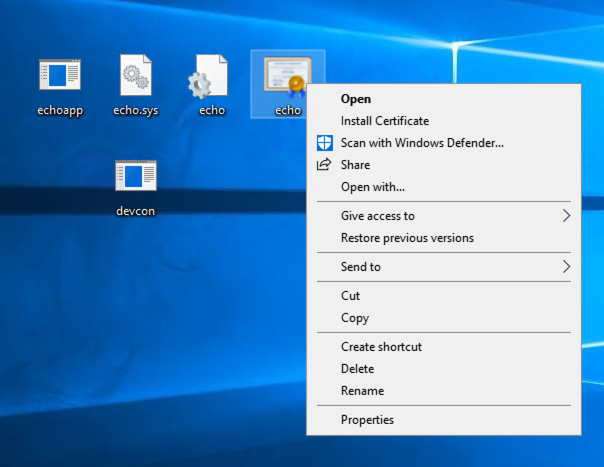
In the Certificate Import Wizard, click Next, Next, Finish.
On the target computer, in the Administrator Commmand Prompt, press Ctrl+C to stop ncat.
Then execute these commands, replacing the IP address with the IP address of your host computer.
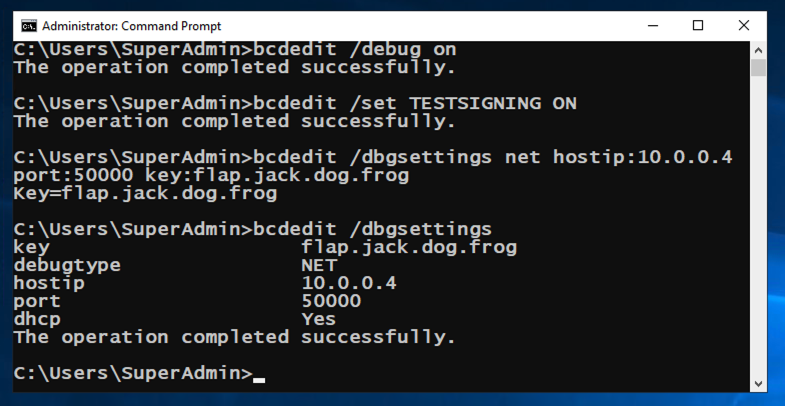
bcdedit /debug on
bcdedit /set TESTSIGNING ON
bcdedit /set loadoptions DDISABLE_INTEGRITY_CHECKS
bcdedit /dbgsettings net hostip:10.0.0.4 port:50000 key:flap.jack.dog.frog
bcdedit /dbgsettings
Then execute these commands, replacing "SuperAdmin" with your username.
cd \Users\SuperAdmin\Desktop
devcon install echo.inf root\ECHO
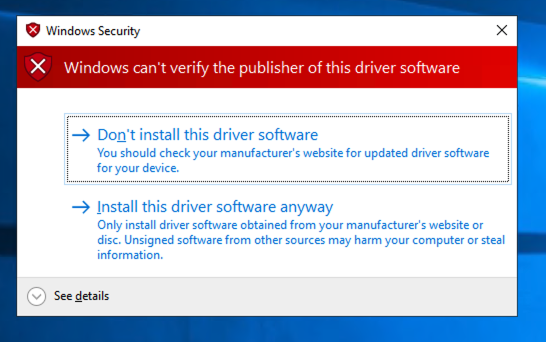
Click "Install this driver software anyway".
Troubleshooting
If devcon fails, there is a useful logfile here:
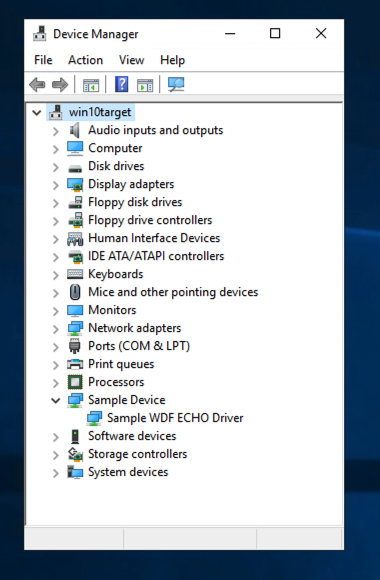
Expand "Sample Device" to see the "Sample WDF ECHO Driver", as shown below.
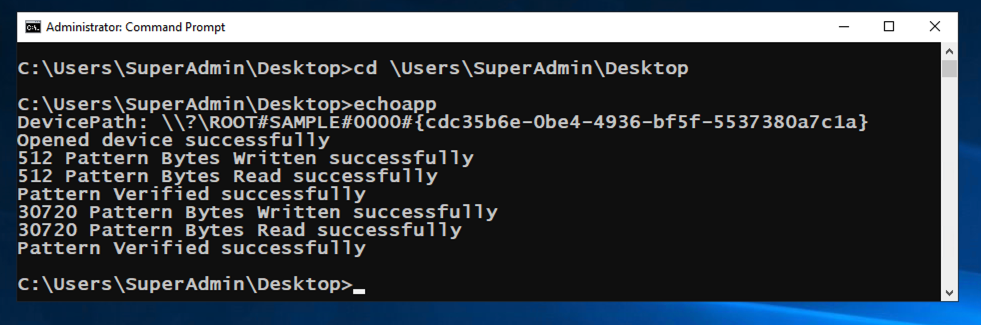
cd \Users\SuperAdmin\Desktop
echoapp
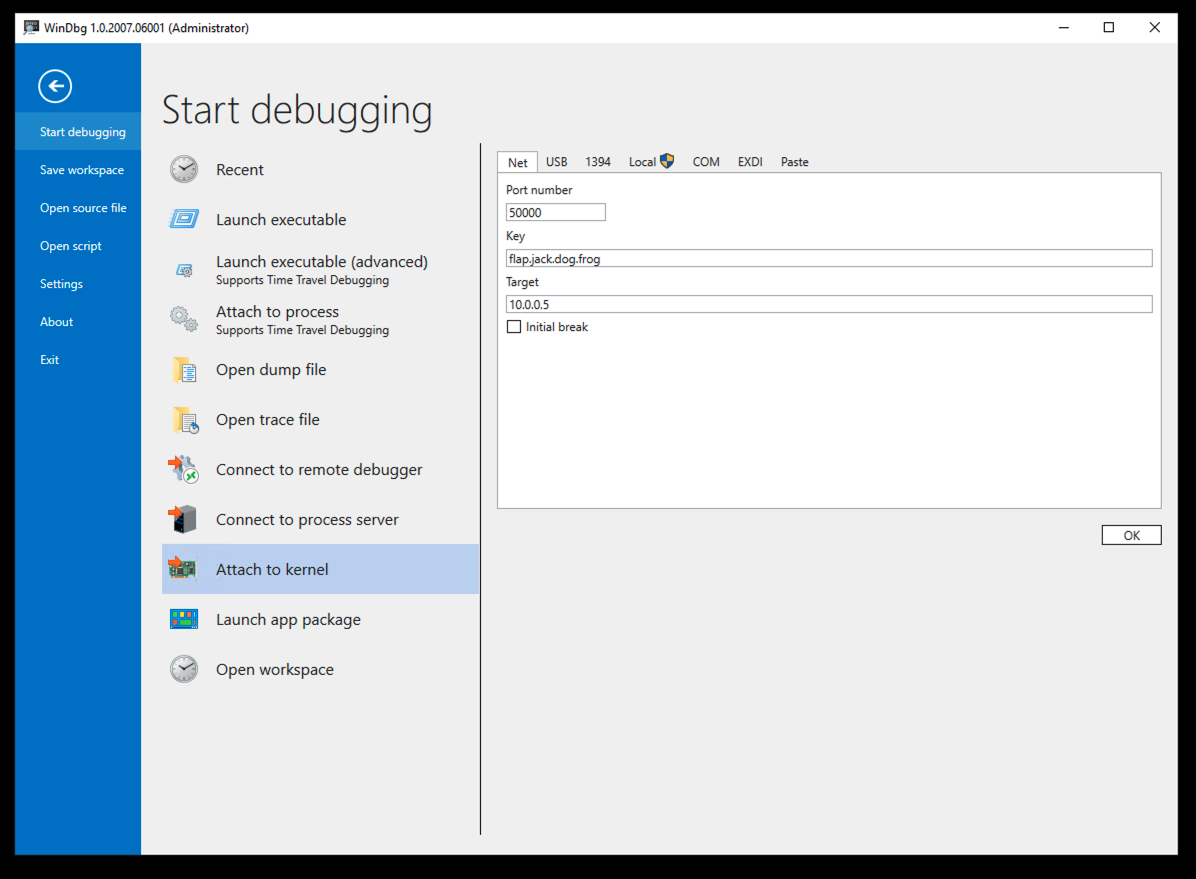
In the right pane, on the Net tab, enter these values, replacing the IP address with the IP address of your target computer.
At the lower right, click the OK button.
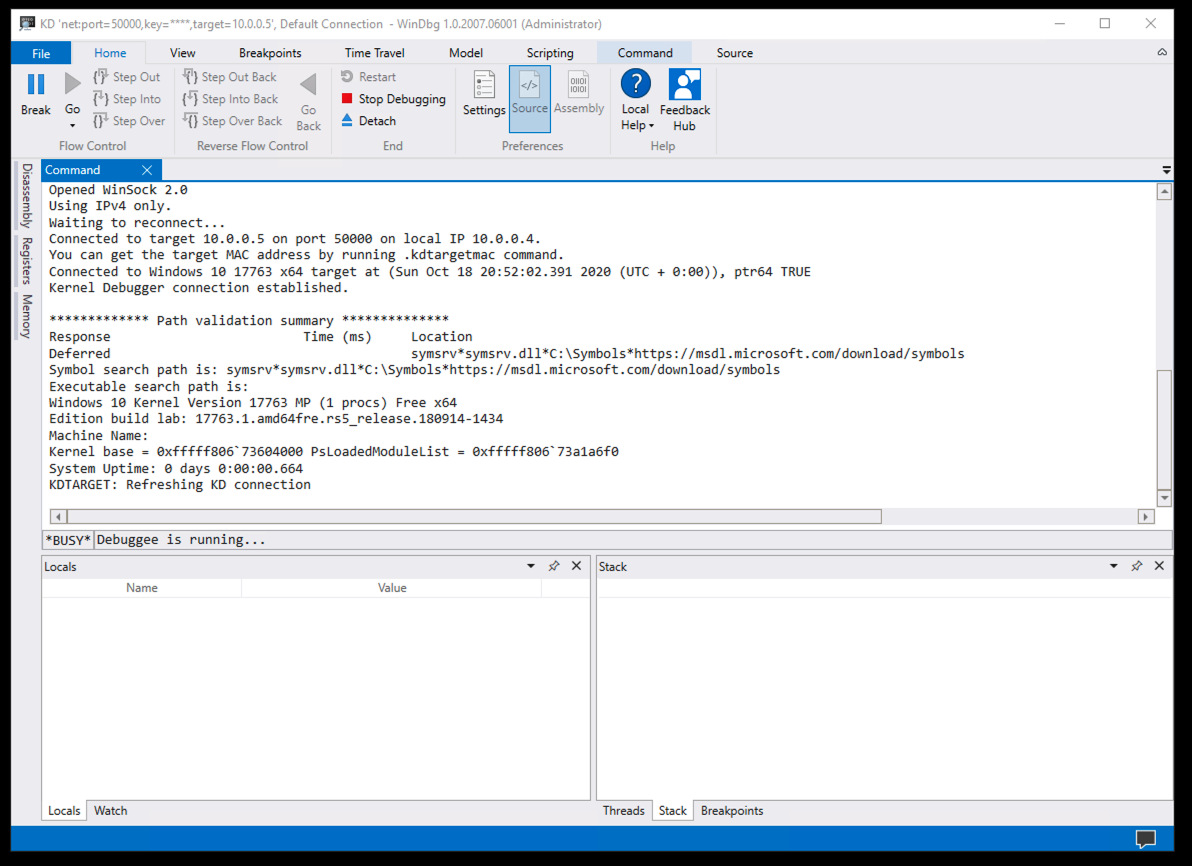
At the top left of WinDbg, click Break.
!sym noisy
.reload /f
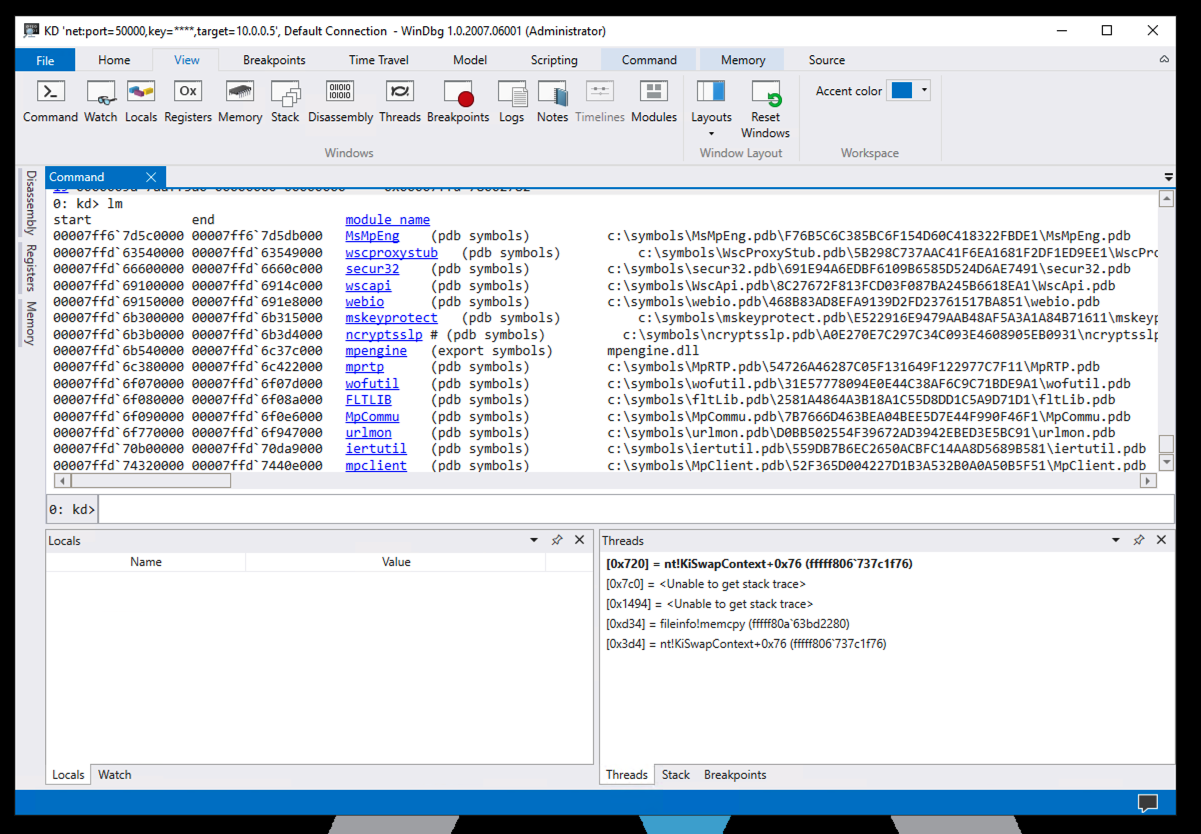
lm
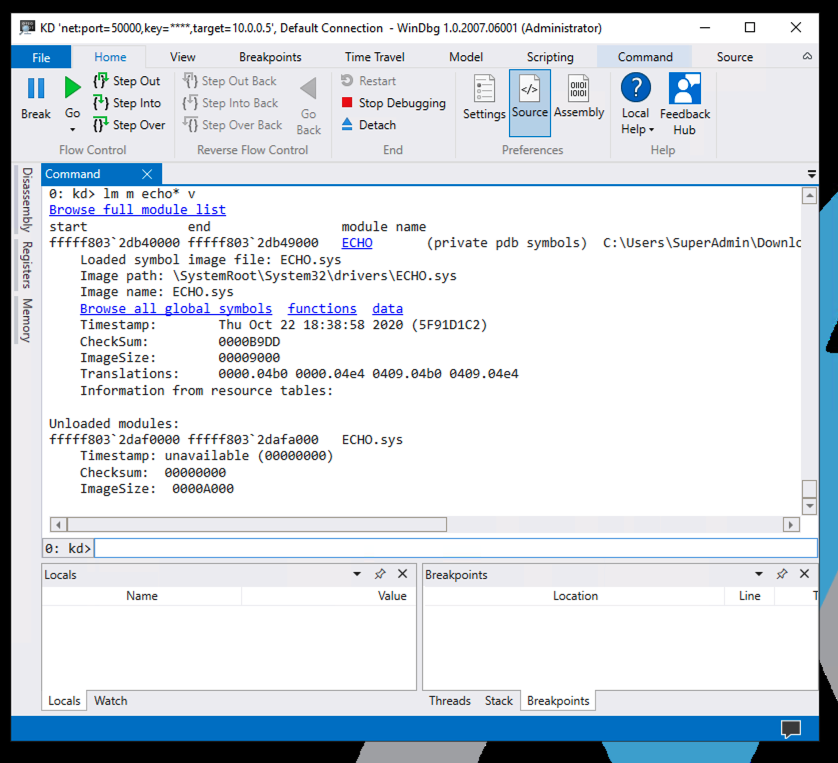
lm m echo* v
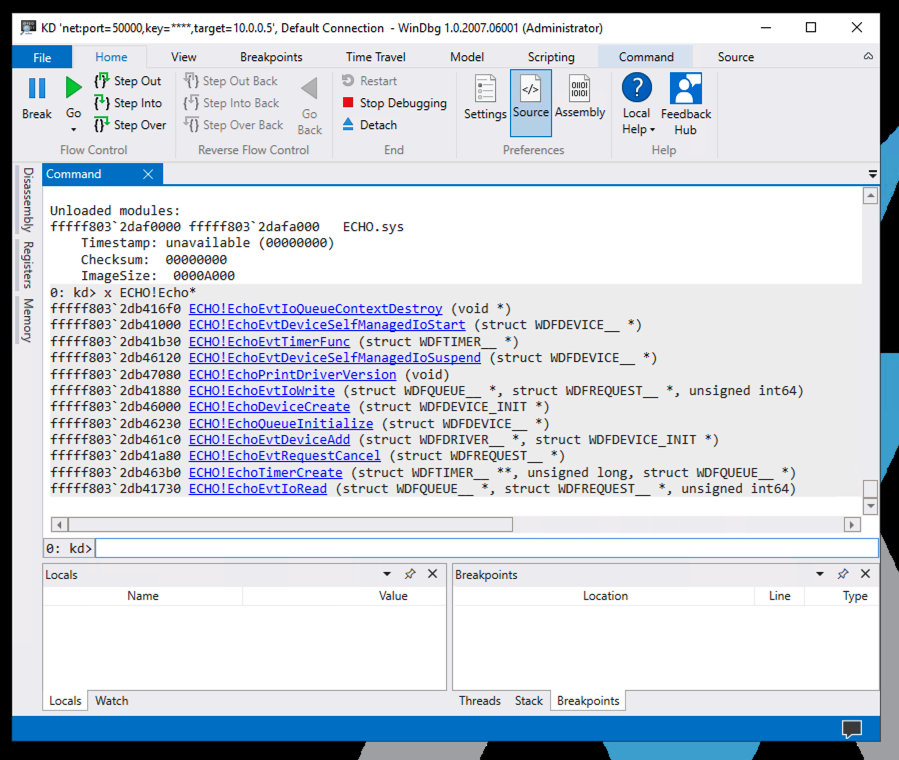
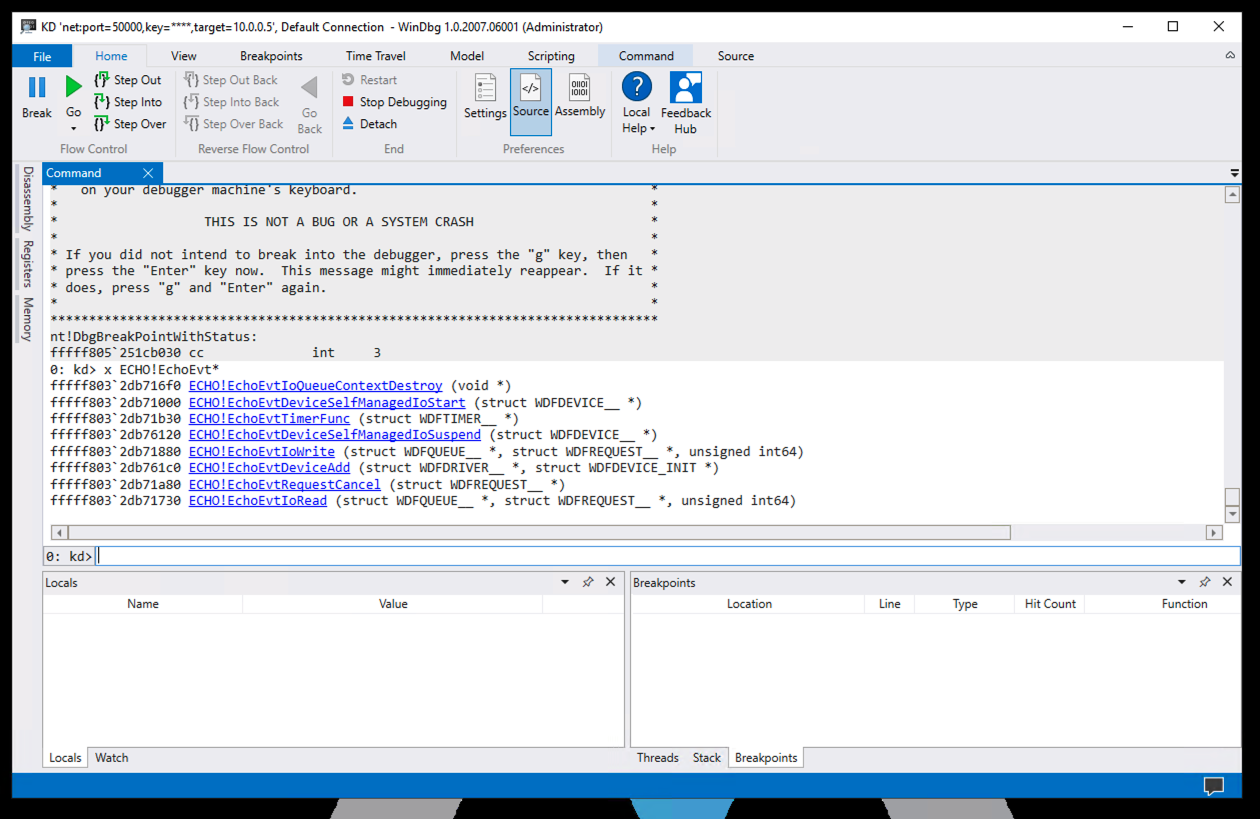
To see symbols in the echo driver that begin with Echo, execute this command:
x ECHO!Echo*
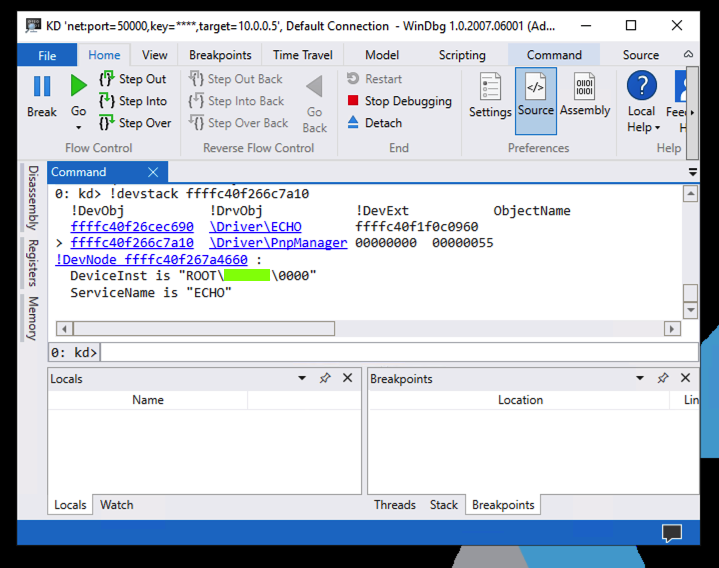
!devnode 0 1
Click the blue address after PDO (Peripheral Device Object), as shown in the image below.
The result shows information about the driver, as shown below.
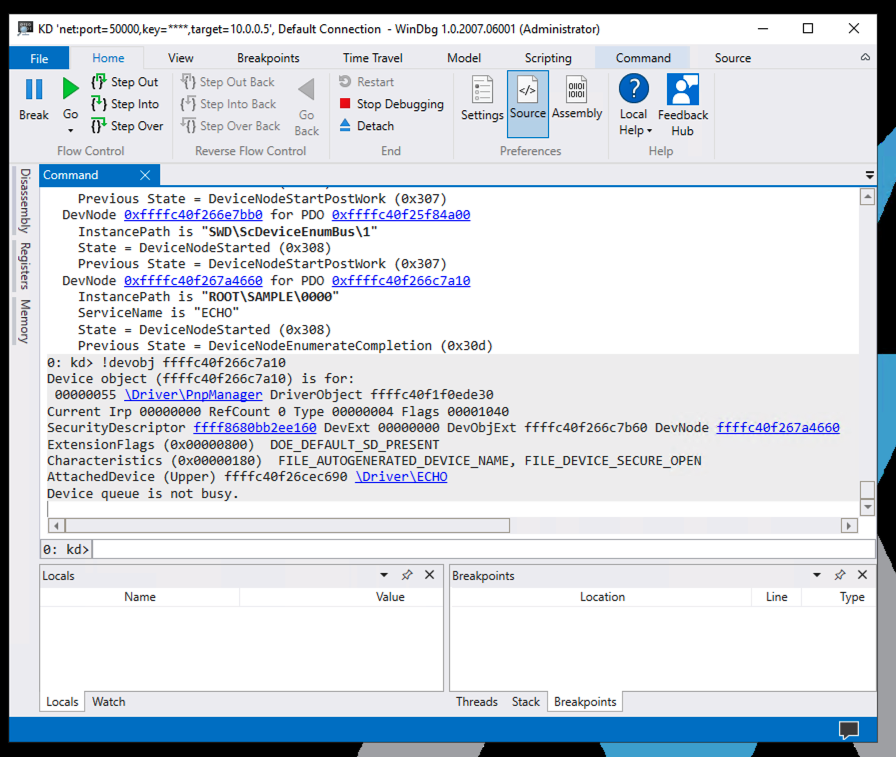
PMA 434.1 DeviceInst (20 pts)
Execute this command to see the Plug and Play information associated with the device driver.Replace the number below with the number you used in the previous command.
The flag is covered by a green box in the image below.
x ECHO!EchoEvt*
To put a breakpoint on that function, execute this command:
bm ECHO!EchoEvtDeviceAdd
Click Yes
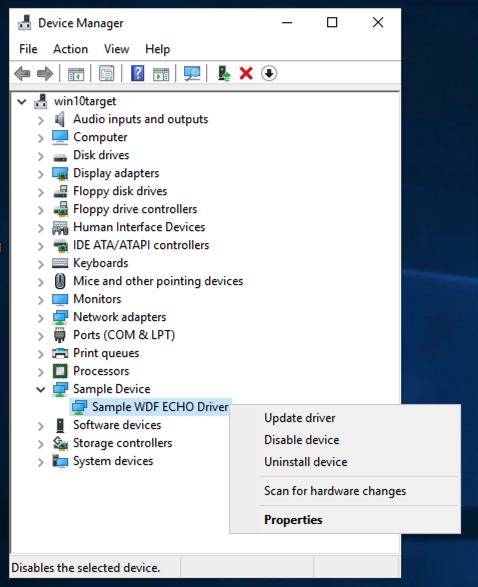
Right-click "Sample WDF ECHO driver" and click "Enable device".
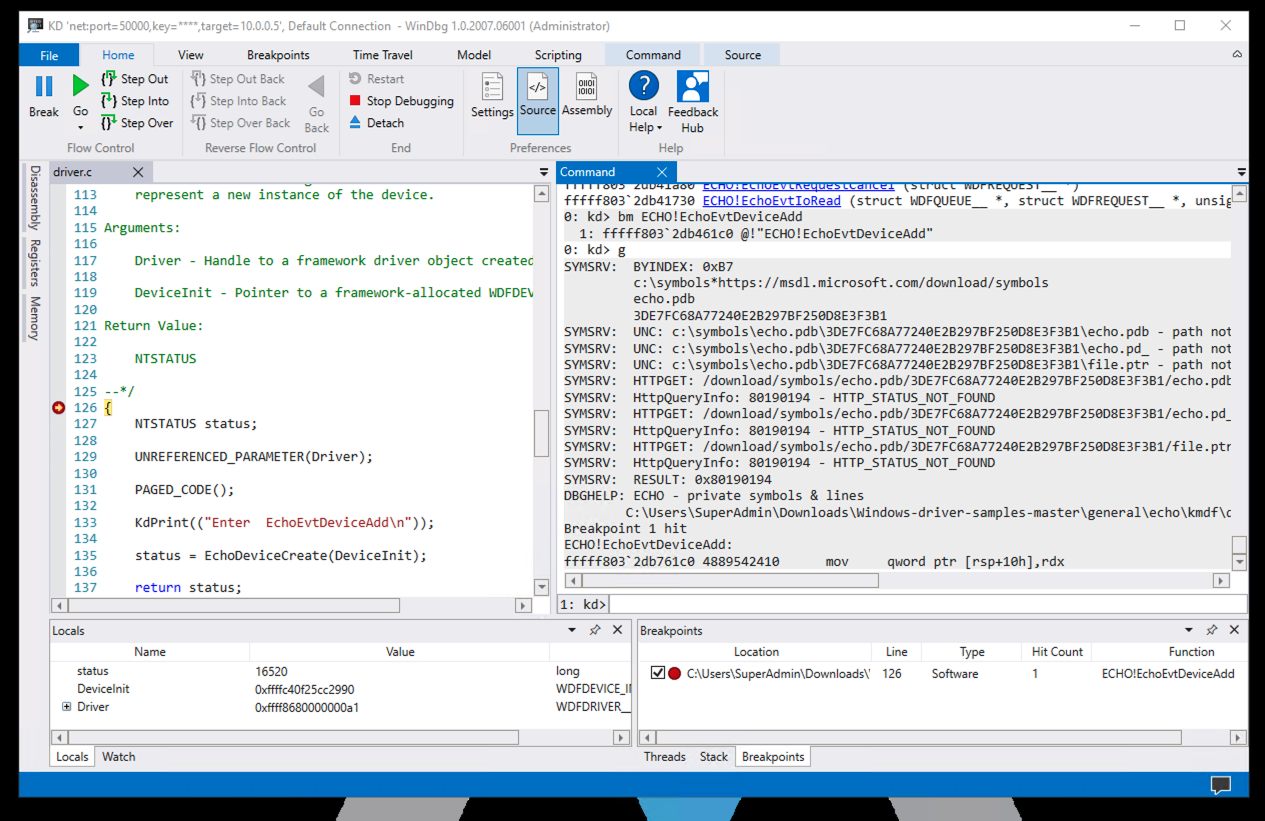
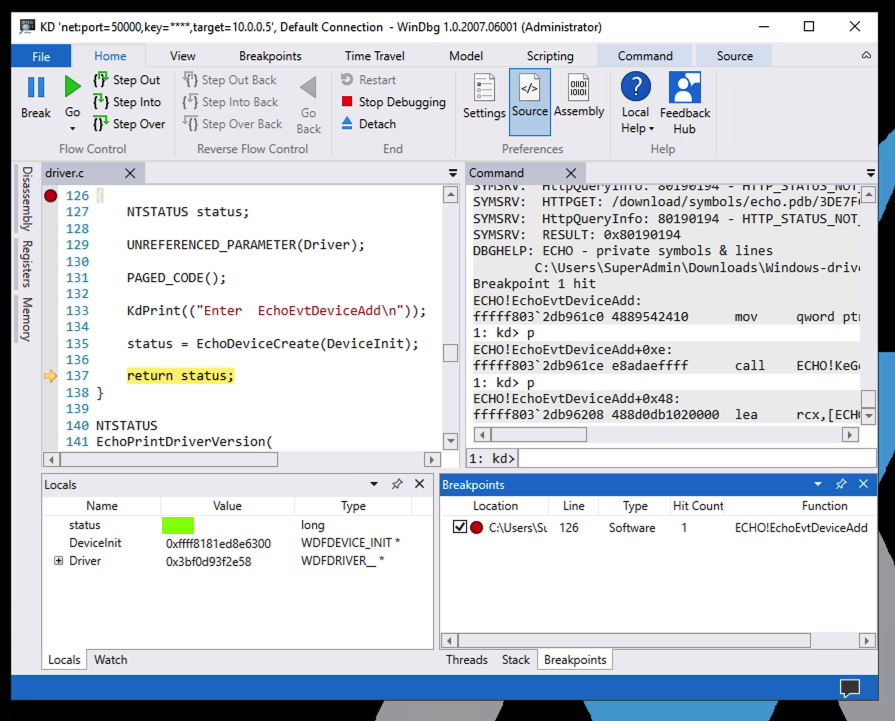
PMA 434.2 Status (10 pts)
In the Ribbon, click the "Step Over" button until you reach the "return status" command, as shown below.The flag is the value of the status local variable, covered by a green rectangle in the image below.
Execute this command:
bcdedit /debug off
Posted 10-22-20