Otherwise, follow the instructions below to download and install it.
Go to this page to get the new WinDbg, which is no longer called a "preview":
Install the Windows debugger
Windows 11 on ARM
The link above won't work for Windows on ARM. Instead, install the Windows SDK from the link below and install "Debugging Tools for Windows":Windows SDKTo launch WinDbg, navigate to:C:\Program Files (x86)\Windows Kits\10\Debuggers\arm64\windbg.exe
Navigate to:
C:\Windows\System32\notepad.exe
and open it.
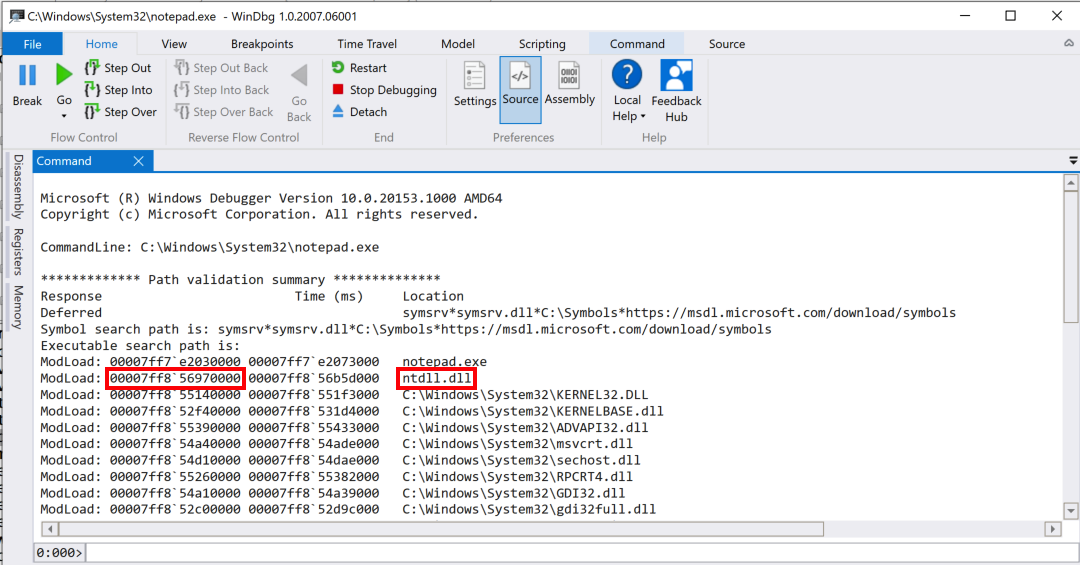
Here you see Notepad loading the DLLs it uses.
Notice the address shown for ntdll, the user-mode face of the Windows kernel, outlined in red in the image below.
Launch Process Explorer as Administrator and click notepad.exe. If you can't find the "notepad.exe" process, just skip the usage of Process Explorer.
Click View, "Show Lower Pane".
Click View, "Lower Pane View", DLLs.
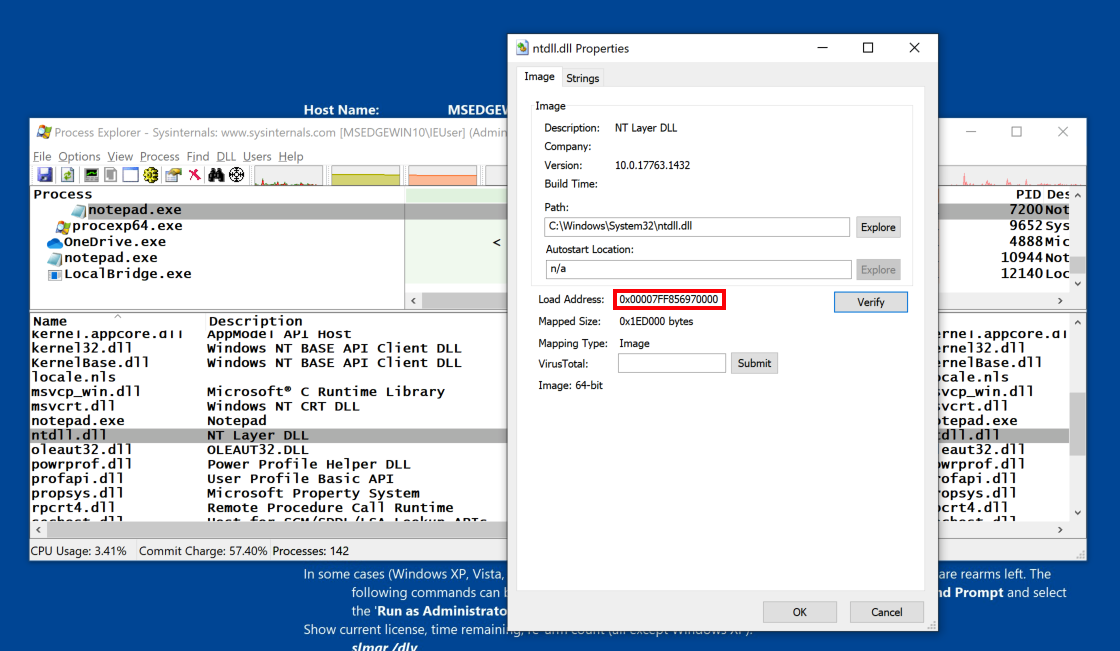
In the lower pane, right-click ntdll and click Properties.
As shown below, the load address shown here matches the first address shown in WinDbg.
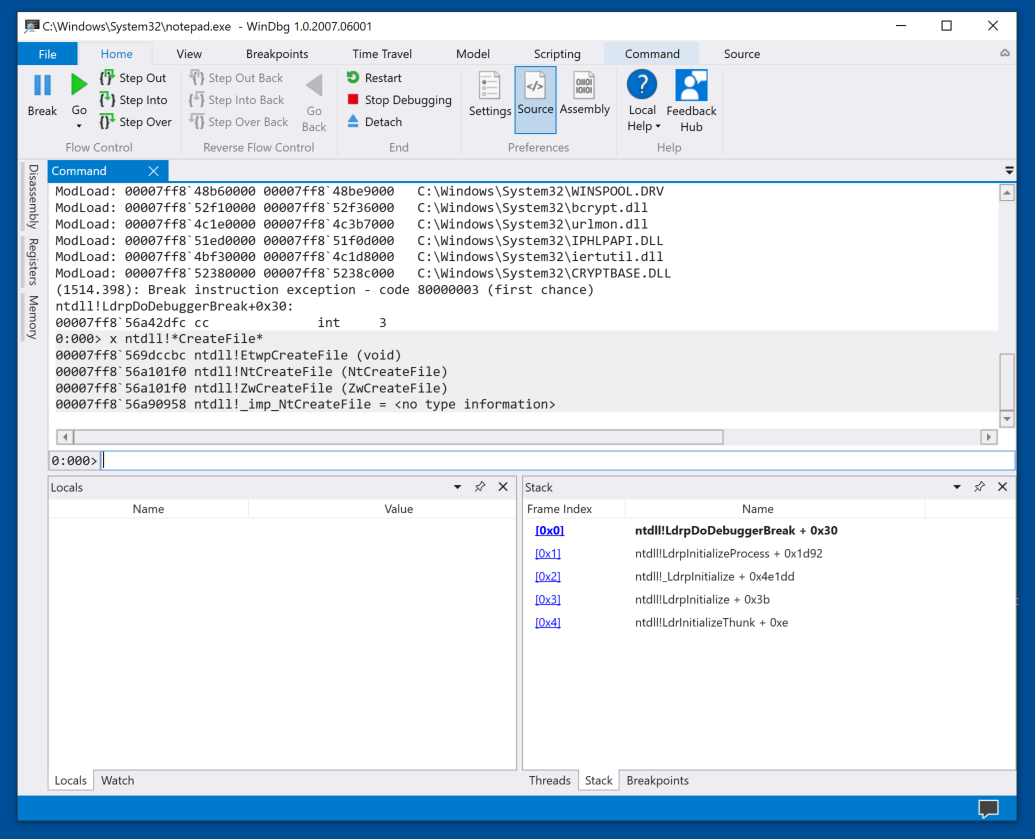
In WinDbg, in the center pane, scroll down to the bottom.
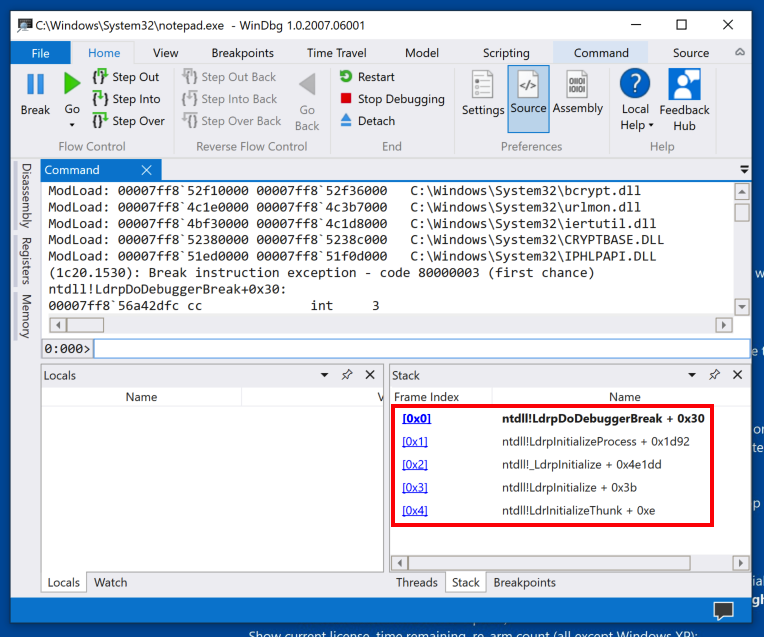
Here you can see that the program has stopped at a break instruction inside the ntdll module, as shown below.
From the menu bar, click View, Stack.
The lower right pane shows the stack frames, indicating that we are five calls deep, all within ntdll.
(When I did this on Windows 11 on 4-10-25, the stack was six calls deep.)
x notepad!*
To see the symbols containing the word main, execute this command:
x notepad!*main*
Note: when I did this on Oct 18, 2022, the name had changed to wWinMain. If you see that name, use it in the commands below instead of "WinMain".
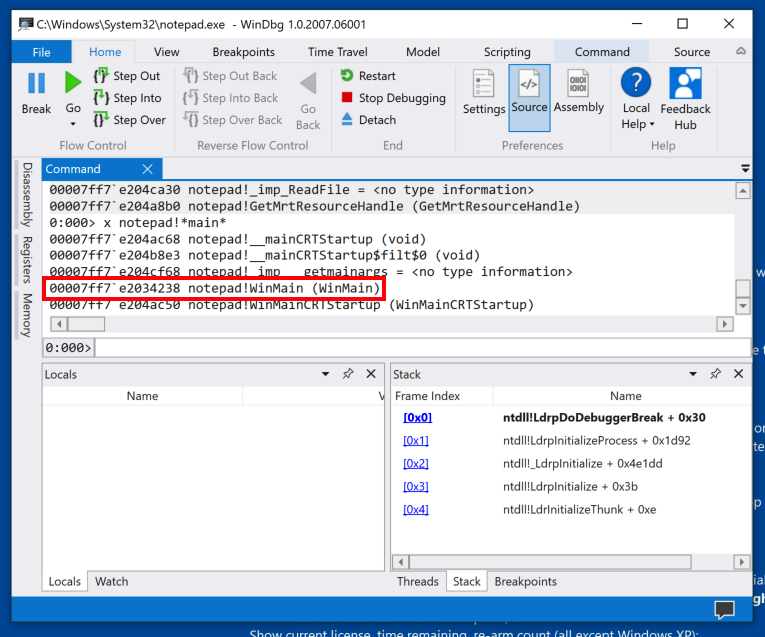
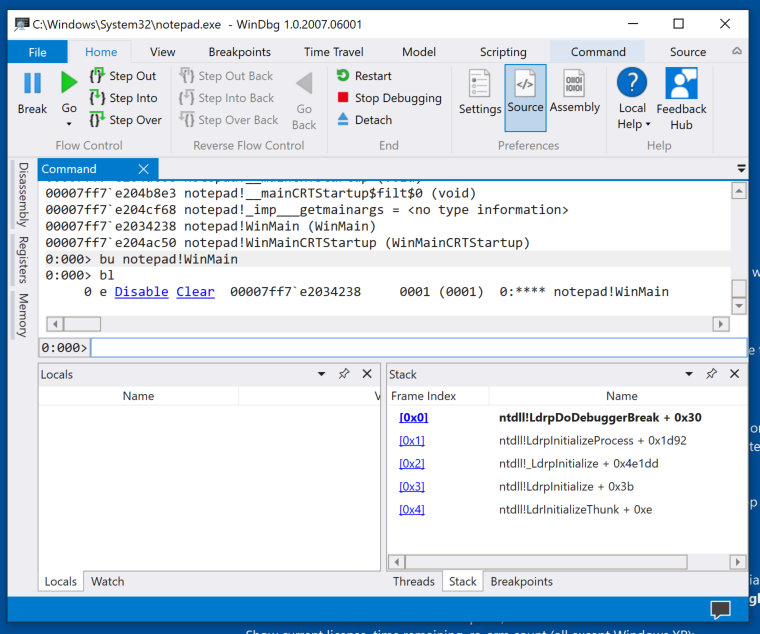
bu notepad!WinMain
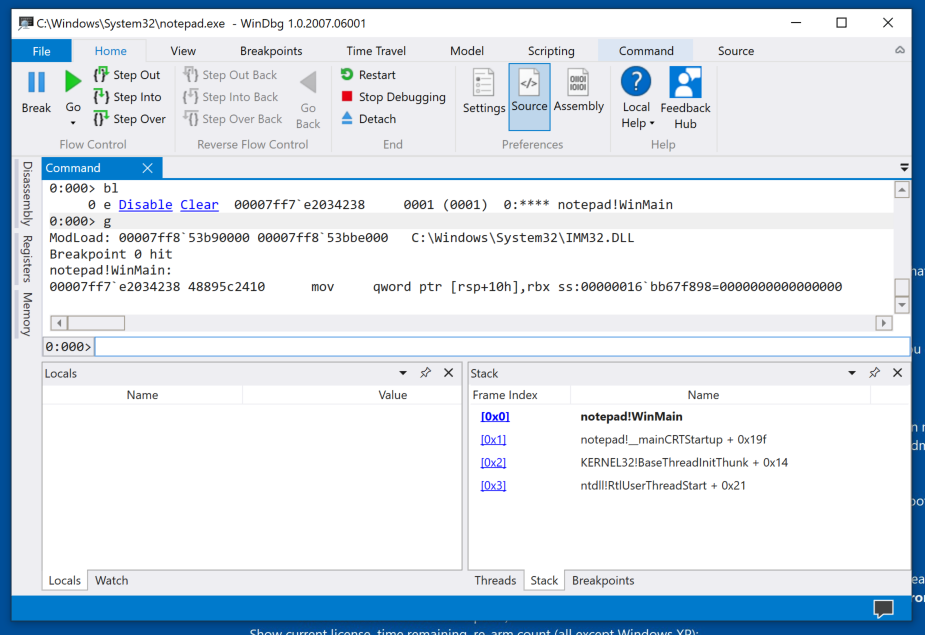
bl
g
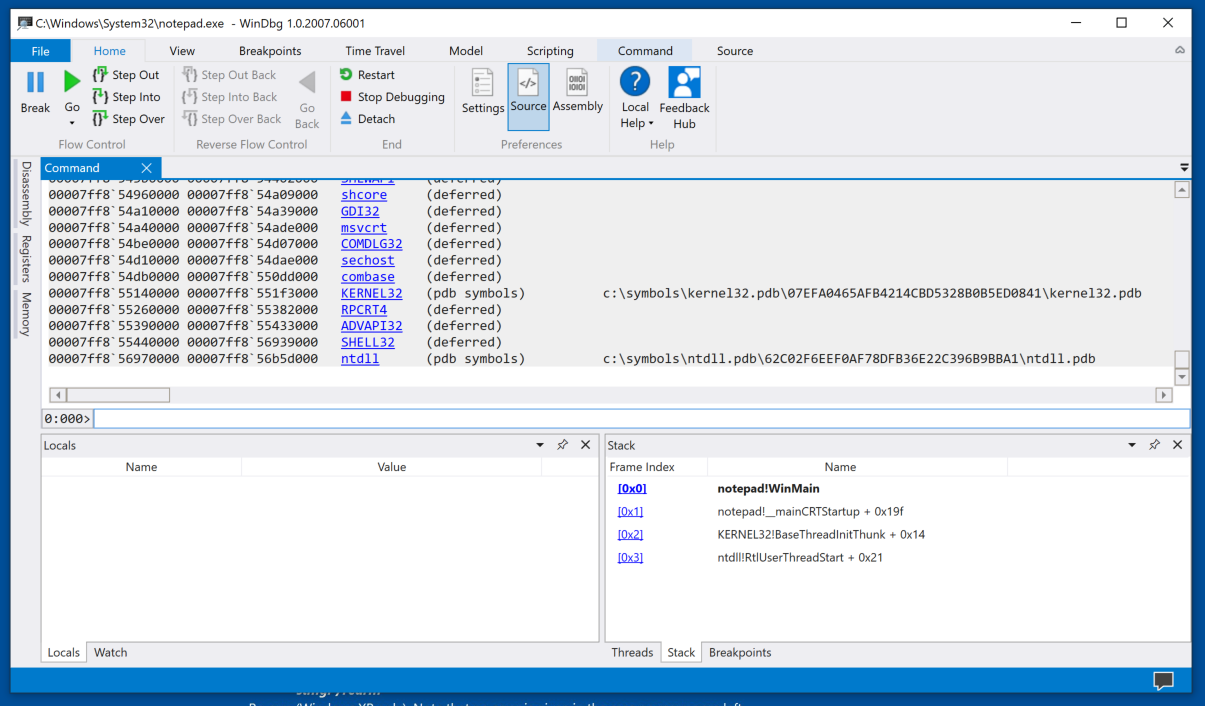
lm
Those are symbol files that make debugging easier.
k
This is the same list as the one that appears in the lower right pane, with more detail.

Execute this command:
x ntdll!*CreateFile*
bu ntdll!ZwCreateFile
g
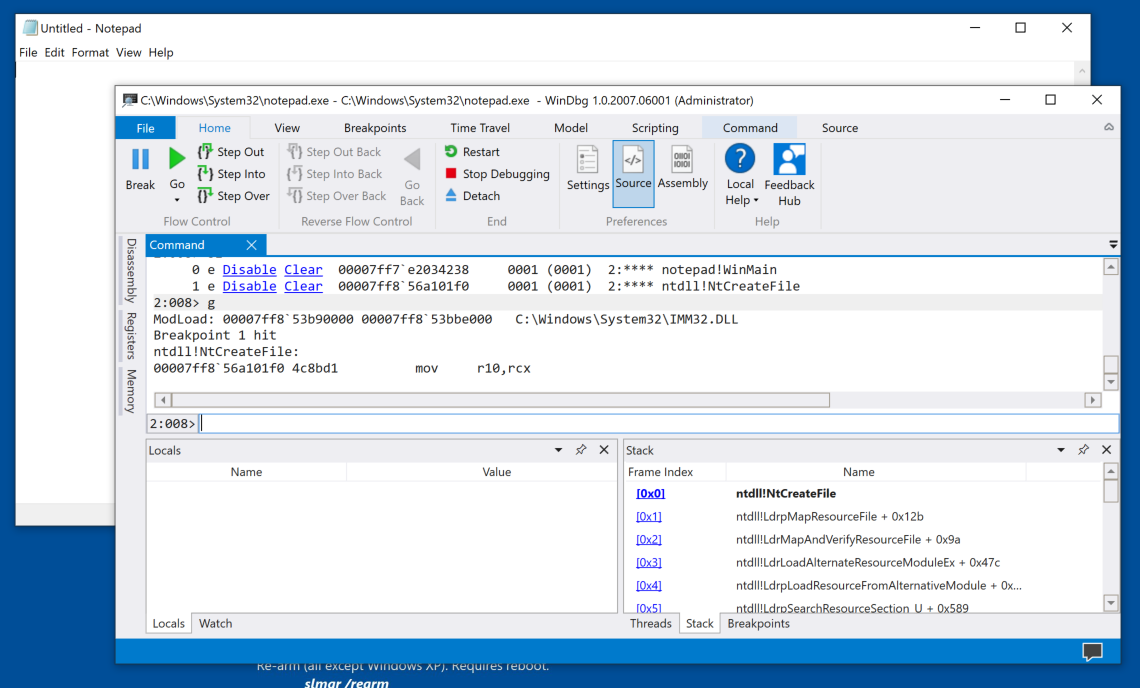
k
Scroll back up to see the start of the k output, as shown below.
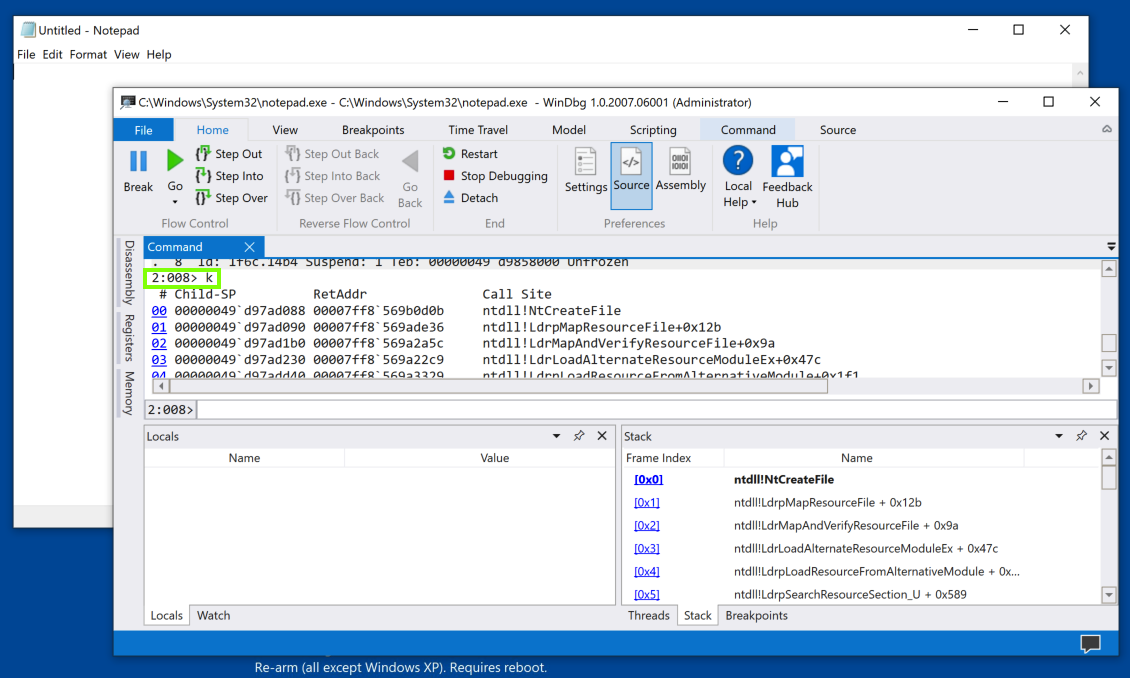
The first number is the processor number, and the second is the thread number.
When I did it, the breakpoint was hit by thread 8, running on processor 2. Your numbers may be different.
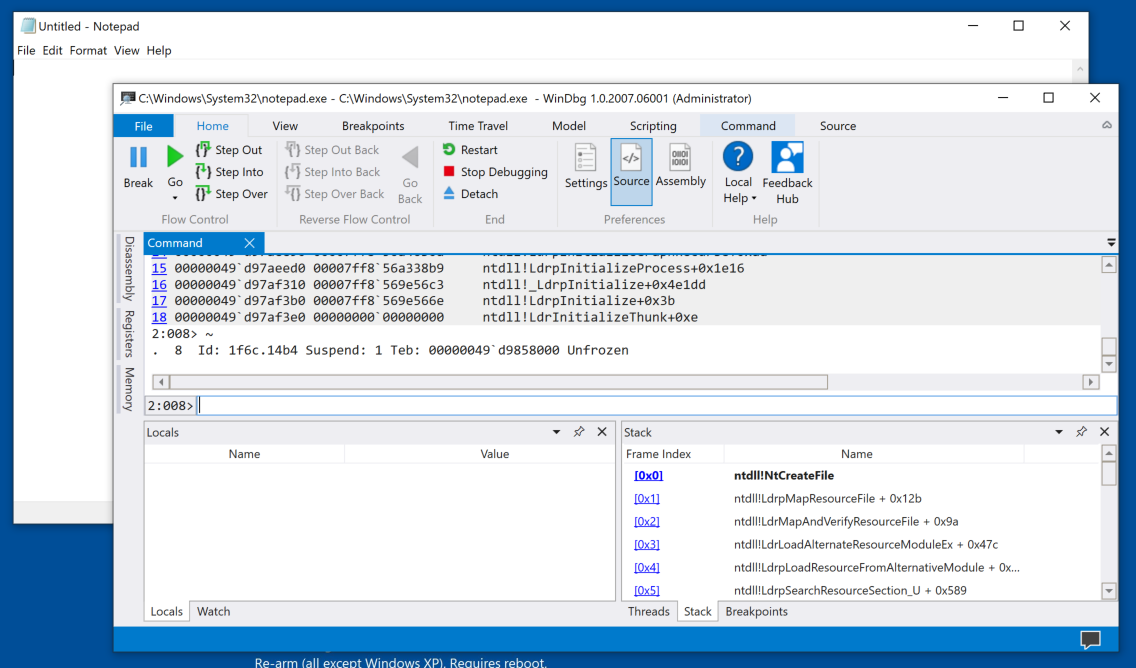
To see all the threads in the Notepad process, execute this command (the tilde character, a Shift+Backtick):
~
bl

In the line for breakpoint 1, click Clear.
The system executes the bc 1 command for you.
Repeat the process to delete breakpoint 0.
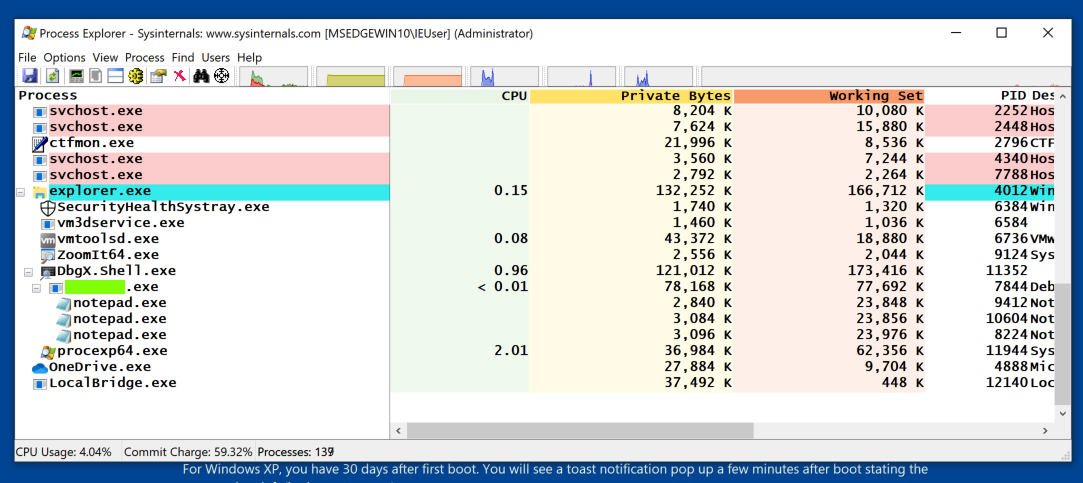
PMA 430.1 Parent Process (15 pts)
Launch Process Explorer as Administrator. Scroll to the bottom and find the Notepad process. (There may be more than one, as shown below.)The flag is the name of the parent process, covered by a green box in the image below.
Posted 10-13-20
Process Explorer instructions updated 10-14-20
Bugs fixed 4-13-2021
Minor edits 11-2-21
Note about wWinMain added 10-18-22
"Preview" removed, video added 4-22-24
Minor text updates 4-10-25
References to Win 11 updated 4-9-26