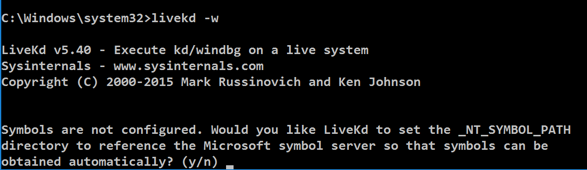
livekd -w
Type y and press Enter.
Livekd asks "Enter the folder to which symbols download". Press Enter to accept the default option.
Windbg launches, as shown below.
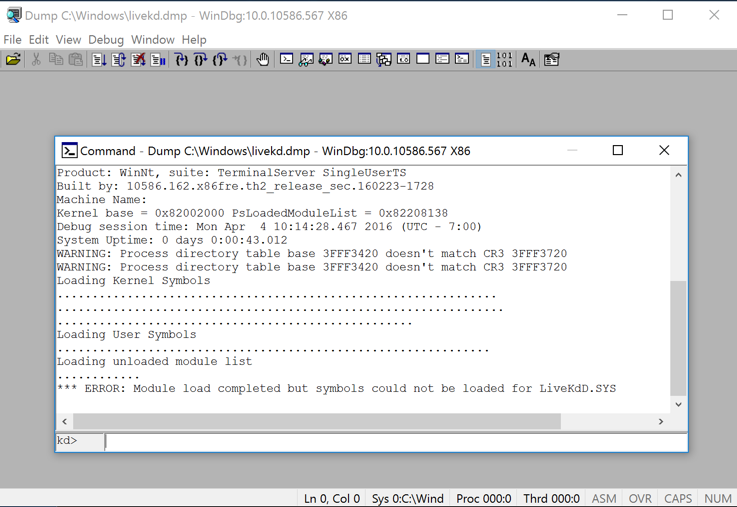
This is a strange combination of a GUI and command-line, like the other debuggers we've used. Commands are typed into the box at the bottom and the results appear in the large top pane.
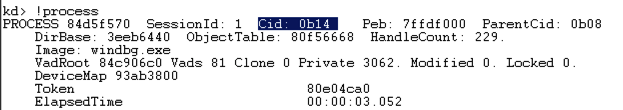
At the bottom of the Command window, in the command bar, execute this command:
!process
When I did it, the Cid was 0b14 in hexadecimal, which is 11*256 + 16 + 4 = 2836.
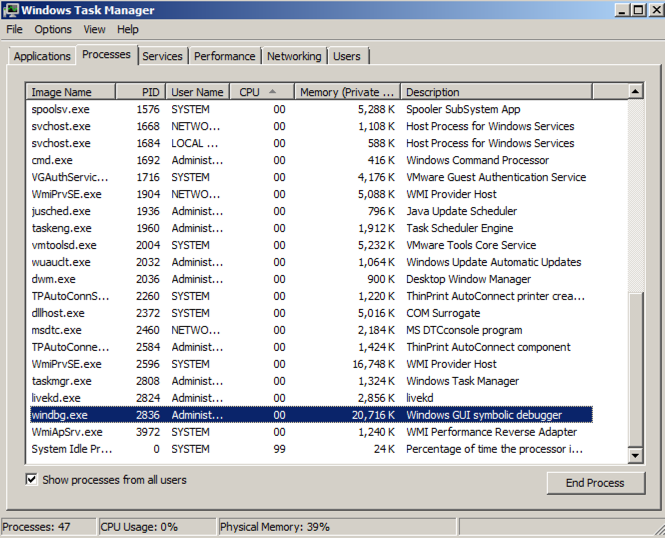
Find the windbg process, and its PID, as shown below. It should match the Cid from Windbg.
Close Task Manager. In Windbg, at the bottom of the Command window, in the command bar, execute this command:
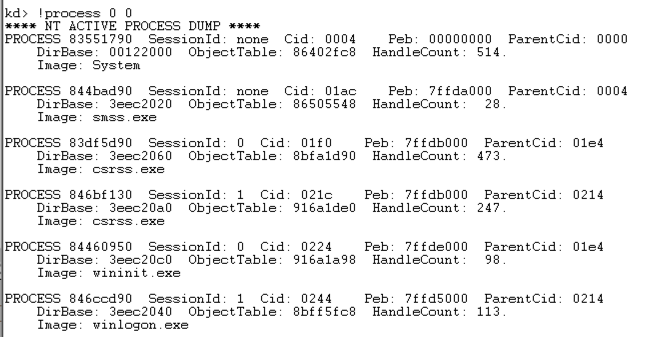
!process 0 0
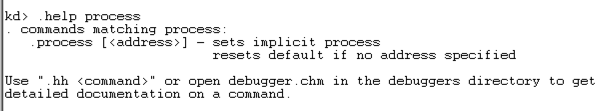
.help process
At the bottom of the Command window, in the command bar, execute this command:
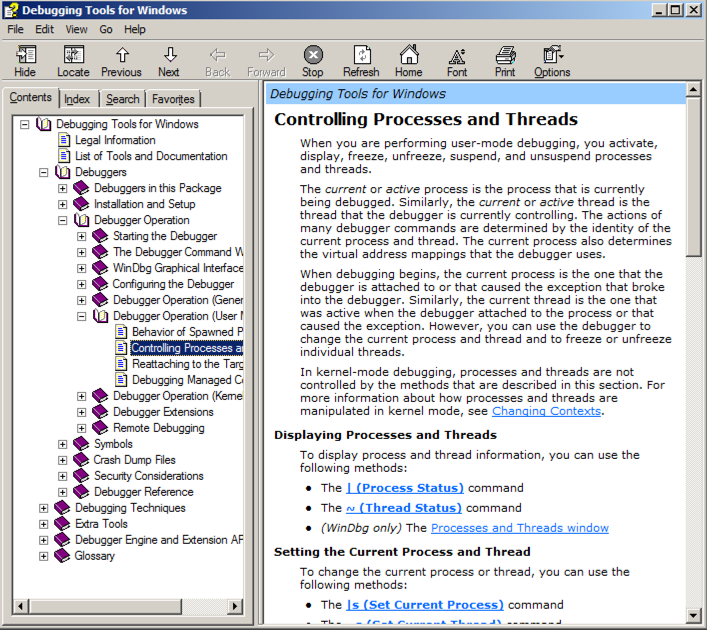
.hh process
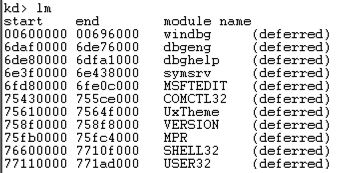
lm
Scroll back to see the lm command you entered, and the first few loaded kernel modules, as shown below.
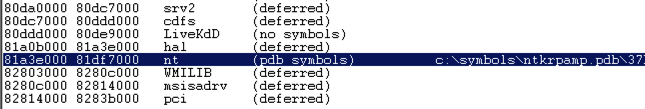
Scroll down to find the module named nt, as shown below. It's easy to spot because it'e one of the few modules that shows a Symbols path.
This is Ntoskrnl, the main kernel module.
dd Display dwords (32-bit values)
da Display ASCII text
db Display Bytes and ASCII text
dt Display Type: Information about a variable, data type, or structure
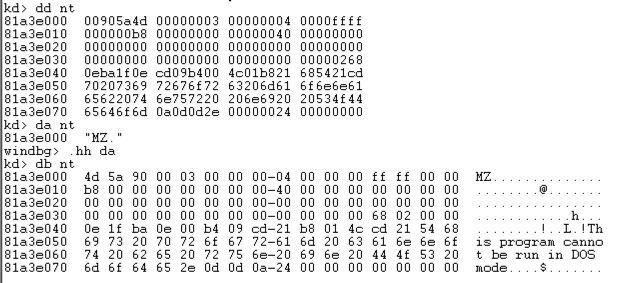
dd nt
You see the first several bytes of Ntoskrnl.exe, as shown below.
This may be more familiar in ASCII.
In WinDbg, execute this command:
da nt
You see the characters "MZ" --they are at the start of every EXE file.
In WinDbg, execute this command:
db nt
This displays the bytes on the left, and the ASCII on the right. Now you can see the message "This program cannot be run in DOS mode", which appears at the start of many EXE files.
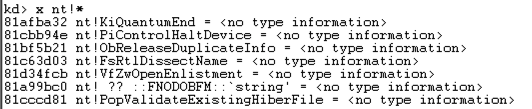
x nt!*
This finds all the functions in Ntoskrnl. There are a lot of them, as shown below. It may take a minute or so to show them.
In WinDbg, execute this command:
x nt!*Create*
This finds all the symbols in Ntoskrnl that contain the word "Create".
There are a lot of them, too.
In WinDbg, execute this command:
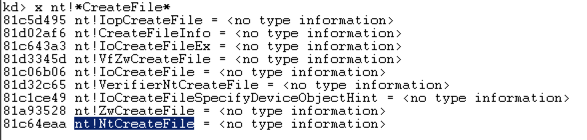
x nt!*CreateFile*
This finds all the symbols in Ntoskrnl that contain the word "CreateFile".
There are only about ten of those, including "nt!NtCreateFile", as shown below:
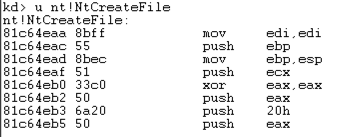
u nt!NtCreateFile
This shows the first few bytes of the function, disassembled, as shown below:
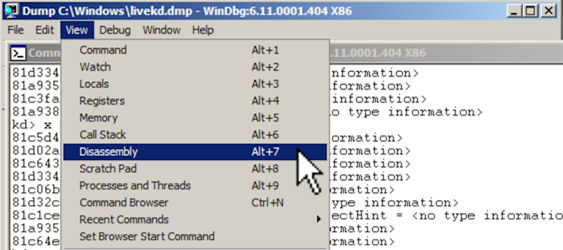
To see more of this function, it helps to use the WinDbg Disassembly window.
If the Command window is maximized, make it smaller.
From the WinDbg menu bar, click View, Disassembly, as shown below:
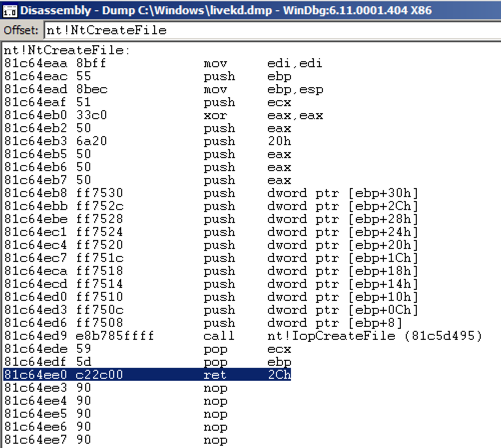
In the Offset bar at the top, enter
nt!NtCreateFile
This shows the assembly code before and after the start of the NtCreateFile function. Using the up-arrow and down-arrow keys, you can scroll to see the entire assembly code for this function, as shown below:
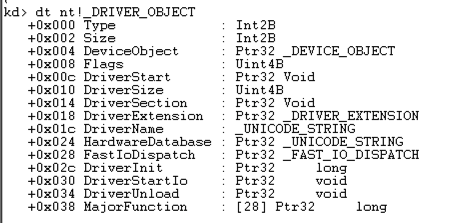
dt nt!_DRIVER_OBJECT
This shows the first few lines of a driver object structure, which stores information about a kernel driver, as shown below. Notice the DriverStart pointer--this contains the location of the driver in memory.
--RegistryKey------
Use the form
below to record your score in Canvas.
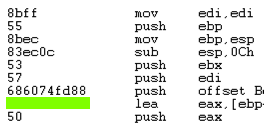
Find the hexadecimal values covered by the green box in the image below.
Use the form below to record your score in Canvas.
Hints
- Read the "Listing Modules" instructions above
- Read the .hh help page to find out how to list modules matching a pattern
- List the module named "beep"
- Read the "Searching for Functions" instructions above
- Find the functions in the Beep module
- Find the DriverEntry function in the Beep module
- Unassemble the DriverEntry function in the Beep module