https://www.microsoft.com/en-us/download/details.aspx?id=3138
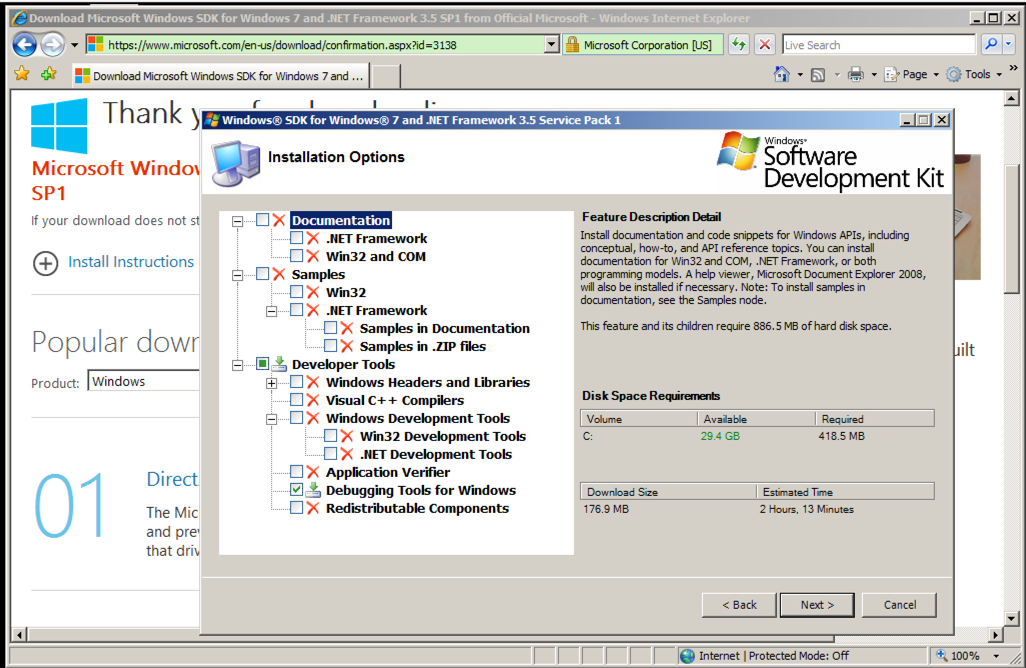
Install the Software Development Kit, with the Installation Options shown below:
windbg
If it fails to open, which is very common, that means the SDK did not adjust the Path. To fix it, click Start. Right-click Computer and click Properties.
Click "Advanced System Settings".
In System Properties, on the Advanced tab, click the "Environment Variables" button.
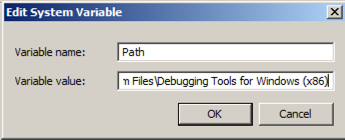
In the Environment Variables box, in the "System variables" section, scroll down and click Path. Click the Edit... button.
At the end of the Path, append a semicolon followed by the path to Windbg, which will be similar to this:
C:\Program Files\Debugging Tools for Windows (x86)\
Click OK three times.
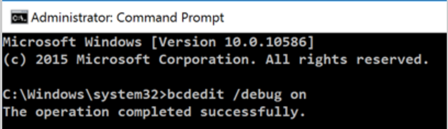
In the Administrator Command Prompt window, execute this command:
bcdedit /debug on
Click Start, Power, Restart.
https://technet.microsoft.com/en-us/sysinternals/bb897415.aspx
Click the "Download LiveKd" link.
Click "Open Folder".
Right-click LiveKD.zip and click "Extract All...", Extract.
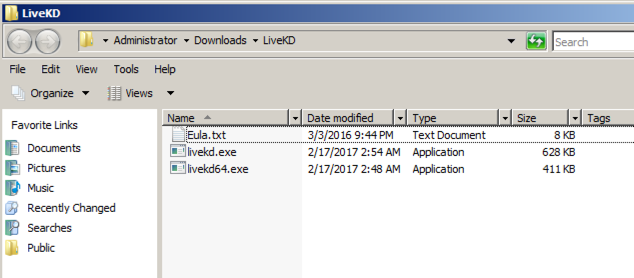
A LiveKd window opens, showing three files, as shown below. Notice the path to this folder. When I did it, it was
Administrator · Downloads · LiveKD
Open an Administrator Command Prompt window.
In the Administrator Command Prompt window, execute this command. If your extracted files are in a different folder, you will have to modify this command.
copy C:\Users\Administrator\Downloads\LiveKD\livekd.exe c:\Windows\System32

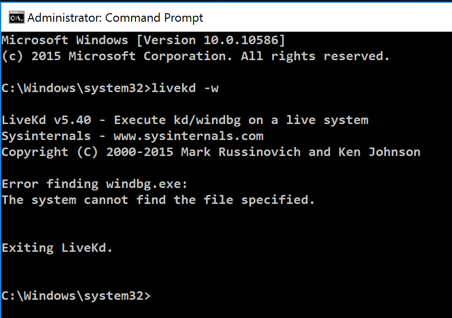
livekd -w
If you see "Error finding windbg.exe", as shown below, fix that with the Troublehooting advice in the box below.
Type y and press Enter.
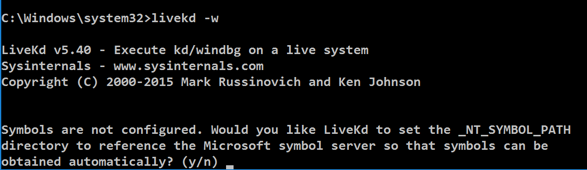
Livekd asks "Enter the folder to which symbols download". Press Enter to accept the default option.
Windbg launches, as shown below.
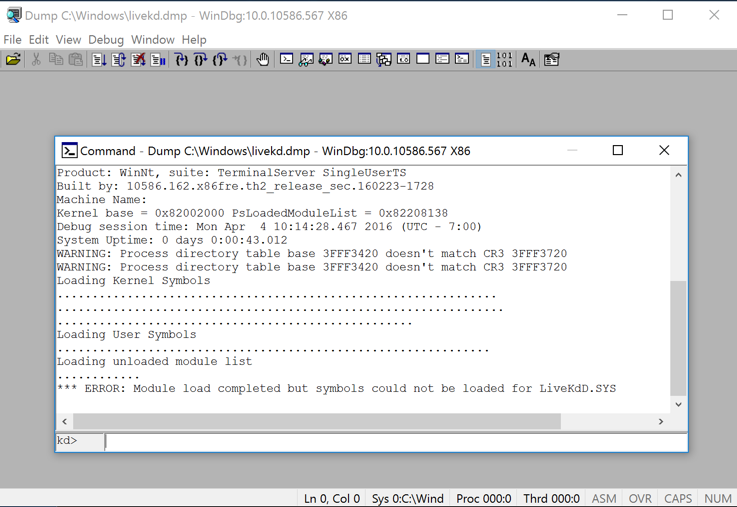
If you wish to change the font, click View, Font.
Make the "Command" window larger, as shown below.
This is a strange combination of a GUI and command-line, like the other debuggers we've used. Commands are typed into the box at the bottom and the results appear in the large top pane.
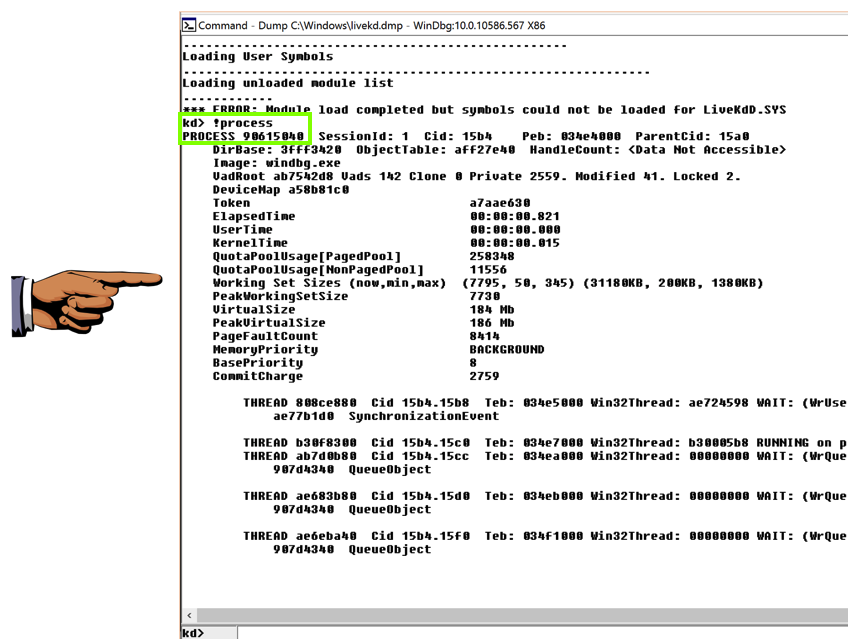
At the bottom of the Command window, in the command bar, execute this command:
!process
On your keyboard, press the PrntScrn key.
Open Paint and paste in the image.
YOU MUST SUBMIT WHOLE-DESKTOP IMAGES TO GET FULL CREDIT.
Save the image with a filename of "Proj 12 from YOUR NAME".
Getting Started with WinDbg (Kernel-Mode)
Windows 7 x64 Local and Live Kernel Debugging