For more background, see: Modbus Master-Slave Principle
Note: the terms "master" and "slave" were commonly used in the early days of computing, but they are now discouraged because they are offensive. Modbus is a very old protocol and still uses those old terms.
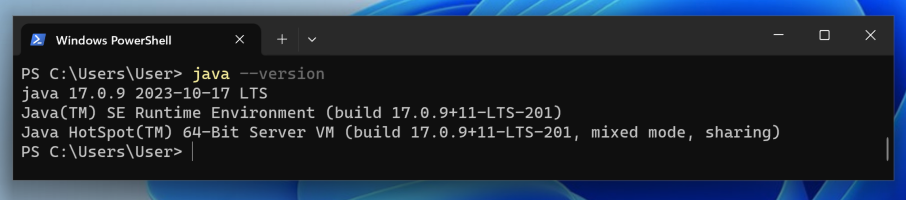
java --version
https://www.oracle.com/java/technologies/downloads/
https://modbuspal.sourceforge.net/Click the "Download v1.6b" button.
Click the "Download Latest Version" button.
Save the ModbusPal.jar file in your Downloads folder.
Alternate Download Link
If you can't get ModbusPal.jar from there, download it here.
java -jar Downloads\ModbusPal.jar
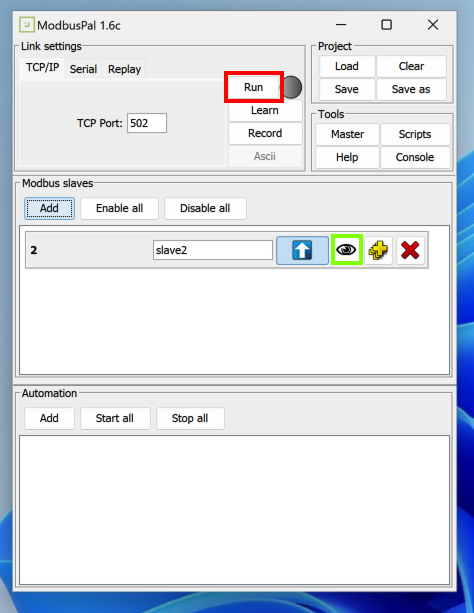
In the "New slave" box, in the "Add Slave" field, enter a Slave ID of 2
In the "Slave name" field, enter slave2 as shown below.
In the "New slave" box, click the Add button.
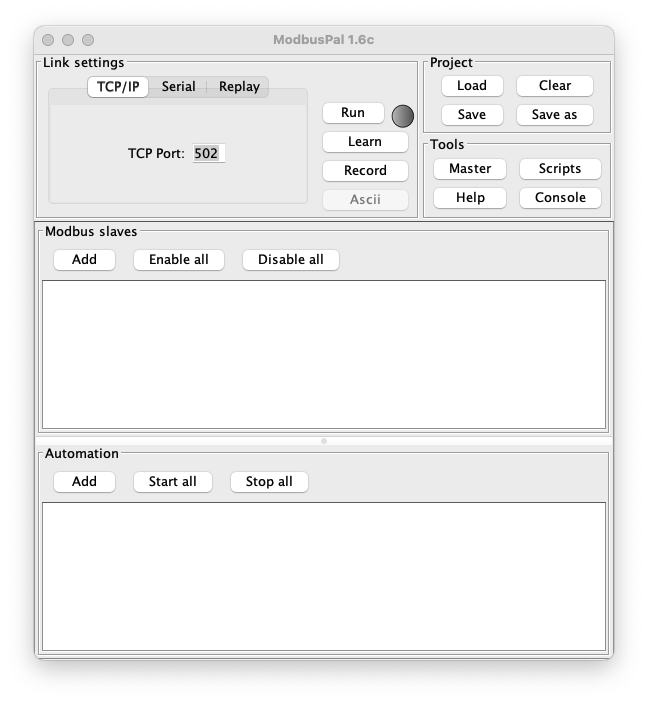
This starts the slave running, listening on port 502 for signals from the master.
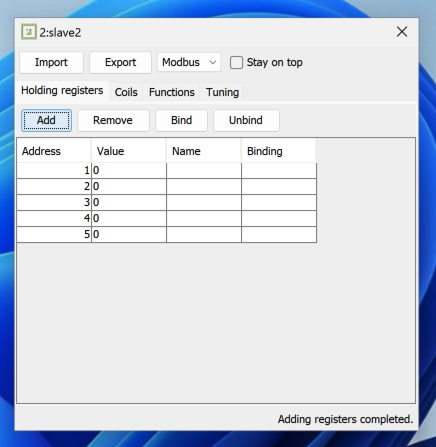
A box opens titled "2slave2".
Here we can add data items to our slave.
In Modbus, there are only two types of data:
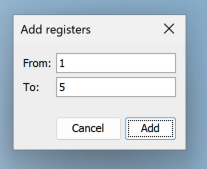
In the "Add registers" box, change the "To" field to 5, as shown below.
In the "Add registers" box, click the Add button.
The "2slave2" box now shows five Holding registers, all with values of zero, as shown below.
In the "2slave2" box, click the Coils tab.
Click the Add button.
In the "Add coils" box, change the "To" field to 5 and click the Add button.
The "2slave2" box now shows five Coils, all with values of zero, as shown below.
In a Web browser, go to
https://sourceforge.net/projects/qmodmaster/Download the Windows pre-compiled binary.
Open your Downloads folder.
Alternate Download Link
If you can't get qModMaster from there, download it here.
Right-click the https://sourceforge.net/projects/qmodmaster/ file and click "Extract All...", Extract. Click Extract
Double-click the qModMaster folder to open it.
Double-click the qModMaster.exe file.
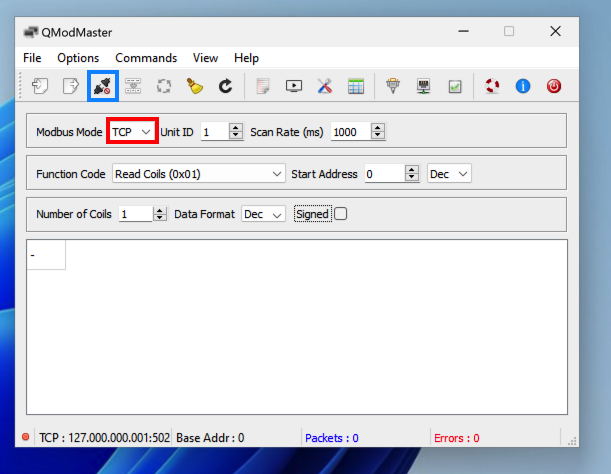
qModMaster opens, as shown below.
The default is the loopback address, which is correct, as shown below.
Click the OK button.
In the qModMaster window, set the Modbus Mode to TCP, outlined in red in the image below.
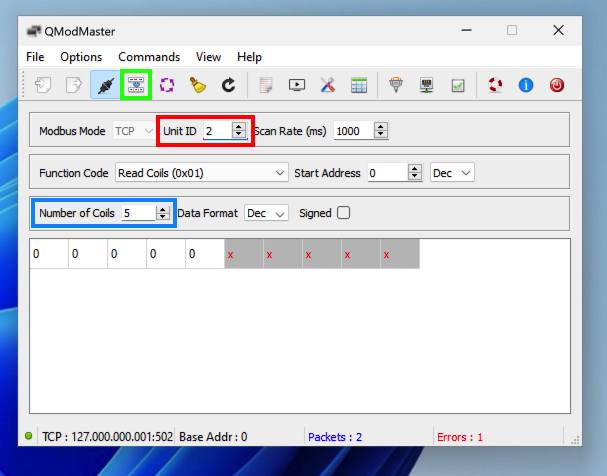
In the qModMaster window, click the Connect button, outlined in blue in the image above.
The data fills in in the lower pane, showing five zeroes.
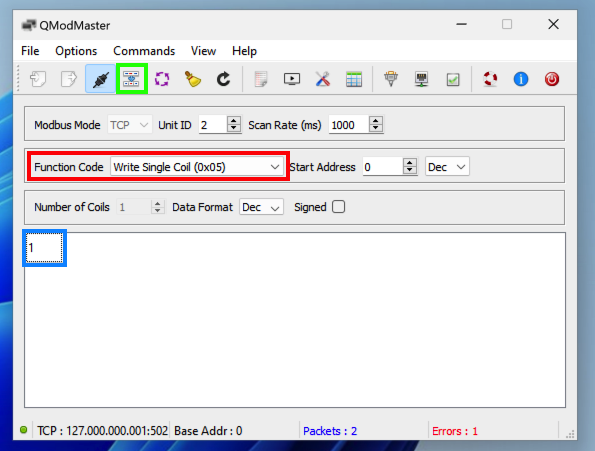
The first coil is now set to 1, as shown below.
https://www.wireshark.org/Download the Windows x64 installer, and install it with the default options.
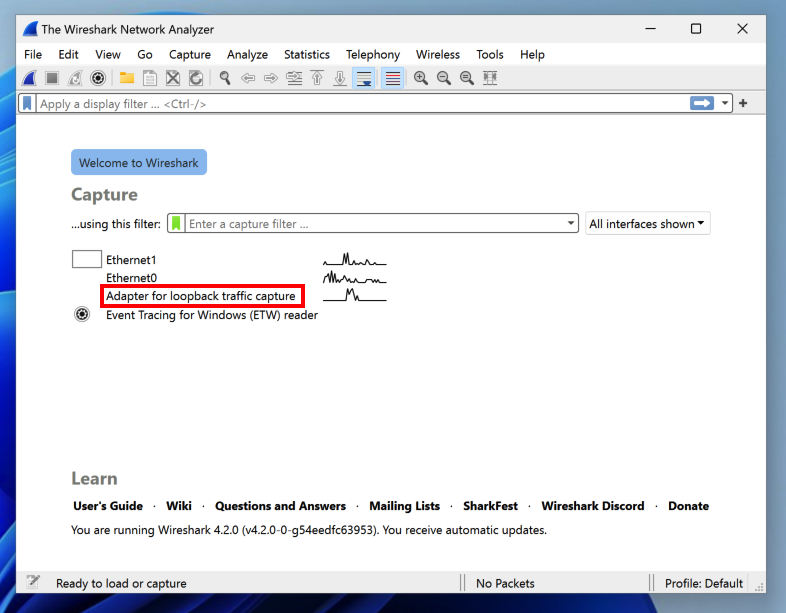
Launch Wireshark.
Double-click "Adapter for loopback traffic capture", outlined in red in the image below.
Flag OT 100.1: Read Request (10 pts)
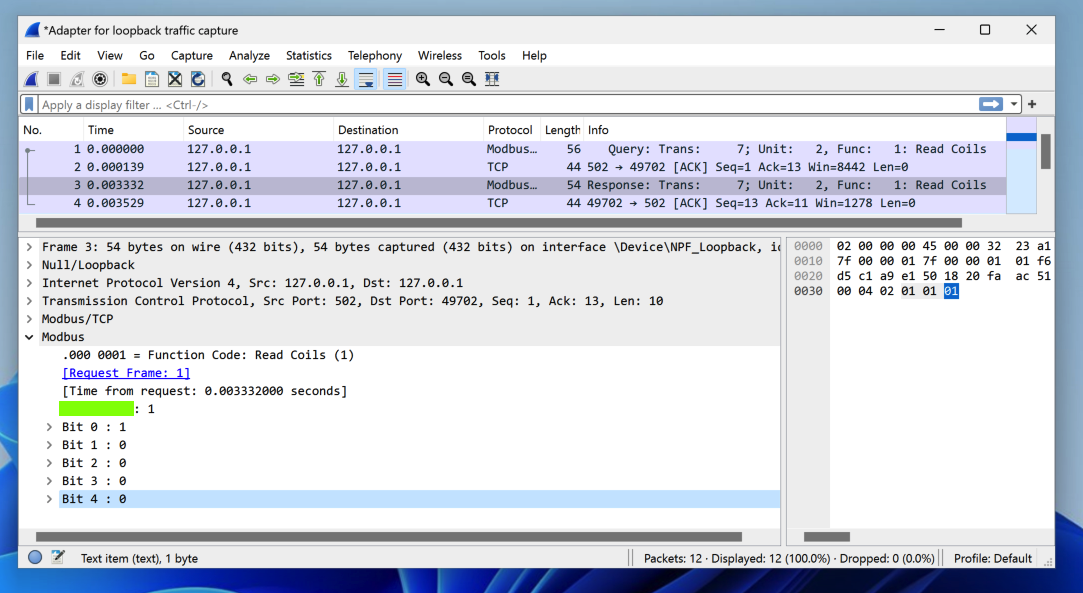
In QModMaster, read the five coils from the slave again.Wireshark shows four packets, as shown below: a Query, an Acknowledgement (ACK), a Response, and another Acknowledgement.
In the top pane, click the Response packet.
In the Details pane, expand the Modbus container.
The flag is covered by a green rectangle in the image below.
From the Windows desktop, search for Virus. Click "Virus & threat protection".
In the Windows Security box, in the "Virus & threat protection settings" section, click "Manage settings".
Scroll to the bottom and click "Add or remove exclusions".
In the User Account Control box, click Yes.
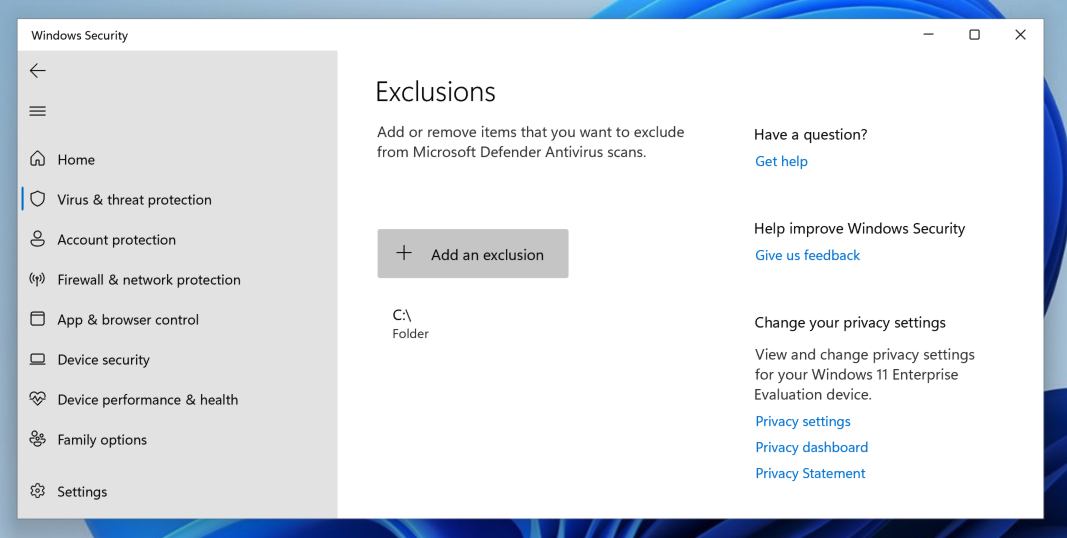
Click the "Add an exclusion" button. Click Folder. Navigate to the C:\ drive anbd click it. Click the "Select Folder" button.
The C:\ drive should now appear in the list of Exclusions, as shown below.
https://getfirefox.com/In Firefox, go to
https://www.metasploit.com/On the right side, in the "Get Metasploit" box, in the "OPEN SOURCE" section, click the Download button, as shown below.
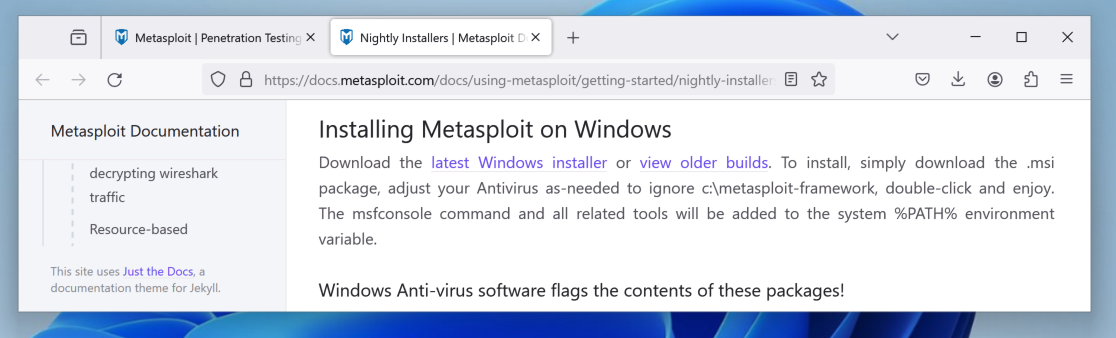
On the next page, scroll down to the "Installing Metasploit on Windows" section, as shown below.
Click "view older builds".
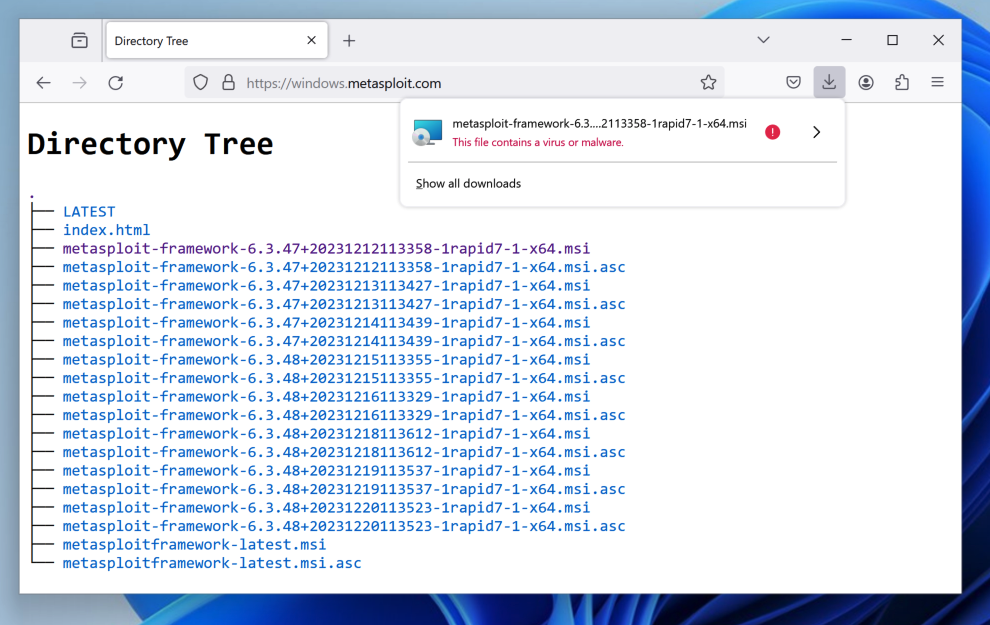
Download metasploit-framework-6.3.47+20231212113358-1rapid7-1-x64.msi, as shown below.
(More recent versions will probably work also, but using the exact version I used is the easiest way to do the project.)
Firefox warns you that this file contains malware, as shown above.
In the little Downloads box, click the right-arrow. Click the "Allow download" button.
Open an Administrator Terminal window and execute these commands:
cd Downloads
.\metasploit-framework-6.3.47+20231212113358-1rapid7-1-x64.msi
msfconsole
search modbus
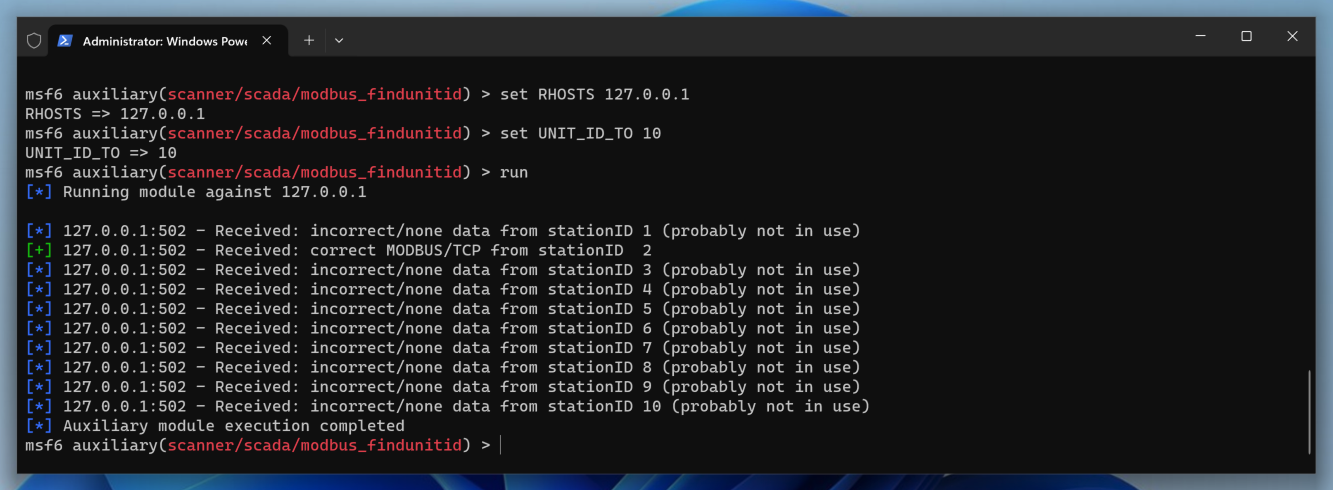
use auxiliary/scanner/scada/modbus_findunitid
show options
The only options we need to specify are RHOSTS (to tell it where the Modbus network is) and UNIT_ID_TO (to make the scan end more quickly).
At the msf> prompt, execute these commands:
set RHOSTS 127.0.0.1
set UNIT_ID_TO 10
run
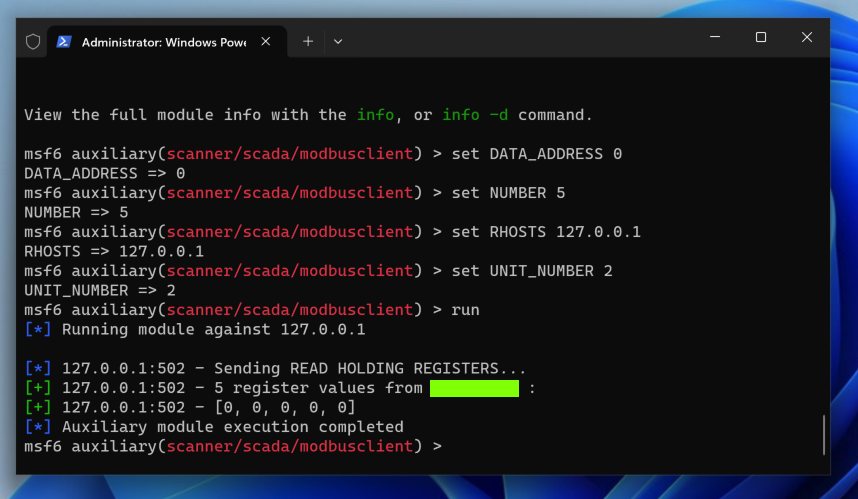
Flag OT 100.2: Reading Data from the Slave (10 pts)
At the msf6 > prompt, execute these commands:The flag is covered by a green rectangle in the image below.
https://nmap.org/Download and install the latest stable release self-installer.
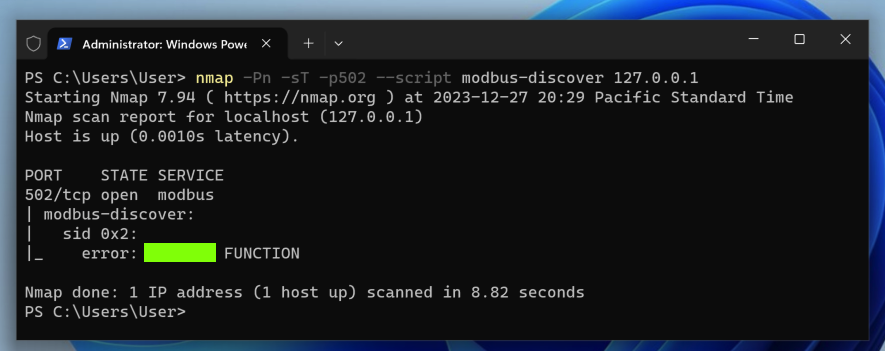
Flag OT 100.3: Scanning for Modbus Slaves with Nmap (10 pts)
Open a new Administrator Terminal window, execute this command:Nmap finds the first active sid.The flag is covered by a green rectangle in the image below.
modbus.pcapng
Flag OT 100.4: Unit Identifier (5 pts)
What is the numerical unit identifier for the slave? Express your answer as a decimal number.
Flag OT 100.5: Holding Register (5 pts)
What is the largest value stored in a holding register before any write operations? Express your answer as a decimal number.
Flag OT 100.6: Unit Identifier (10 pts)
What value is written to a holding register? Express your answer as a decimal number.Hint: Wireshark displayed this value in hexadecimal, not decimal, when I did it. Check the raw binary data to make sure.
During the installation, you will be prompted to select a username and password, as shown below.
Use these values:
Installing Splunk on Apple Silicon
If you are using a Windows virtual machine on a Mac M1 or later, launch the Splunk installer from an Administrator Command Prompt.It will pop up three Error boxes saying "Installation failed." Just click OK in them and let the installer complete anyway.
Unfortunately, there is still no Splunk version that runs natively on Apple Silicon. Splunk will run slowly because it's running through an ARM interpreter. Be patient.
Log in with the username and password you selected previously.

A box pops up saying "Helping You Get More Value...". Click "Got It!".
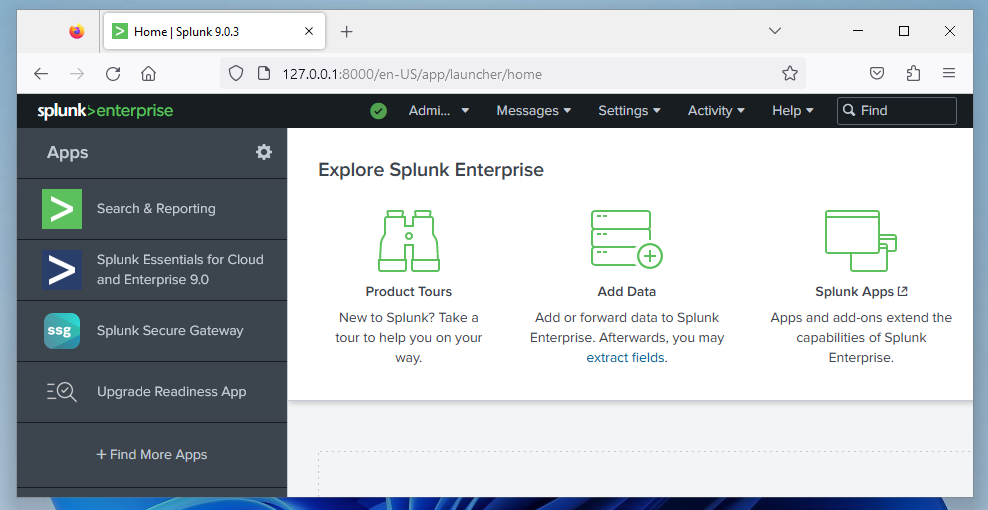
The main Splunk Web page appears, as shown below.
In Splunk Web, at the top left, click splunk.
At the top left, next to "Apps", click the gear icon.
At the top right, click the "Install app from file" button.
Upload the splunk-app-for-stream_811.tgz file.
At the top right, click the "Install app from file" button.
Upload the splunk-add-on-for-stream-wire-data_811.tgz file.
At the top right, click the "Install app from file" button.
Upload the splunk-add-on-for-stream-forwarders_811.tgz file.
Restart Splunk Enterprise if you are prompted to. It takes a few minutes to restart.
On the left, click "Splunk Stream".
A "Setup Stream" page opens, as shown below.
Click the green "Let's get started" button.

At the top left, click "Search & Reporting".
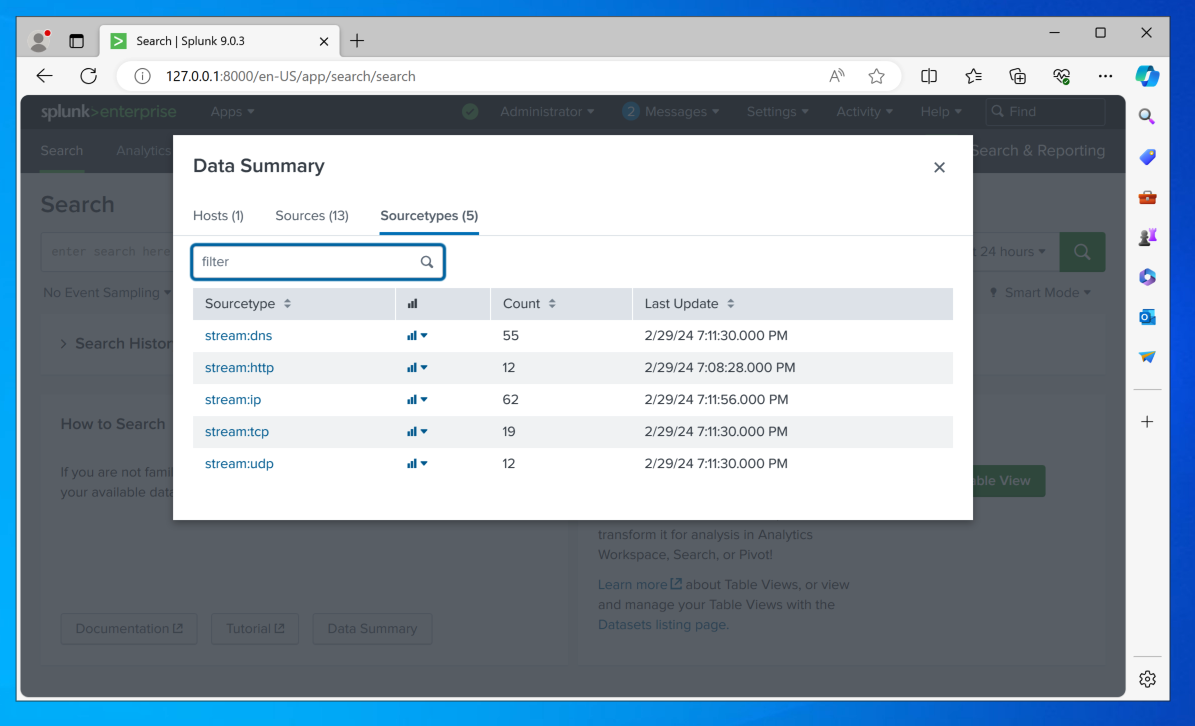
In the lower center, click the gray "Data Summary" button.
Click the Sourcetypes tab to see that Splunk Stream is monitoring five important protocols, as shown below.
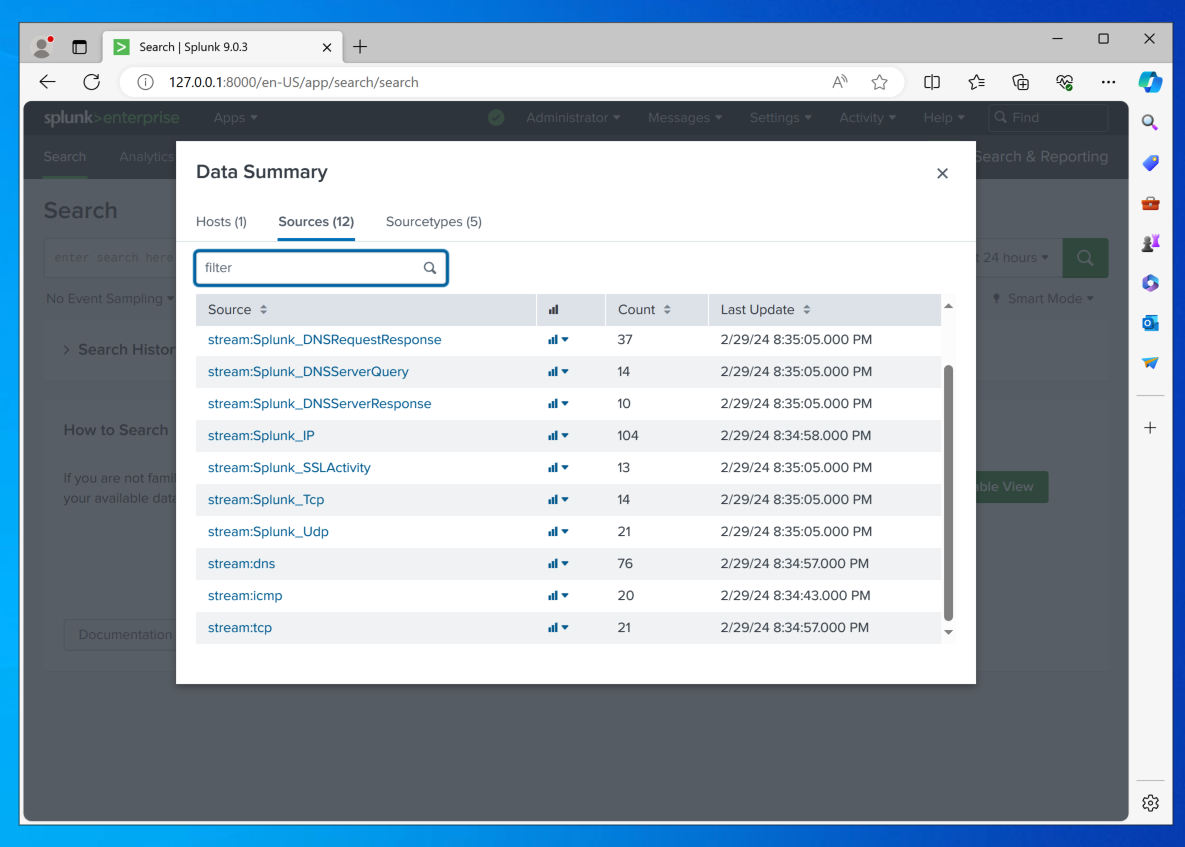
However, it's not monitoring all traffic on those protocols. To see what it's actually doing, click the Sources tab.
All the traffic being monitored is internal traffic created by Splunk itself, as shown below.
Close the Data Summary box.

On the left, click "Splunk Stream".
In the top center, click Configuration, "Configure Streams", as shown below.
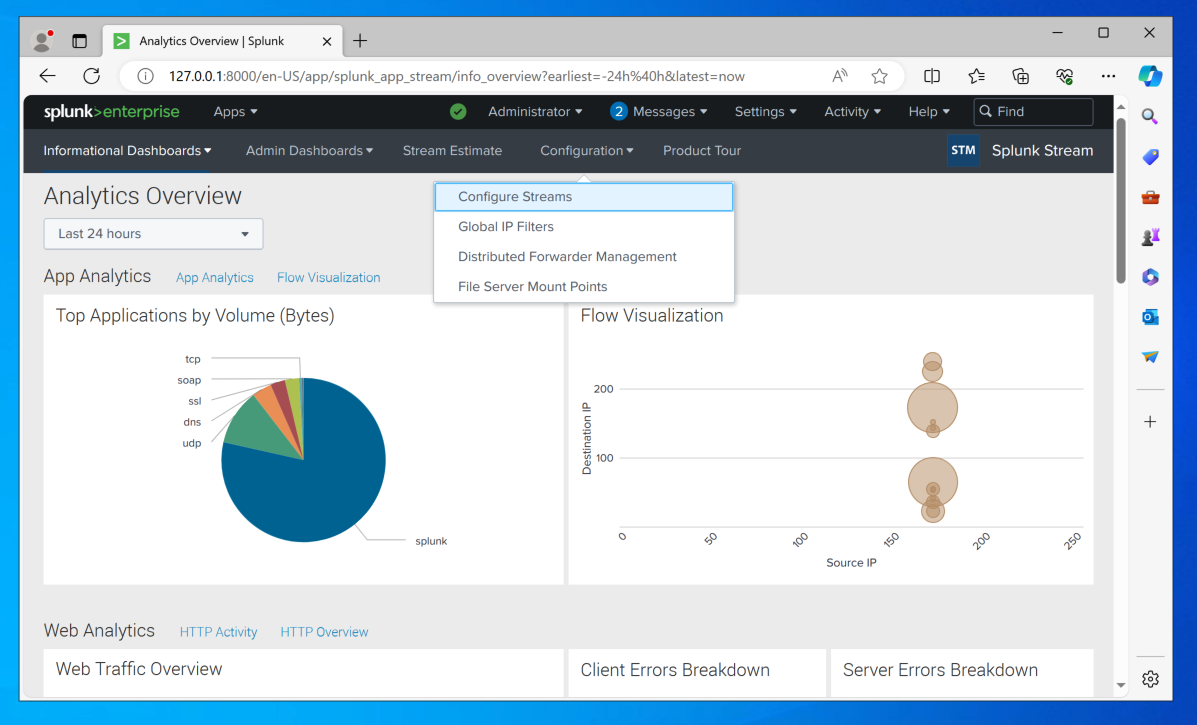
You see a list of protocols, with graphs of traffic on the right side, as shown below.
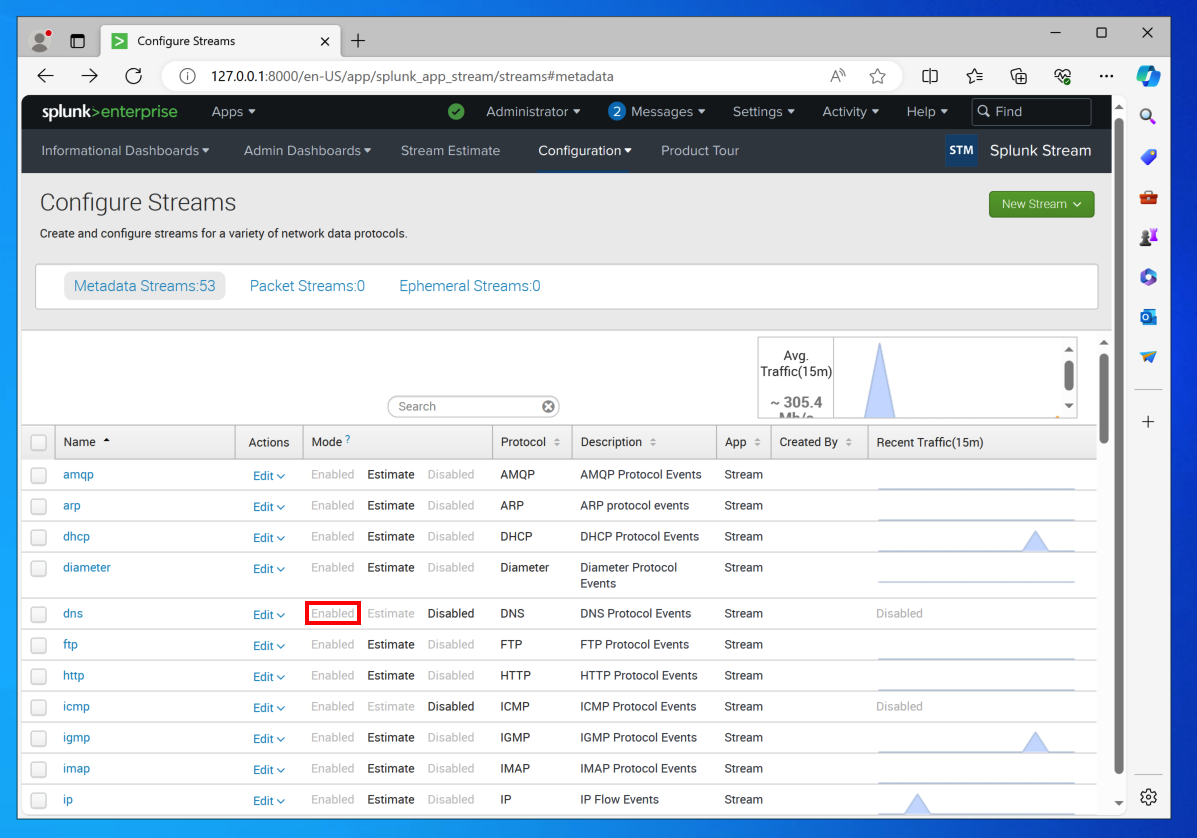
In the "dns" line, click the grayed-out word Enabled, outlined in red in the image above.
In the Please Confirm box, click Yes.
Repeat this process to enable these protocols:
ping kittenwar.com
At the top left, click "Search & Reporting".
In the lower center, click the gray "Data Summary" button.
Click the Sources tab.
Scroll to the bottom.
Now you can see some protocols being monitored for non-Splunk traffic, including stream:icmp, as shown below.
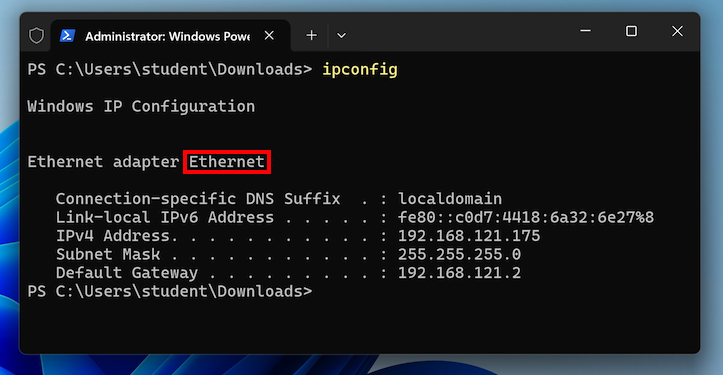
ipconfig
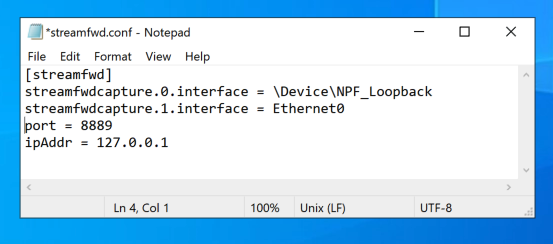
To fix that, navigate to the streamfwd.conf file, as shown below. Right-click it and open it in Notepad.
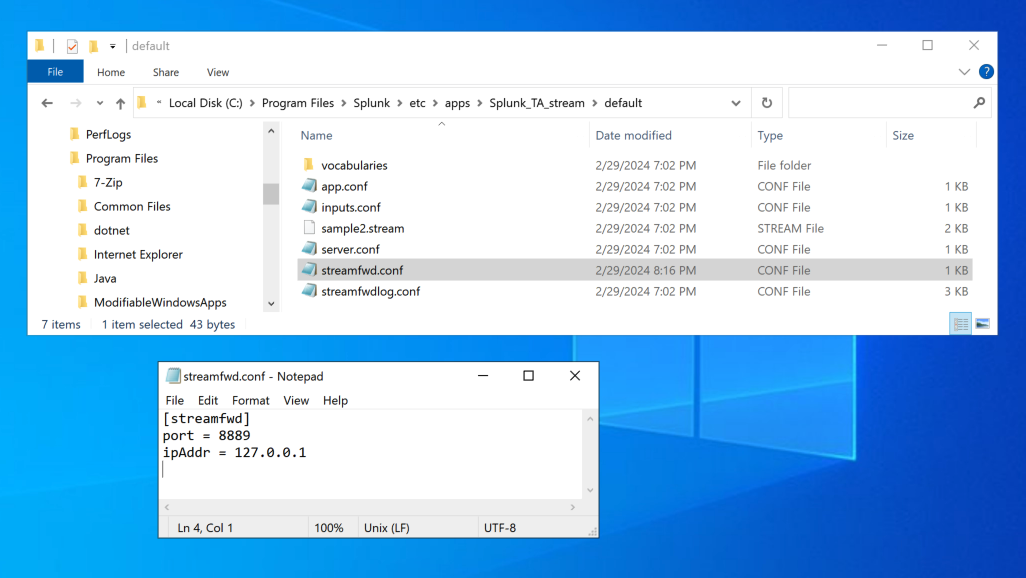
After the first line, insert these two lines, as shown below.
In the second line, use the correct name for your Ethernet interface, which may be different.
streamfwdcapture.0.interface = \Device\NPF_Loopback
streamfwdcapture.1.interface = Ethernet
In Notepad, click File, Save.
Close Notepad.
Click the green "Restart Splunk" button.
Click OK.
Wait for Splunk to restart.
Log in again.
At the top left, click "Search & Reporting".
In the lower center, click the gray "Data Summary" button.
Click the Sourcetypes tab.
You should see one or more "stream:modbus" events, as shown below.
If you don't, try executing the Read operation in qModMaster again and waiting a few seconds. It took me three tries to capture an event. Also try reading a different number of Coils, like 4.
Restarting Splunk again may also help.

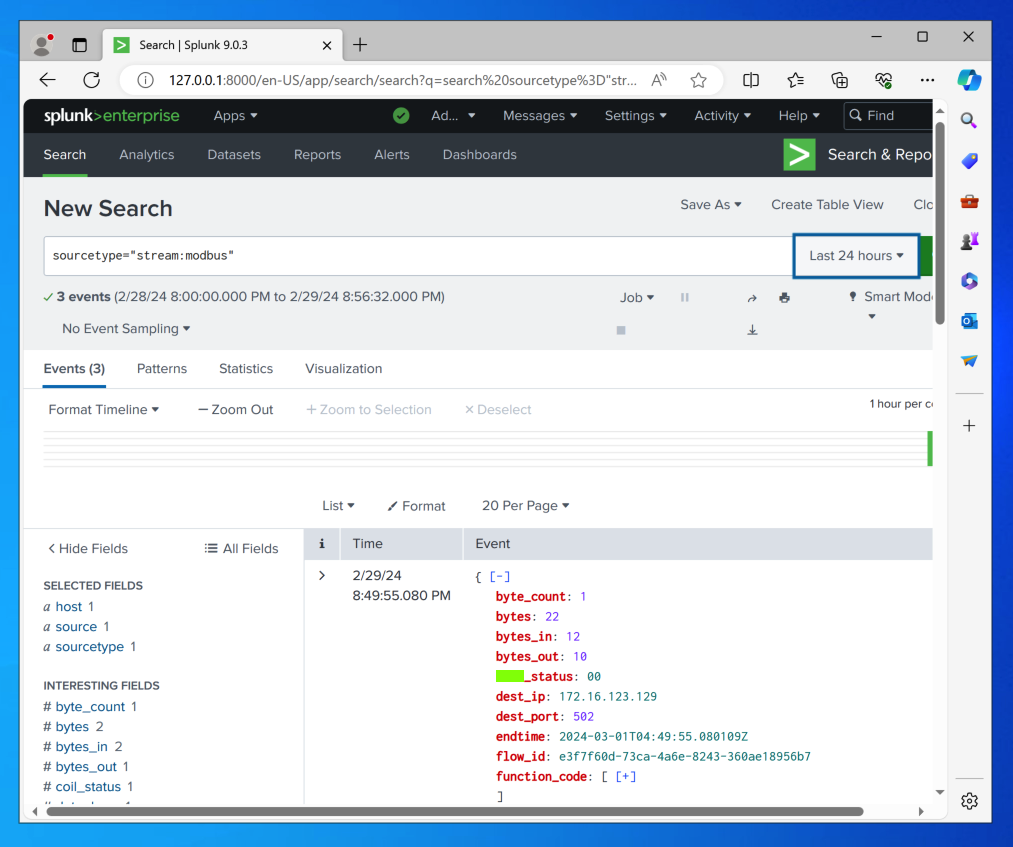
Flag OT 100.7: Modbus Event (20 pts)
In Splunk, in the "Search & Reporting" dashboard, execute this search:Examine an event. The flag is covered by a green rectangle in the image below.
msfconsole
search modbus
use auxiliary/scanner/scada/modbus_findunitid
show options
set RHOSTS 127.0.0.1
set UNIT_ID_TO 10
run
Flag OT 100.8: Modbus Event (10 pts)
In Splunk, in the "Search & Reporting" dashboard, execute this search:Examine the most recent event. The flag is covered by a green rectangle in the image below.
Note: when I woke my virtual Windows machine from a suspended state, Splunk stopped collecting Stream data. I had to disable and re-enable MODBUS in the Splunk Stream Configuration.
Flag 7 added 2-29-24
Flag 8 added 3-2-24
Splunk on Apple Silicon tip added 12-10-24
Minor updates 4-25-25