Modules 3 and 4 (20 pts)
What you need:
- A Windows, Linux, or Mac computer
Intalling Splunk
Download the appropriate installer for your operating system:
Install the software as usual.
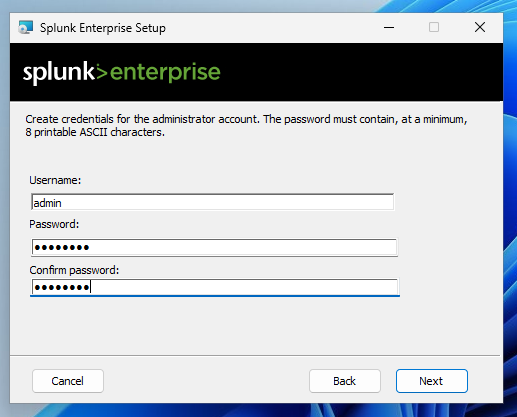
During the installation, you will be prompted to
select a username and password, as shown below.
Use these values:
- Username: admin
- Password: P@ssw0rd
Mac M1
If you are using a Mac M1 or later,
download the Mac version of Splunk and install it
directly on your Mac.
|
Headless Linux Server
If you are using a headless Debian 12 Linux server on an Intel processor,
execute the commands below to install Splunk.
wget https://samsclass.info/50/proj/splunk-9.0.3-dd0128b1f8cd-linux-2.6-amd64.deb
sudo apt install ./splunk-*-amd64.deb
sudo /opt/splunk/bin/splunk enable boot-start
Press the SPACEBAR many times to scroll through the license.
When you see "END", press q.
Enter y to accept the license.
Enter a username and password of your choice.
Execute this command to start Splunk:
sudo /opt/splunk/bin/splunk start
You see a message saying Splunk is listening on port 8000,
as shown below.
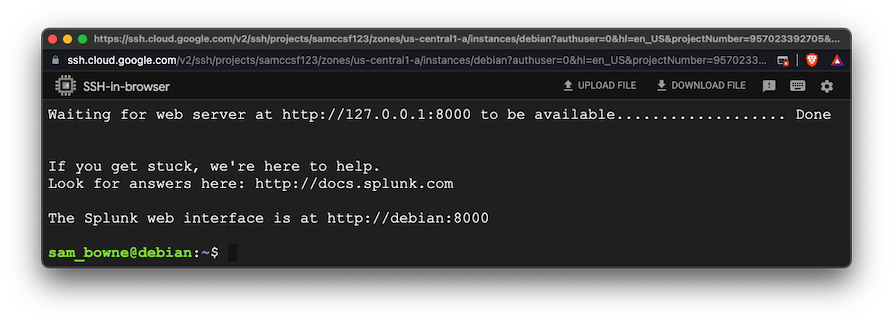
Open a Web browser and enter the IP of your Debian server
followed by ":8000" to see the Splunk Web page,
as shown below.
(If you are using a cloud server, you'll need to open port 8000
in the cloud firewall, which is pretty tricky to do.)
|
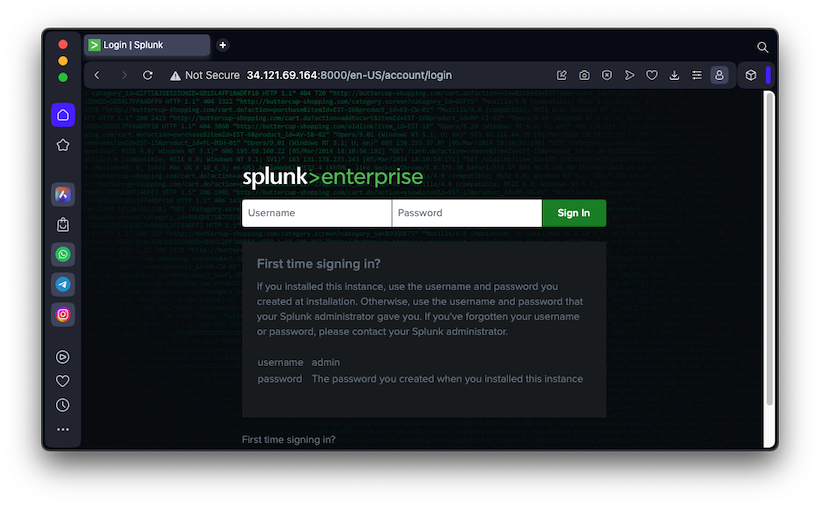
Log into Splunk Web
When the installation finishes, a Web browser will
open, showing the "Splunk Web" page,
as shown below.
Log in with the username and password you selected
previously.

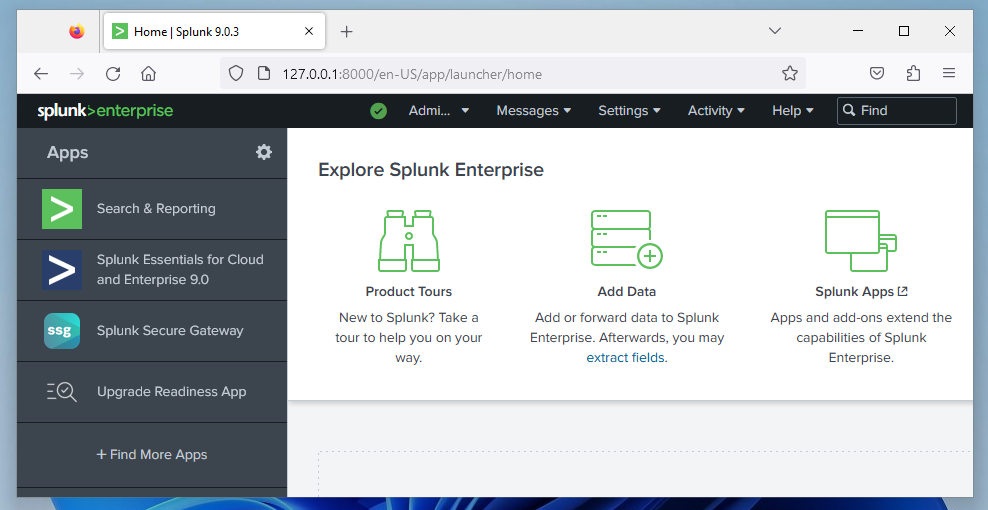
A box pops up saying "Helping You Get More Value...". Click
"Got It!".
The main Splunk Web page appears,
as shown below.
Creating a User with the Power Role
At the top right of Splunk Web, click
Settings.
In the "USERS AND AUTHENTICATION" section,
click Users.
At the top right, click the green
"New User" button.
Enter these values, as shown below:
- Name: uname
- Set password: 5p1unkbcup
- Confirm password: 5p1unkbcup
In the "Assign roles" section,
on the right side,
click user to remove it.
On the left side, click power
to add it to the Selected item(s),
as shown below.
At the bottom right, click the green
Save button.

Downloading Data Files
Download this file:
Splunk_f1_Data.zip
Unzip the archive. Open the tmp folder to see
these three files:
- db_audit_30DAY.csv
- linux_s_30DAY.log
- access_30DAY.log
Ingesting web application data into Splunk Enterprise
In Splunk Web, at the top left, click the Splunk Enterprise logo.
In the upper center of the page, click "Add Data".
If a box pops up offering a tour, click Skip.
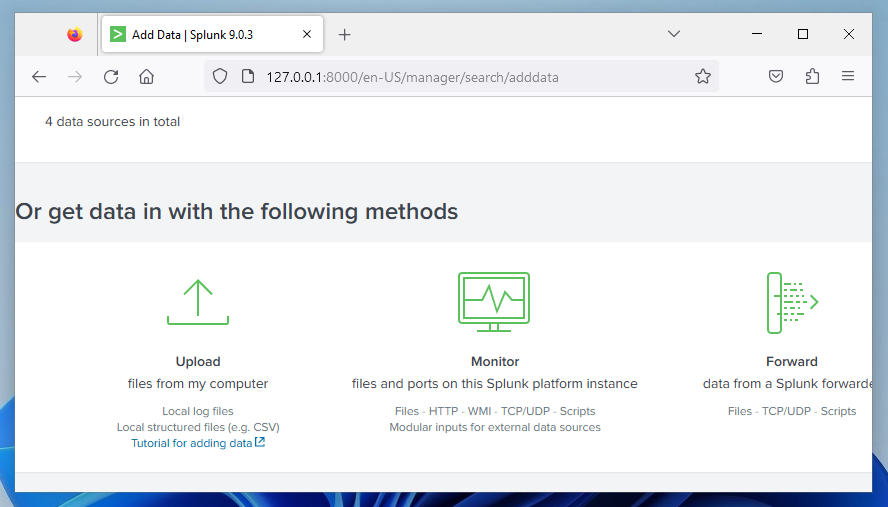
In the Add Data page,
at the bottom, click Upload,
as shown below.
You will be taken to the Select Source step. Click the "Select File" button and choose the
access_30Day.log file that you downloaded and unarchived earlier,
as shown below.

At the top right, click the green Next button.
On the Set Source Type step, you will see that Splunk automatically set the source type correctly as
access_combined_wcookie,
as shown below.
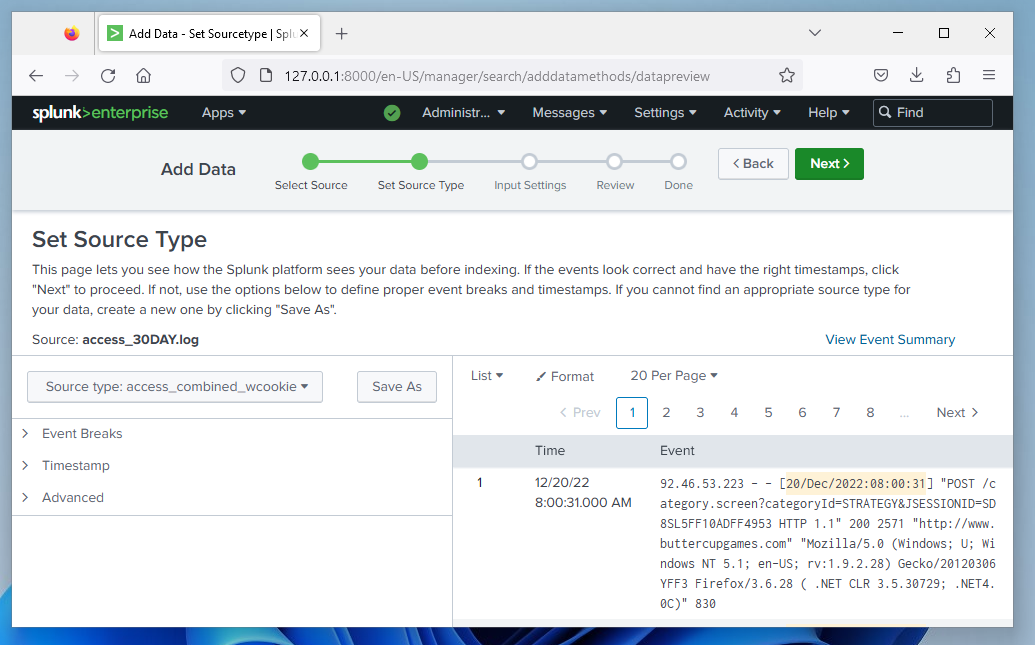
Click the Next button.
On the Input Settings step, enter web_application as the Host field value,
as shown below.
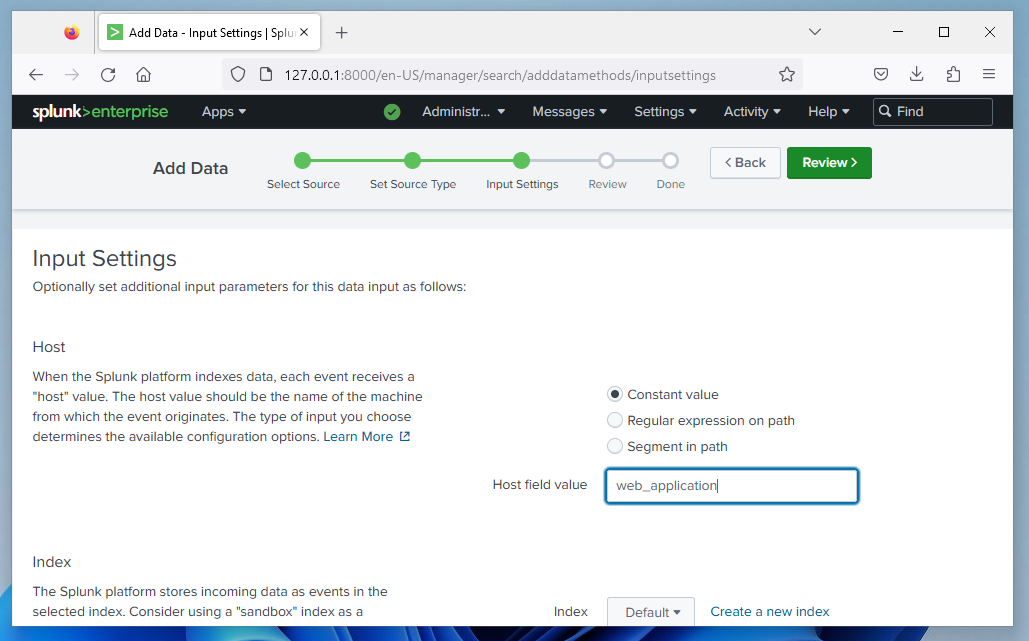
Click the Review button.
Click the Submit button.
Ingesting web server data into Splunk Enterprise
Click the "Add More Data" button.
Click the Upload icon and the "Select File" button.
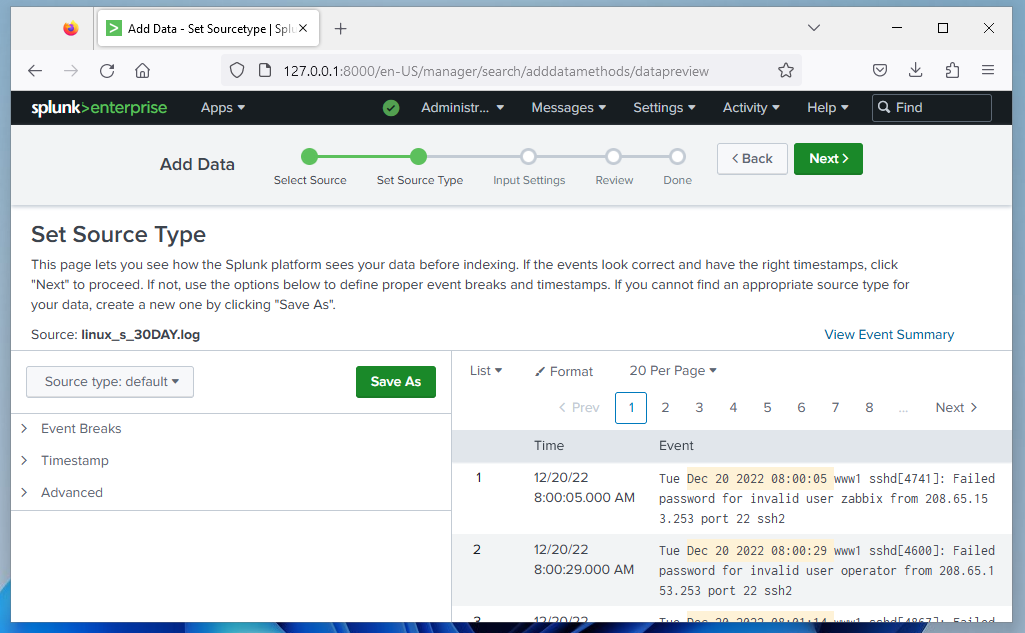
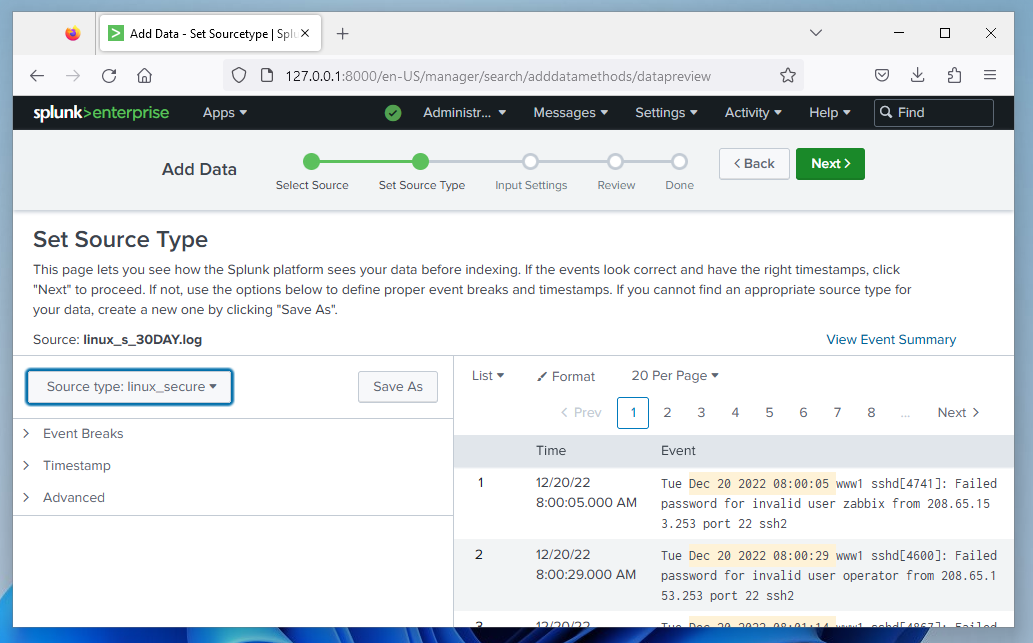
Select the linux_s_30Day.log file that you downloaded and unarchived earlier and click the Next button.
Notice that this time Splunk was not able to automatically select a source type for the data, so the Source type appears as "default",
as shown below.
Manually assign the source type by selecting the Source type button and selecting linux_secure from the
Operating System menu,
as shown below.
Click the Next button.
On the Input Settings step, enter web_server as the Host field value.
Click the Review button.
Click the Submit button.
Ingesting database server data into Splunk Enterprise
Click the "Add More Data" button.
Click the Upload icon and the "Select File" button.
Select the db_audit_30DAY.csv file that you downloaded and unarchived earlier and click the Next button.
Notice that Splunk automatically selected a source type of csv for the data.
We want to create a new
source type for this data,
, so click the "Save As" button.
In the "Save Source Type" box,
enter these values,
as shown below:
Name: db_audit
- Description: Postgres Audit Log
- Category: Database
- App: system
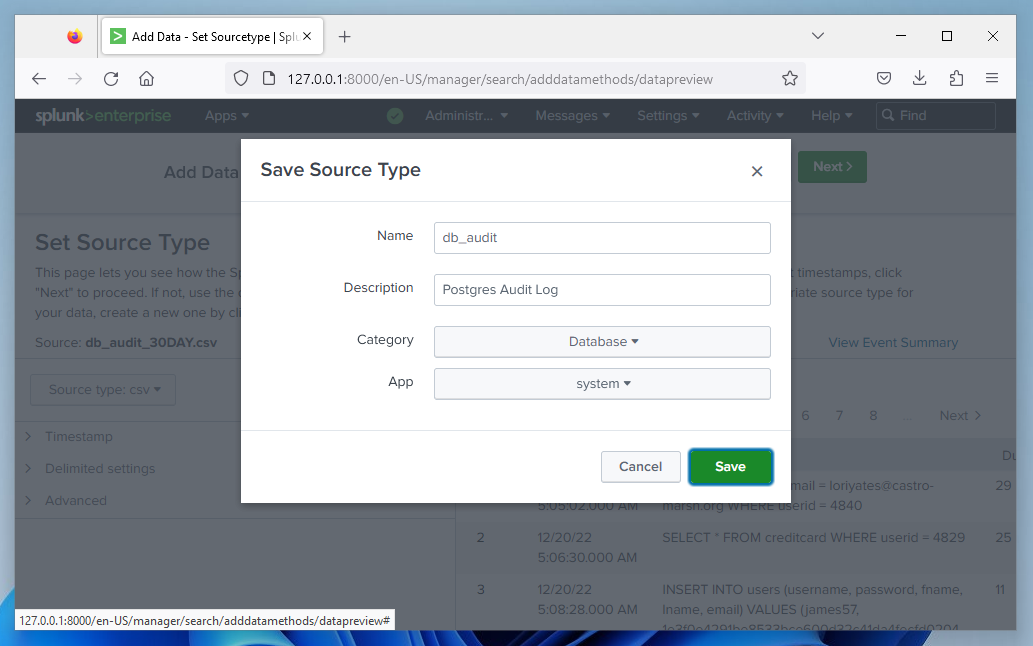
Click Save.
Click the Next button to continue to the Input Settings step.
Enter database as the Host field value.
Click the Review button.
Click the Submit button.
Viewing Data Summary
In Splunk Web, at the top left, click the Splunk Enterprise logo.
At the top left, click
"Search & Reporting".
If a box pops up offering you a tour,
click Skip.
In the lower center, click the
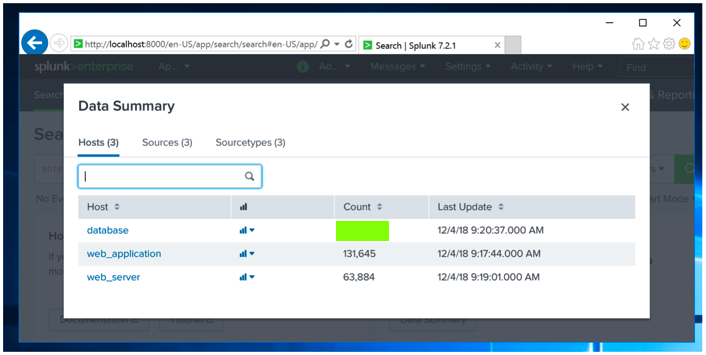
"Data Summary" button.
You should see three categories of imported events,
as shown below.
The flag is covered by a green rectangle in the image
below.
|
Saving a Screen Image
Capture a screen image, showing
the number of events for the "database" host,
covered by a green box in the image above.
Save the image with the filename "Mod 3-4".
Turning in your Project
Upload the image in Canvas, in the appropriate assignment.
Type the flag into the comment field.
Mac M1 note added 2-25-25