15. Use the Save As menu to select New Dashboard.16. In the "Save Panel to New Dashboard" box, enter these values:
- Dashboard Title: Sales Dashboard
- Click the Classic Dashboards button
- Panel Title: Product Sales
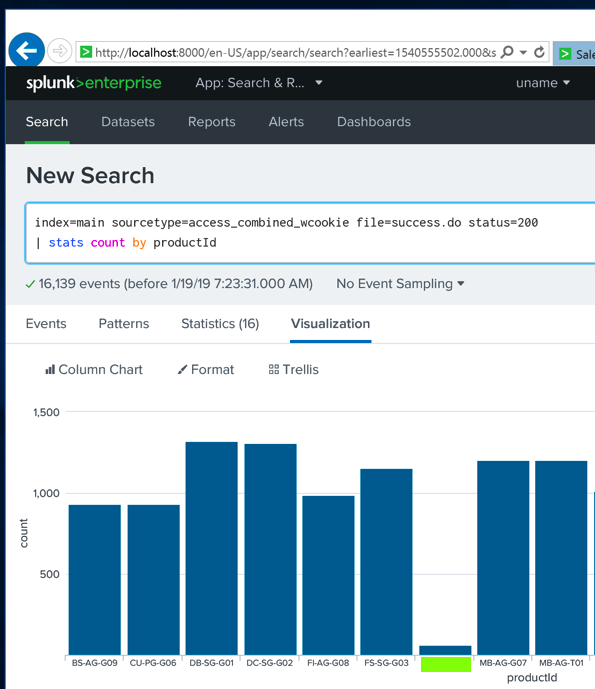
After step 17, you have a "Sales Dashboard" showing a column chart, as shown below.
Find the productID of the product with the smallest count of sales, covered by a green box in the image below. That's the flag.
Updated 2-10-23