If you don't have an account, click the head at the top right and create one.
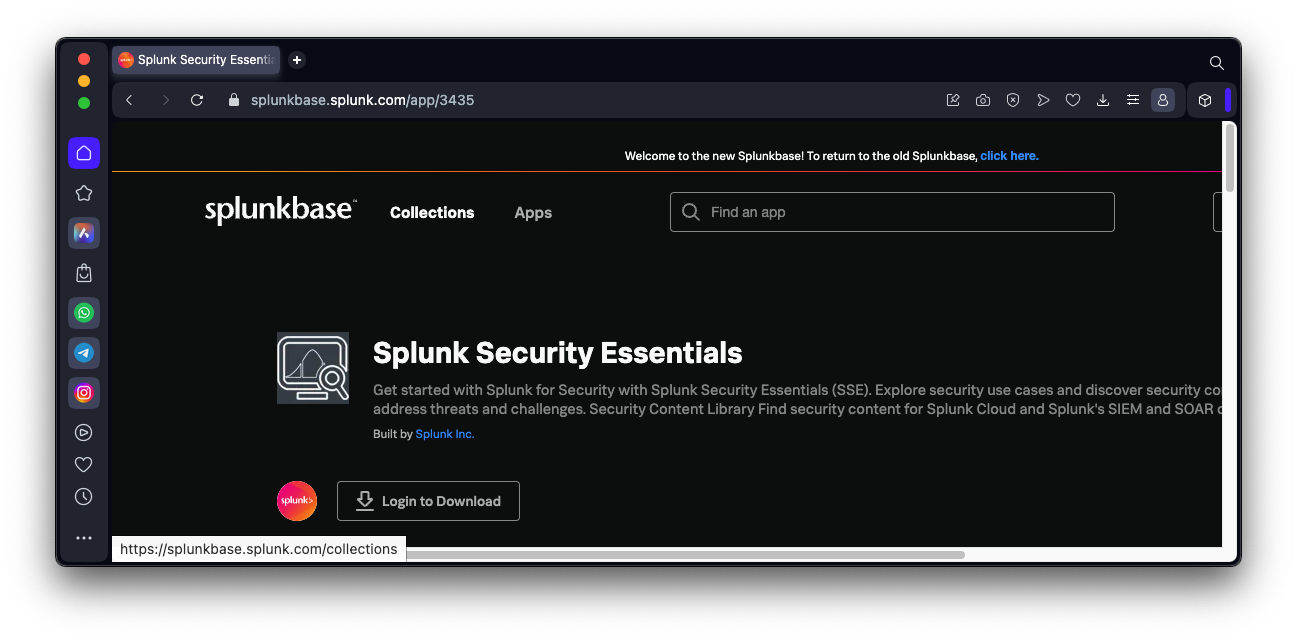
Search for "Splunk Security Essentials".
If you haven't already logged in with your Splunk account, click the "Login to download" button, as shown below, and log in.
Click the Download button. Accept the terms and click the "Agree to download" button.
A splunk-security-essentials_371.tgz file downloads.
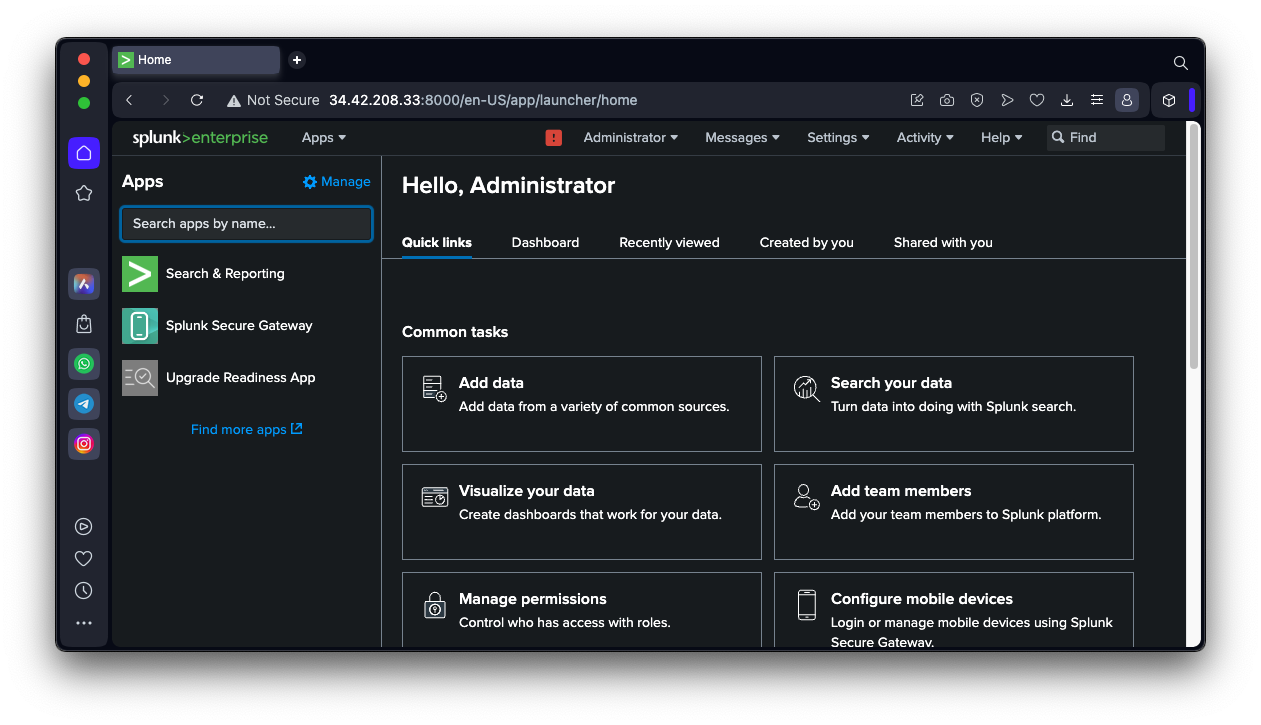
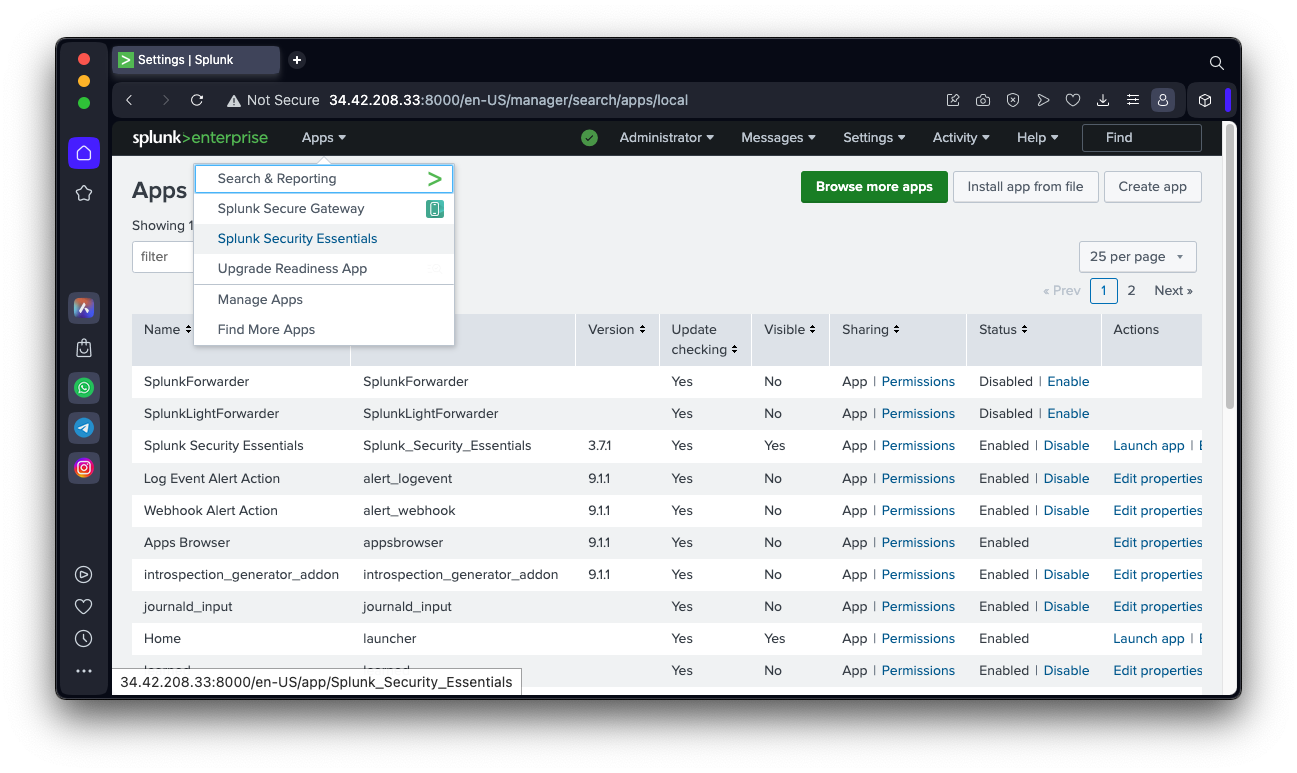
On the Apps page, at the top right, click the "Install app from file" button.
Click the "Choose File" button. Navigate to the splunk-security-essentials_371.tgz file you downloaded and double-click it.
Click the Upload button.
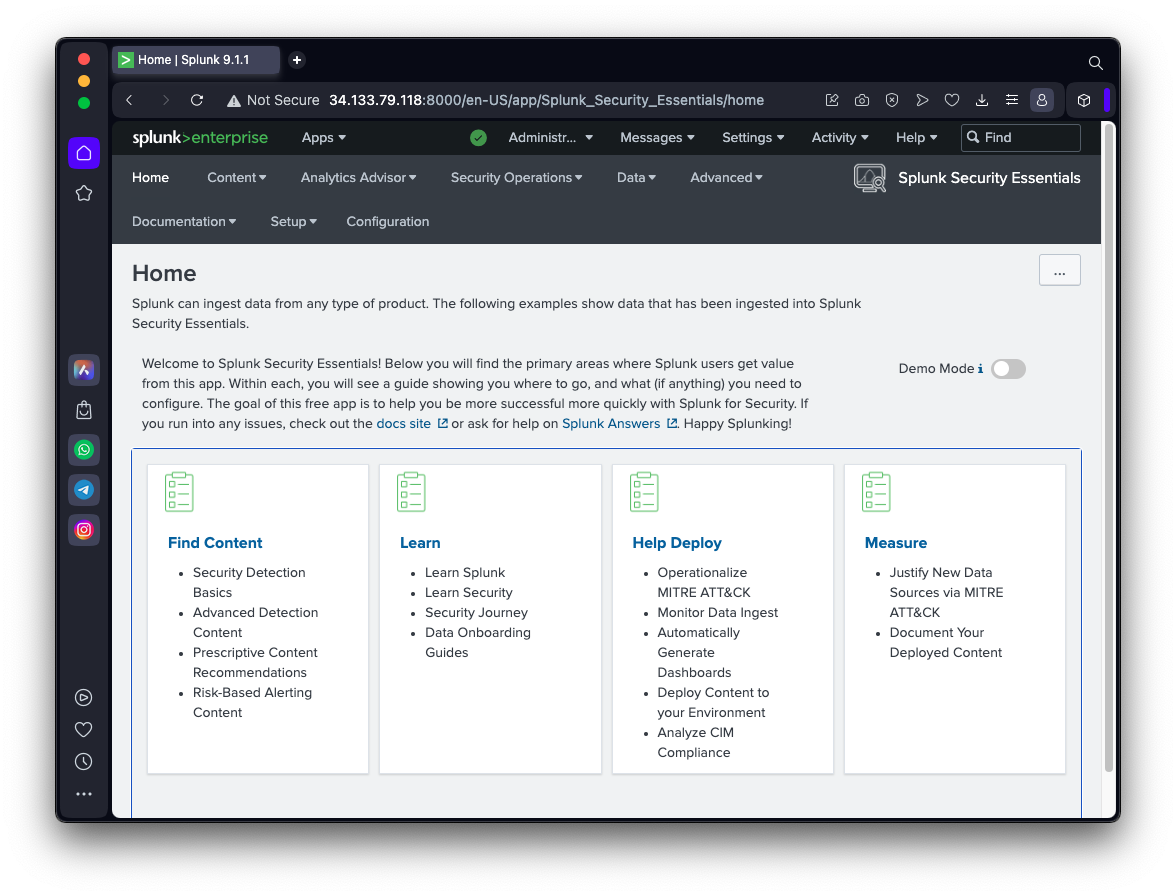
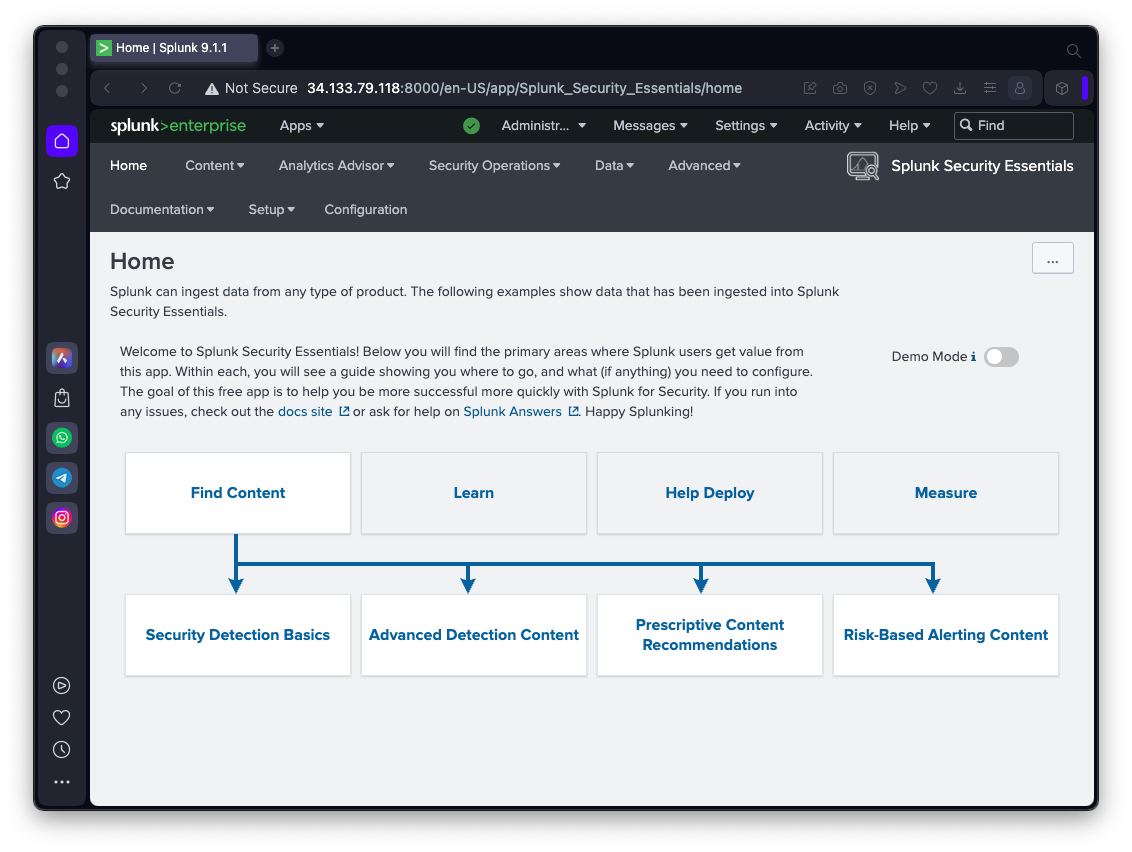
You see the "Splunk Security Essentials" home page, as shown below.
A line chart opens, as shown below.
Click "Security Detection Basics".
Scroll down to find the "Security Monitoring" box, as shown below.
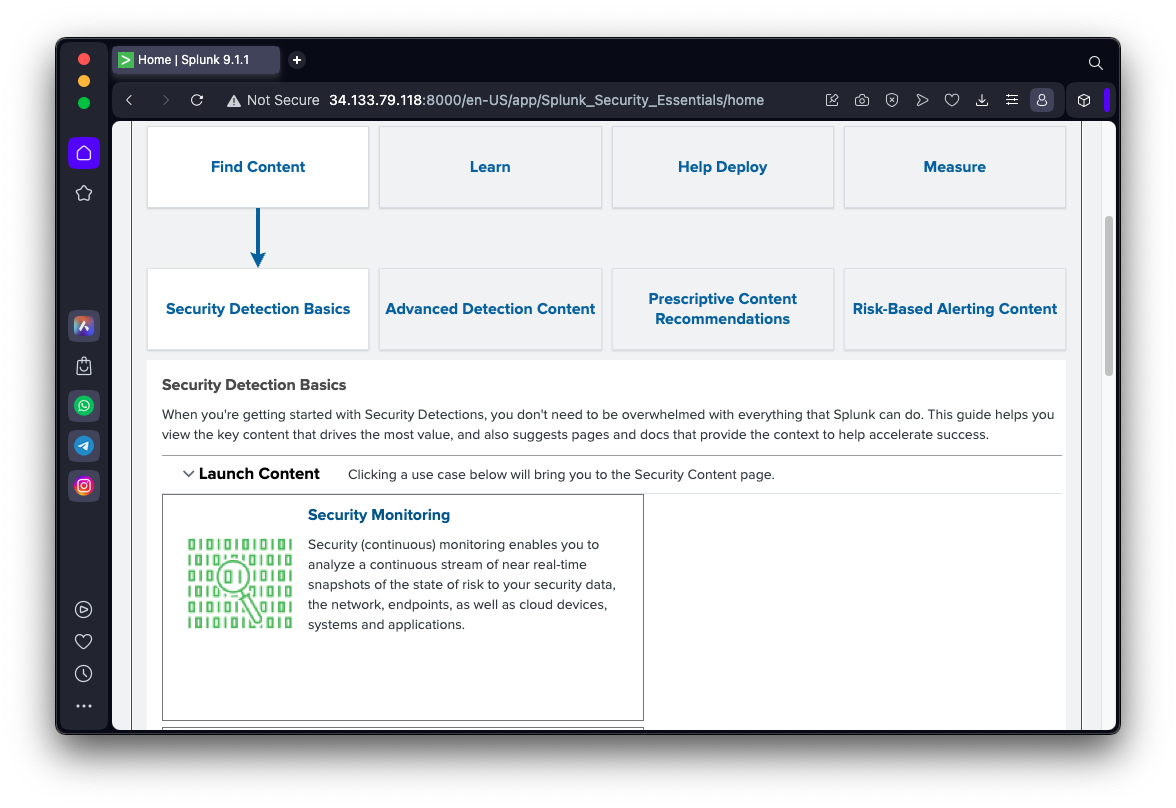
Click "Security Monitoring".
You see several examples of Collection, as shown below.
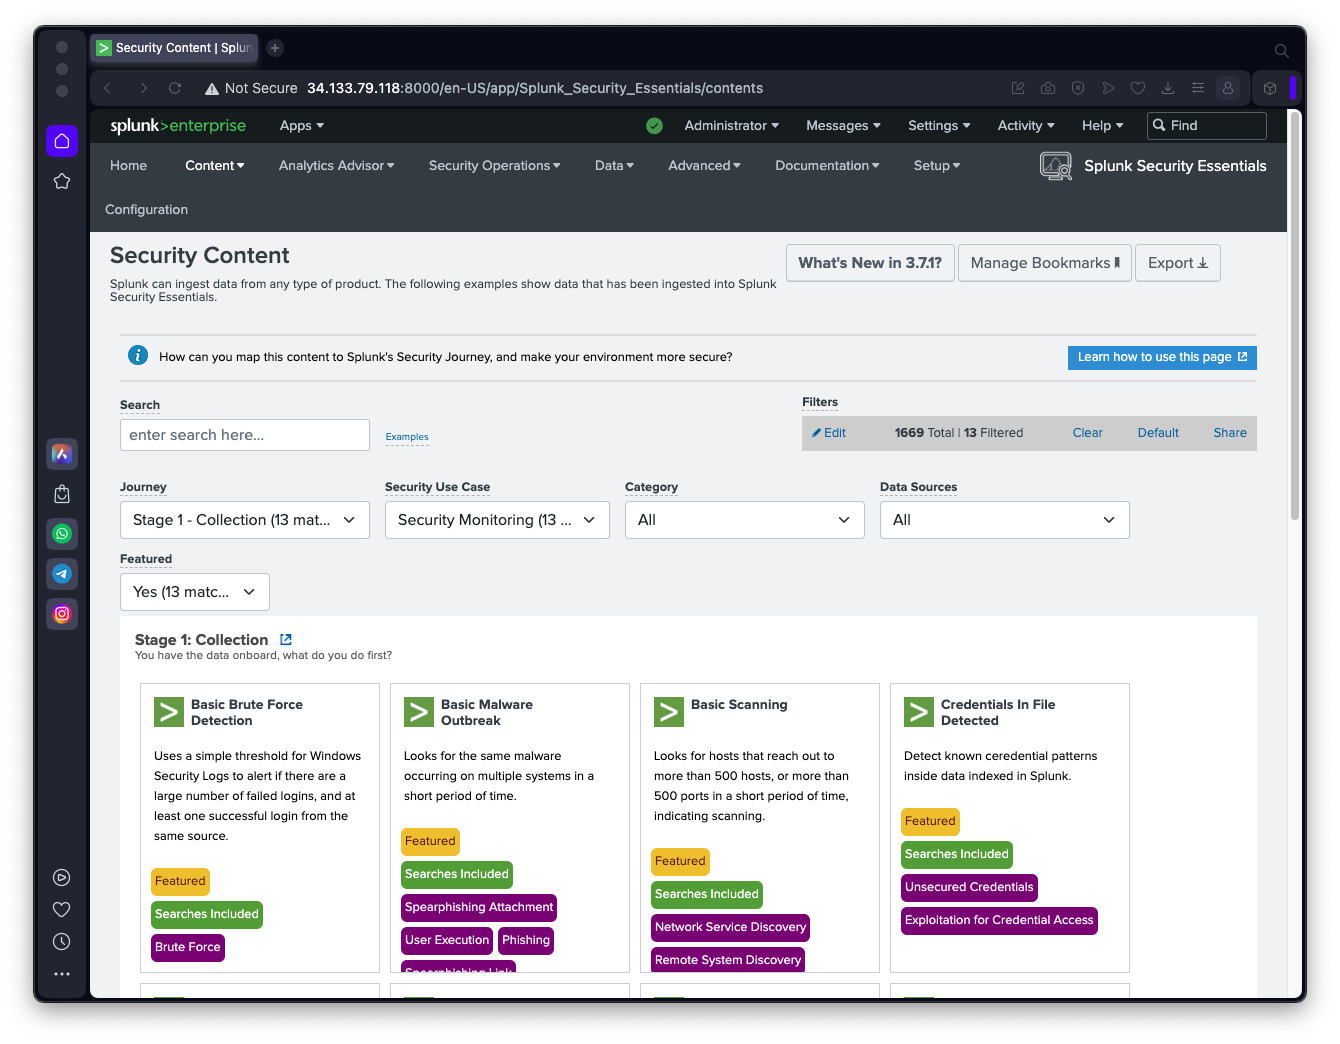
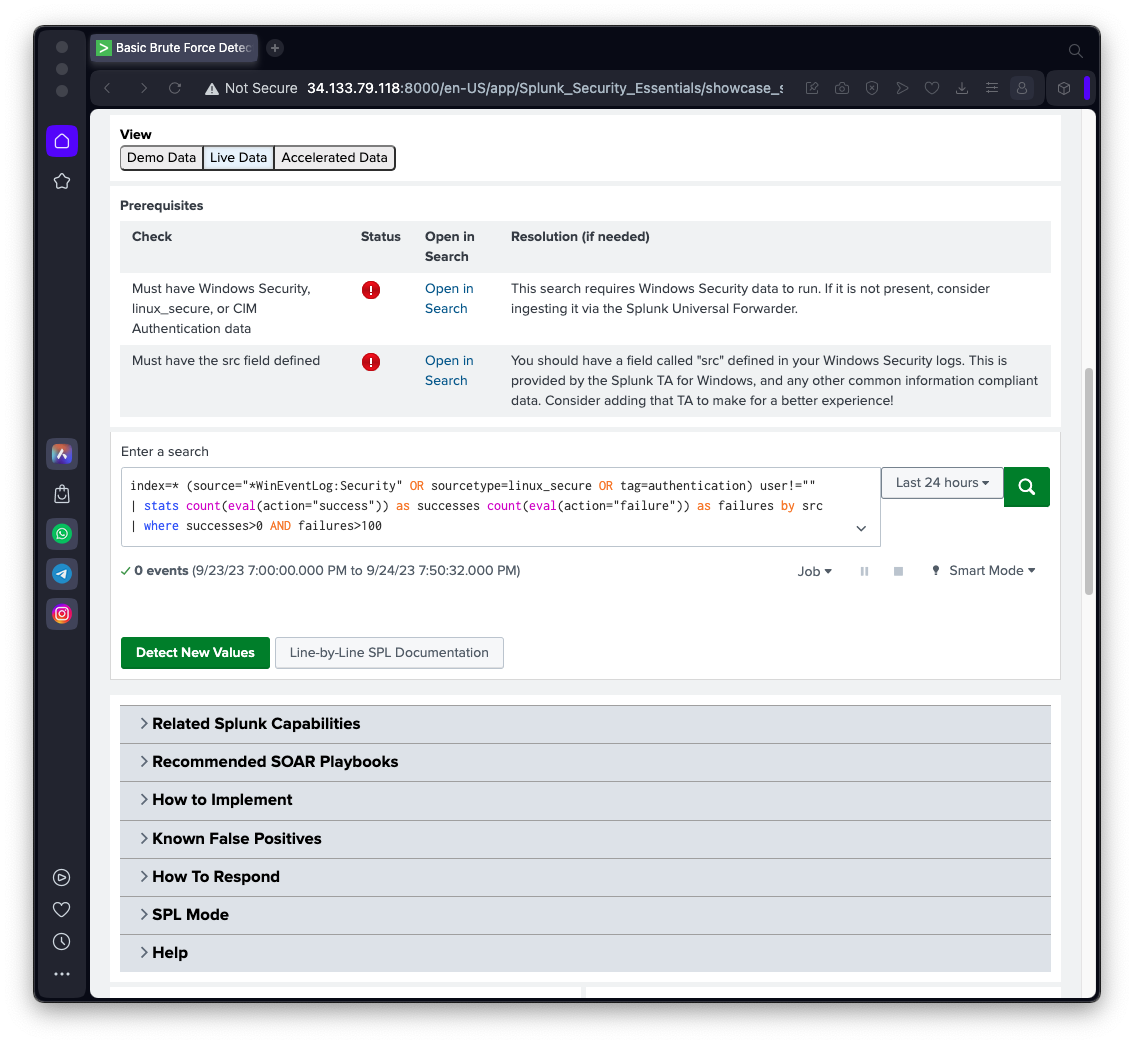
Click "Basic Brute Force Detection".
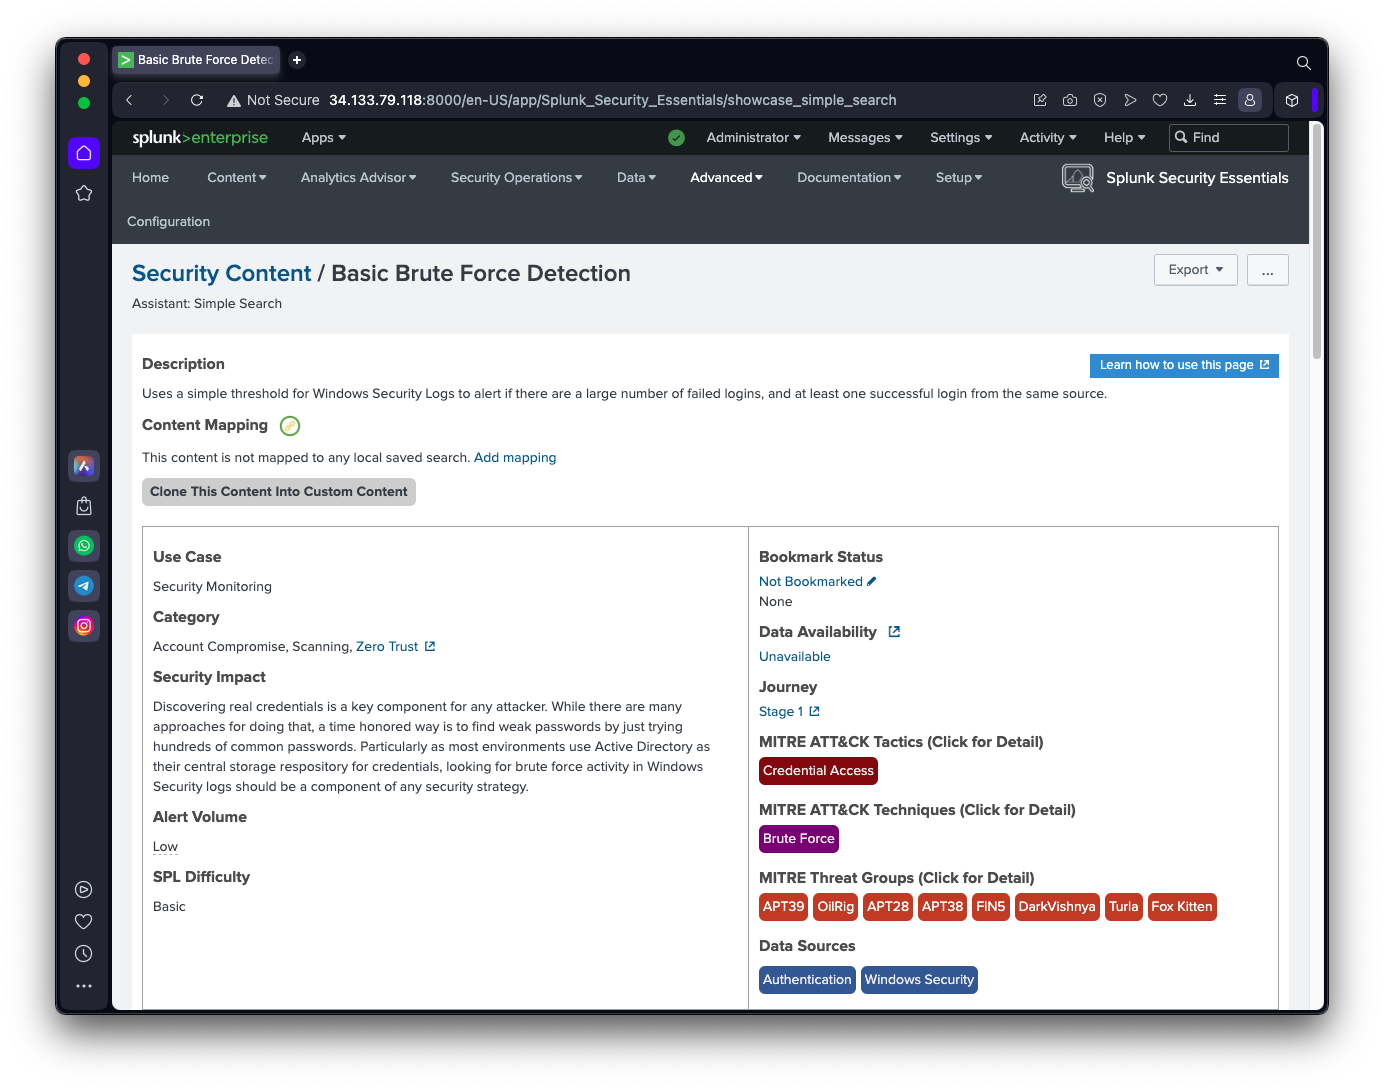
Note these items, as shown below.
Scroll down to see the other items, as shown below.
SPL 201.1: Recommended Action (5 pts)
Read the information on this page and find the recommended action for an account which was successfully brute-forced.The flag is covered by a green box in the image below.
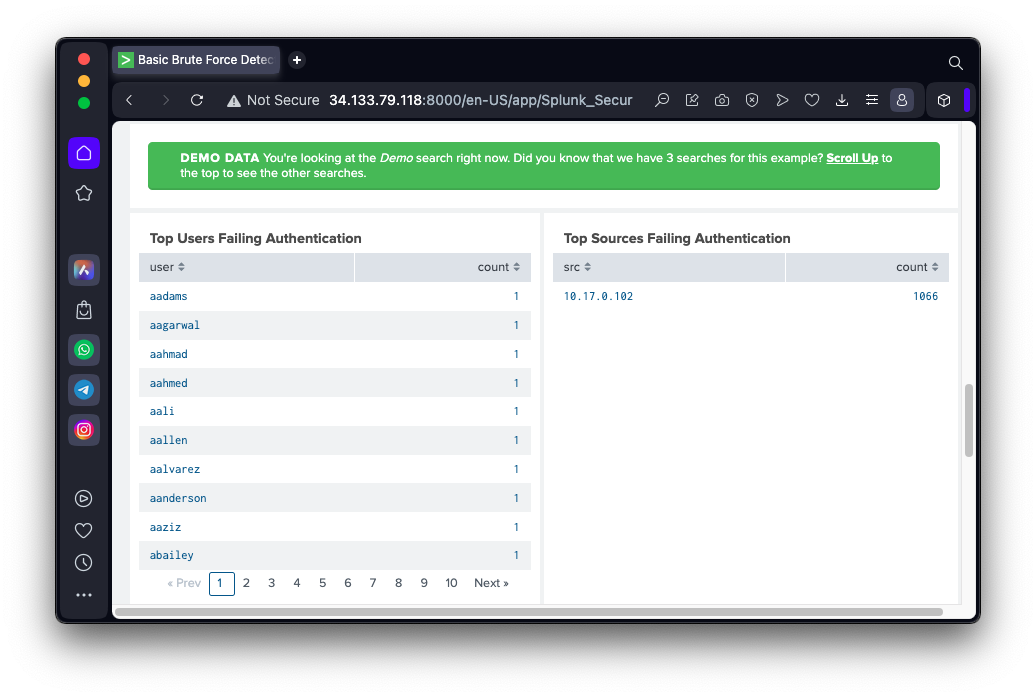
After the page refreshes, scroll down to see the results, as shown below.
Many usernames were used, as shown on the left side, and 1066 logins were attempted from the same IP address, as shown on the right side.
SPL 201.1: Recommended Action (5 pts)
Read the information on this page and find the recommended action for an account which was successfully brute-forced.The flag is covered by a green box in the image below.
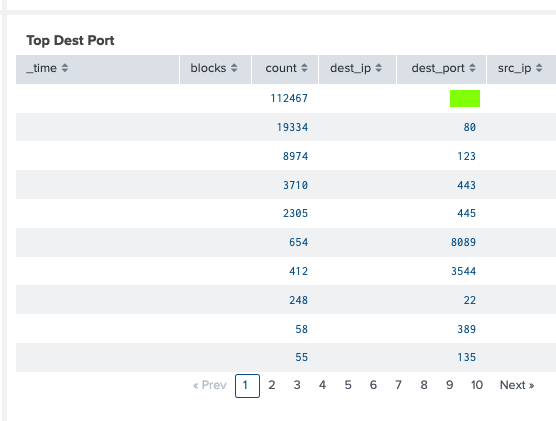
SPL 201.2: Destination Port (5 pts)
In the "Basic Scanning"example of Collection, run the Demo Data. Find the top destination port, as shown below.
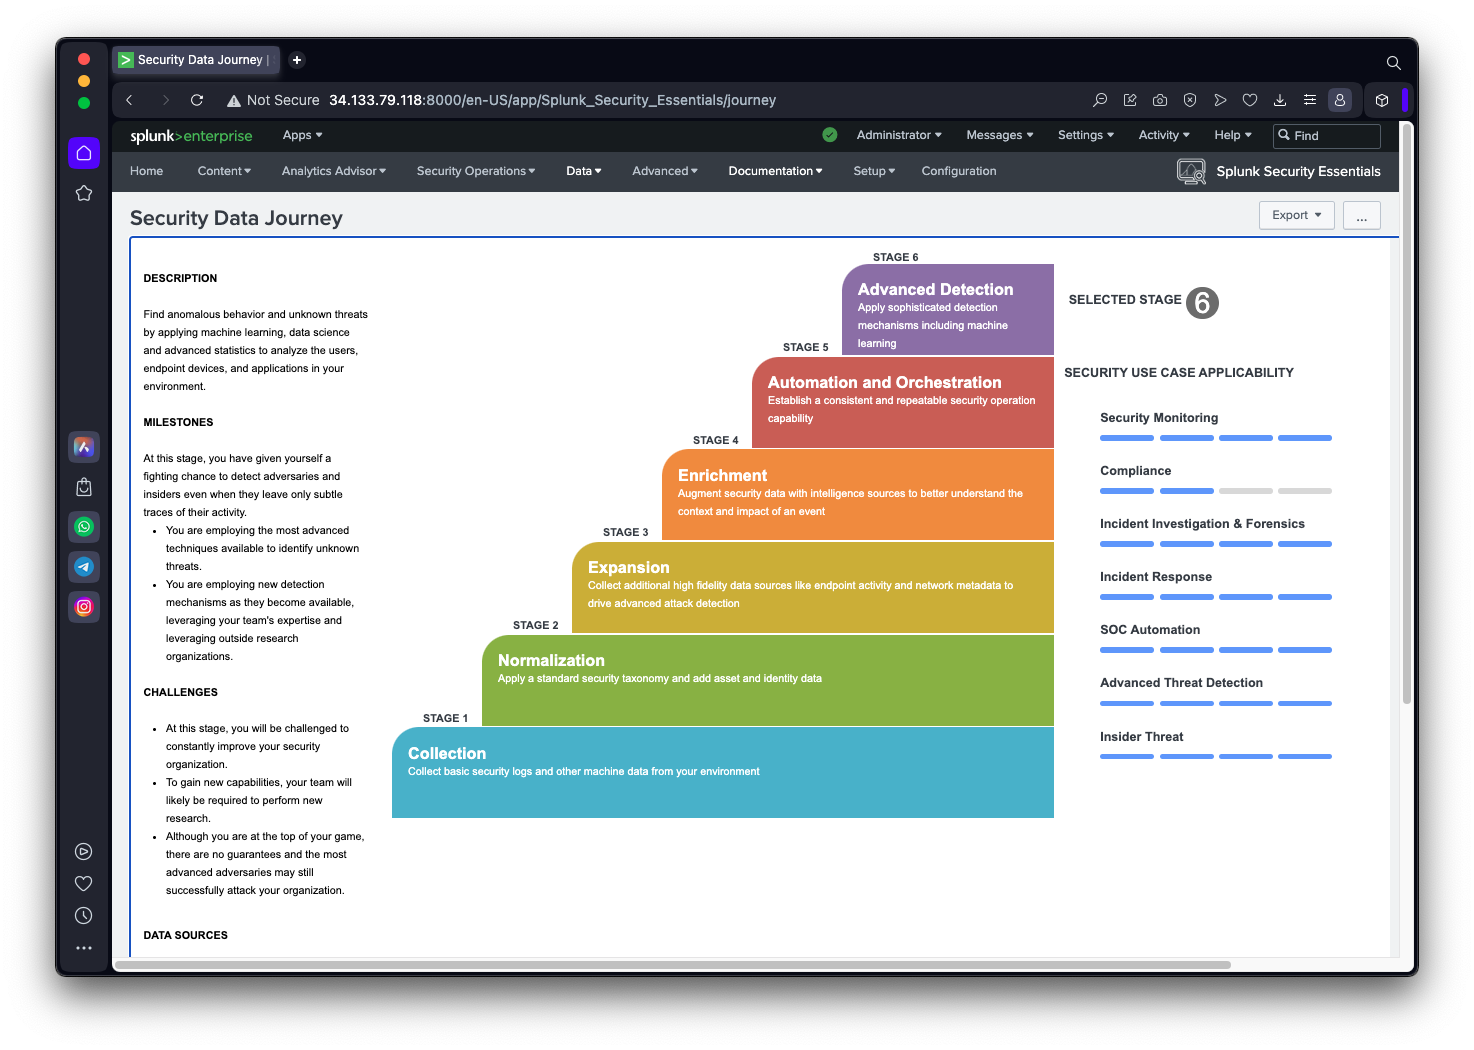
Click "Security Data Journey".
Click "Launch w/ tour".
The "Security Data Journey" page appears, as shown below.
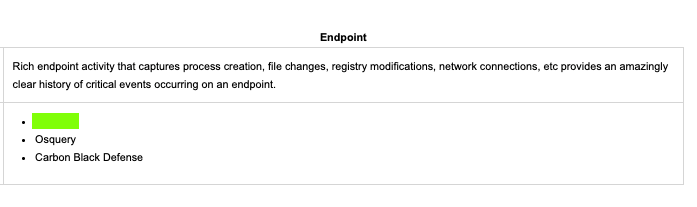
SPL 201.3: Endpoint Tools (5 pts)
Find the recommended endpoint monitoring tools shown below. The flag is covered by a green rectangle.
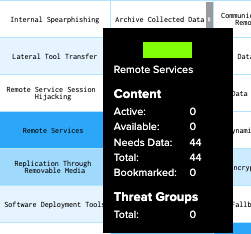
SPL 201.4: Remote Services (5 pts)
Find the item shown below. The flag is covered by a green rectangle.
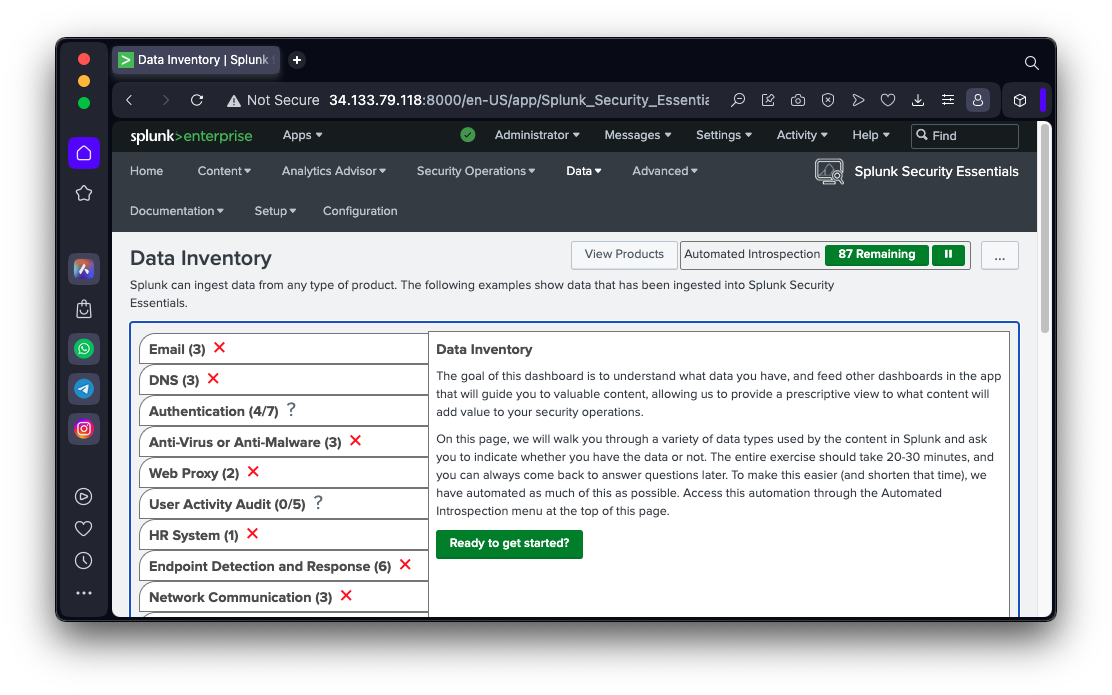
In the "Automated Introspection" box, click "Launch Automated Introspection".
On the left side, red X marks appear next to each item, because this Splunk server isn't collecting any data yet, as shown below.
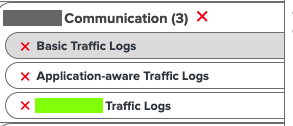
SPL 201.5: Traffic Logs (5 pts)
On the left side, expand each item one by one.Find the item shown below. The flag is covered by a green rectangle.
Splunk SOAR (Phantom) in 2022—Splunk Security Orchestration, Automation & Response Platform Overview
Getting started with Splunk Security Essentials
Posted 9-25-23