On your Windows machine, in a Web browser, open this page:
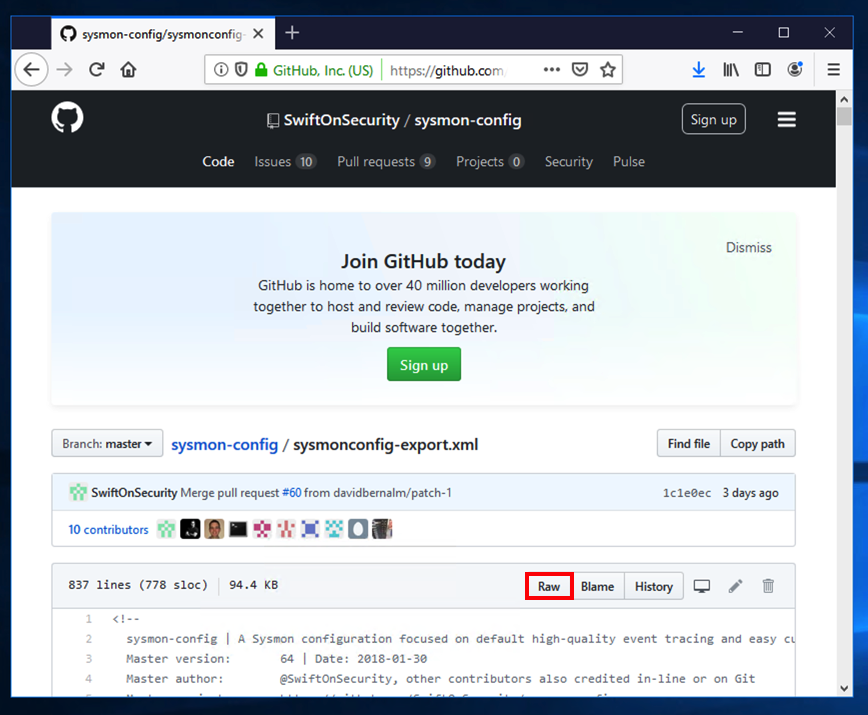
https://github.com/SwiftOnSecurity/sysmon-config/blob/master/sysmonconfig-export.xml
Right-click the Raw button, as shown below, and click "Save Target As..." or "Save Link As..." Save the sysmonconfig-export.xml file in your Downloads folder.
https://docs.microsoft.com/en-us/sysinternals/downloads/sysmon
Click "Download Sysmon".
Save the Sysmon.zip file in your Downloads folder.
At the bottom of your Windows desktop, click the yellow folder icon to open Windows explorer. Navigate to Downloads.
Right-click Sysmon. Click "Extract All...". Click Extract.
There are three versions of Sysmon:
In the User Account Control box, click Yes.
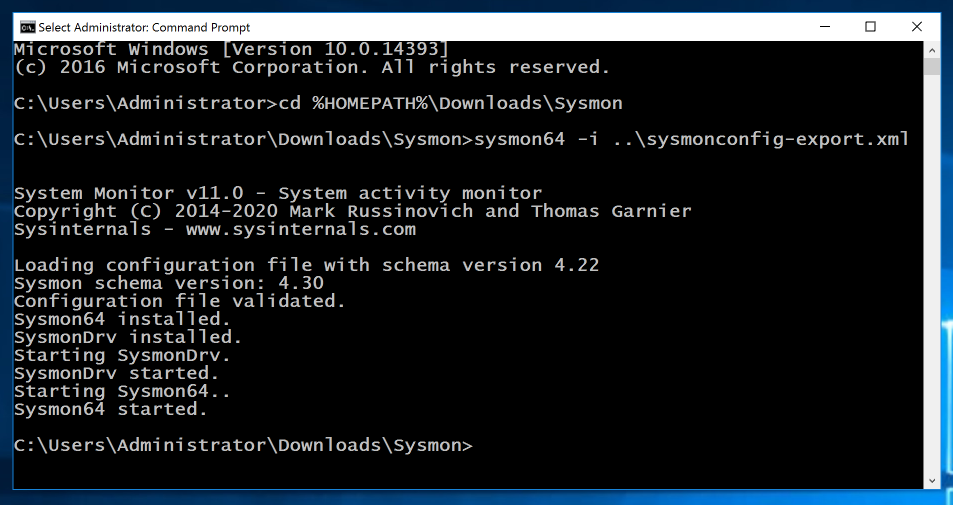
In the Command Prompt window, execute these commands, replacing "student" with your logon name.
Note: if you are using Windows on ARM64, replace "sysmon64" with "sysmon64a" in the second command.
cd %HOMEPATH%\Downloads\Sysmon
sysmon64 -i ..\sysmonconfig-export.xml
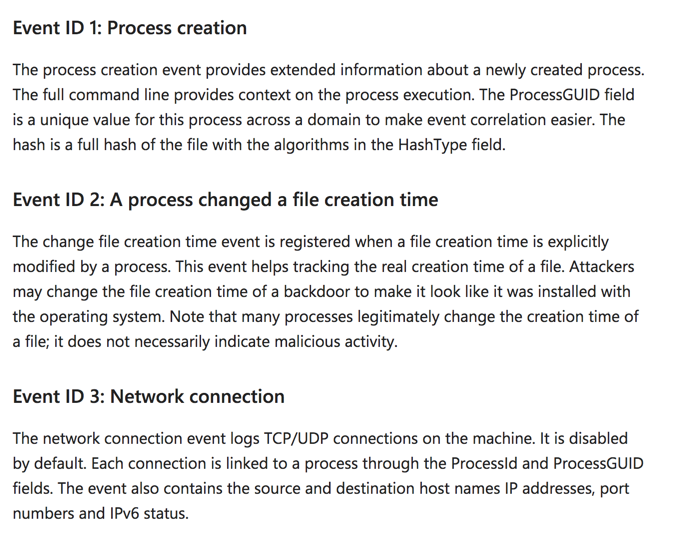
Sysmon starts, as shown below.
There are also events for registry changes.
In the left pane, expand these items, as shown below:
In the upper middle pane, log entries are visible, as shown below:
echo 1 > ../TEST.EXE
In Event Viewer, click the "Event ID" header to sort the events by ID number.
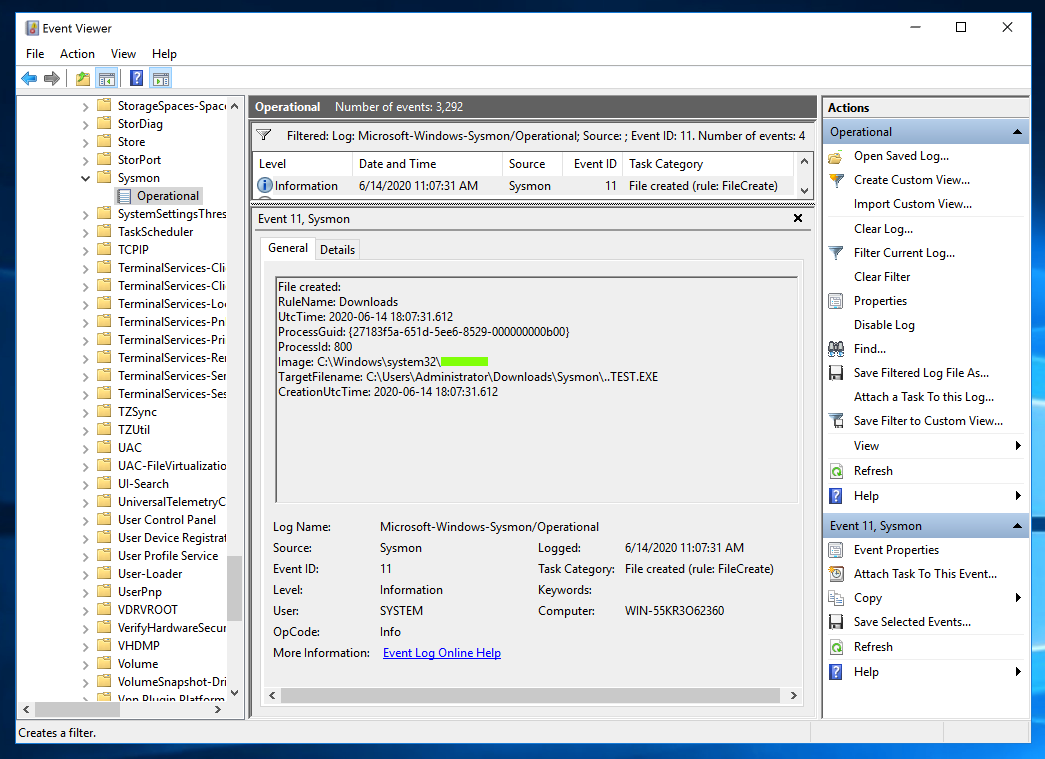
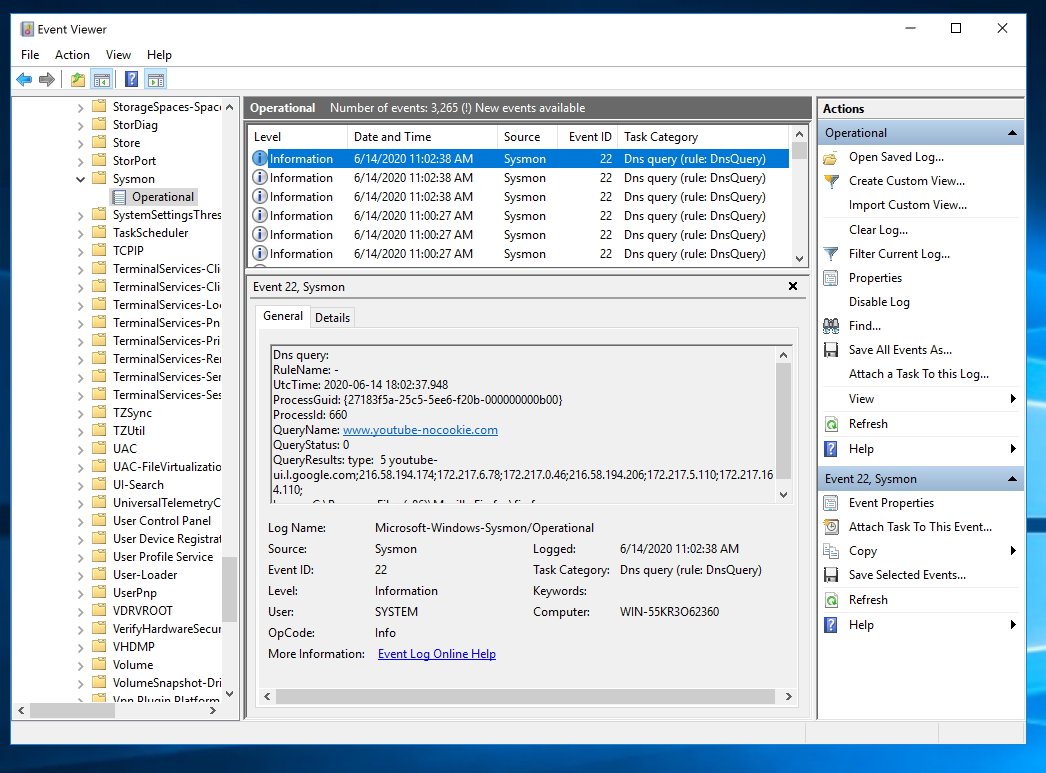
Scroll down to find the event with Event ID 11 and a Task Cetegory of "File created...", as shown below.
Notice that the complete path to the created file appears in the TargetFilename field.
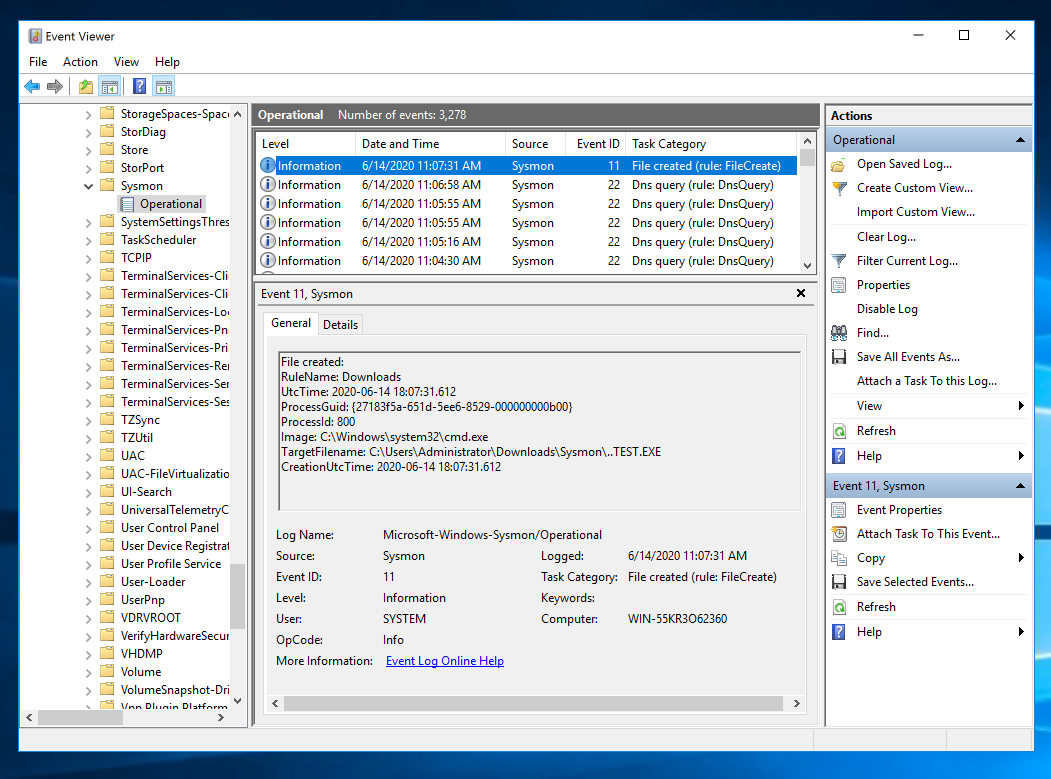
In the "Filter Current Log", in the middie, click the field containing "<All Event IDs>" and type 11, as shown below.
Then click OK.
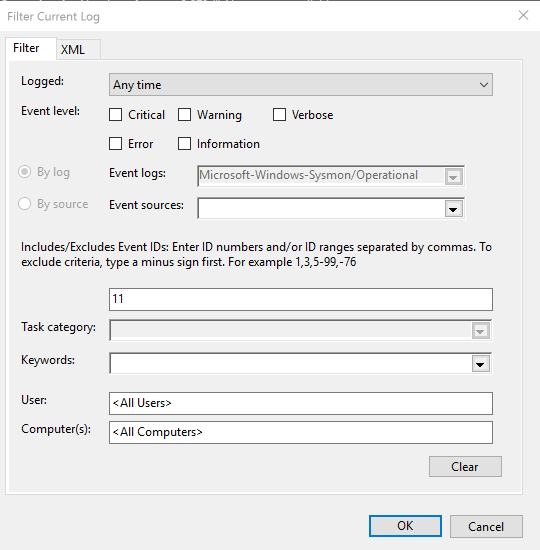
Click the first event found. You see details about the "TEST.EXE" file you created, as shown below.
Flag IR 330.1: Image (5 pts)
The flag is covered by a green box in the image below.
localhost:8000
A Splunk login page appears, as shown below.
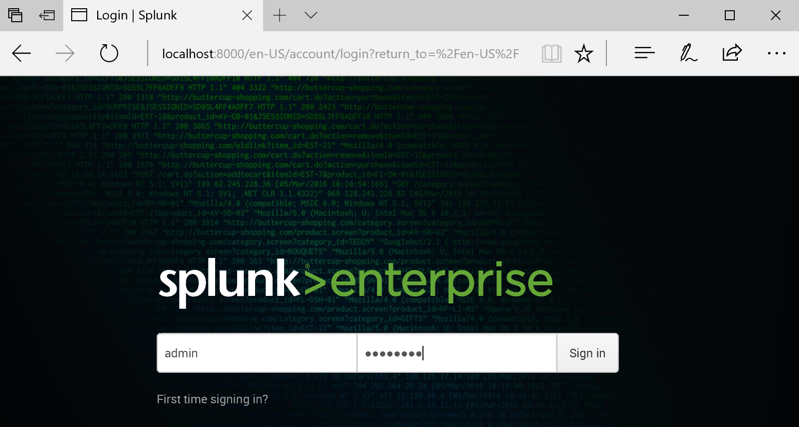
Log in. If you followed the steps in project IR 301, your credentials are admin and P@ssw0rd
If you have lost your password, reinstall Splunk or try this process.
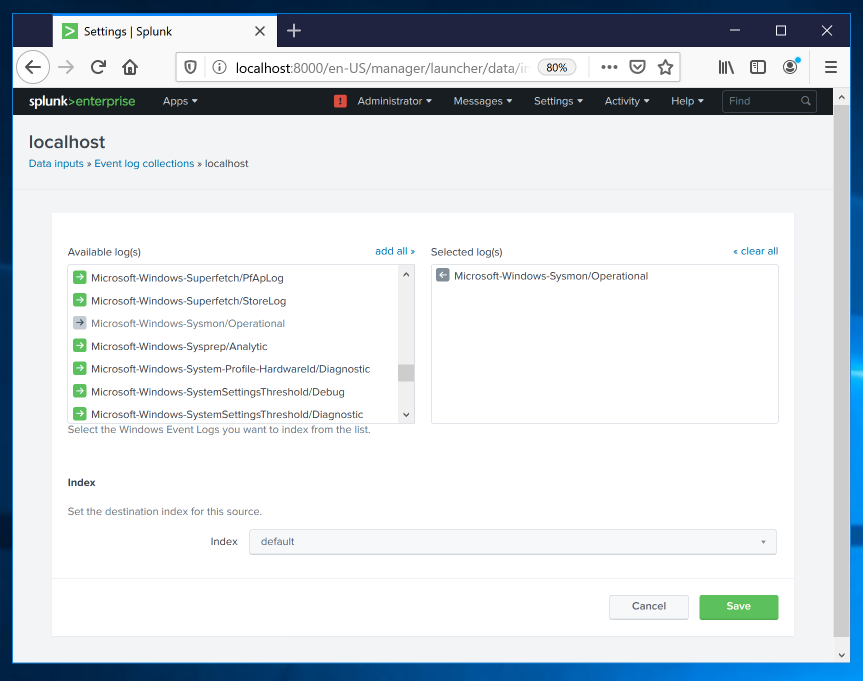
In the "Local Inputs" list, click "Local event log collection".
In the "Available log(s)" list, scroll down and click Microsoft-Windows-Sysmon/Operational, as shown below.
Then click Save.
At the top left, click "Search & Reporting".
In the center right, click the "Data Summary" button.
In the "Data Summary" box, click the Sourcetypes tab.
You should see a sourcetype of
WinEventLog:Microsoft-Windows-Sysmon/Operational
as shown below.
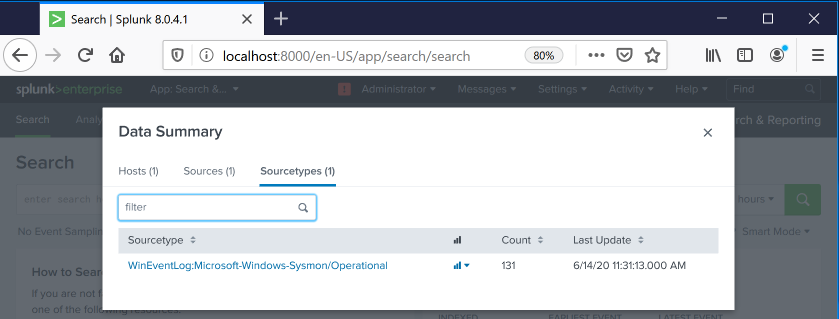
Click WinEventLog:Microsoft-Windows-Sysmon/Operational .
Splunk searches and finds the events.
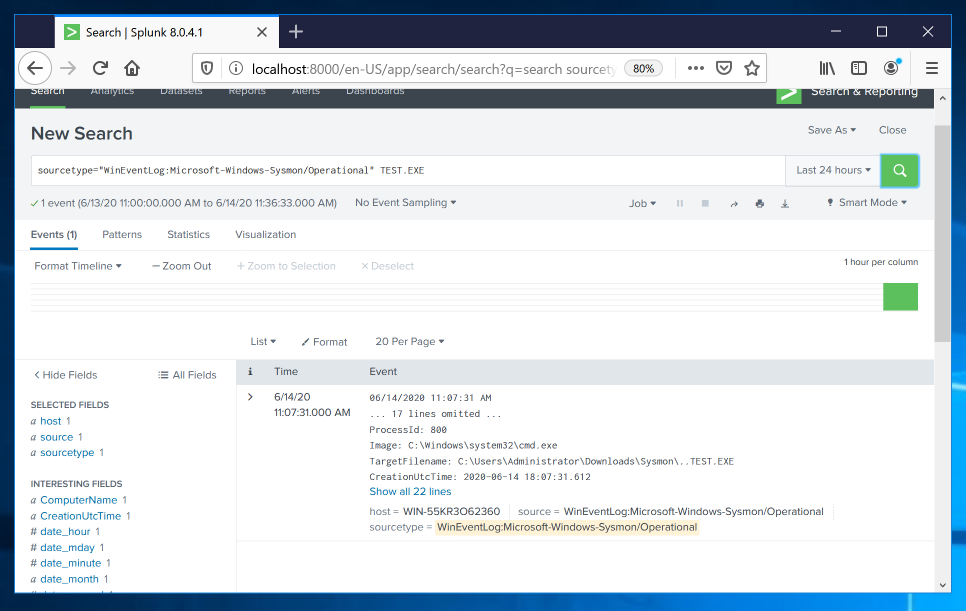
Add TEST.EXE to the query, as shown below, and click the green magnifying glass icon to run the search again.
Splunk finds the event you saw earlier in Event Viewer, as shown below.
Click "Search & Reporting".
Enter this in the "New Search" field, as shown below.
Then click the magnifying glass icon on the right side.
sourcetype="WinEventLog:Microsoft-Windows-Sysmon/Operational"
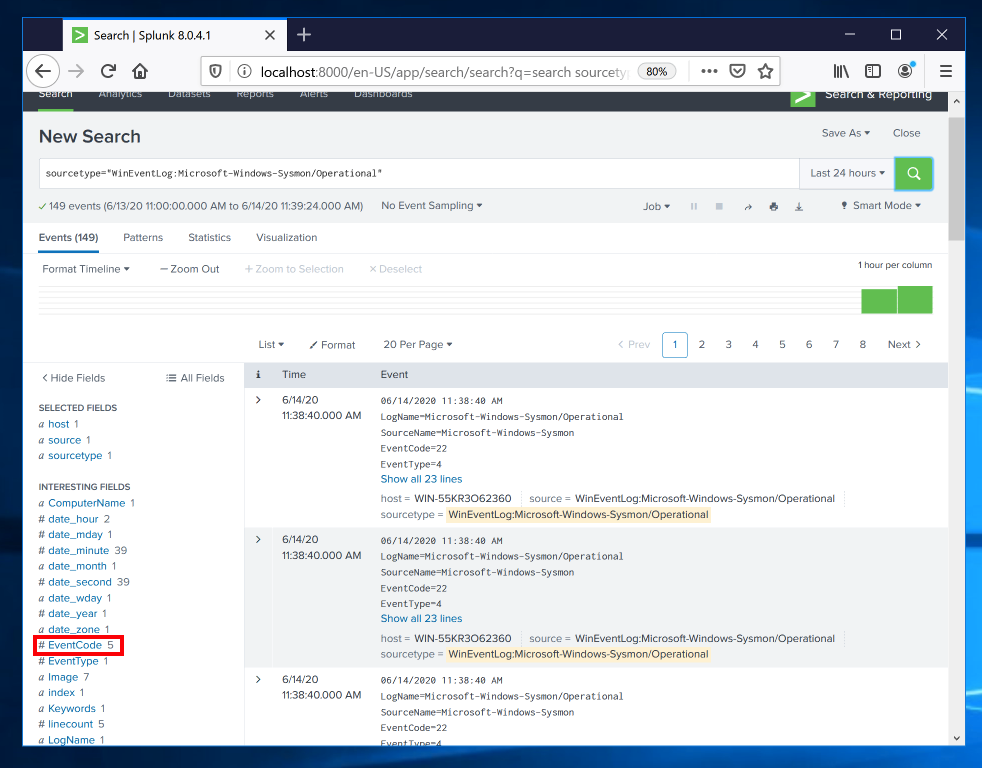
Click EventCode. A box pops up showing the observed values of EventCode, as shown below.
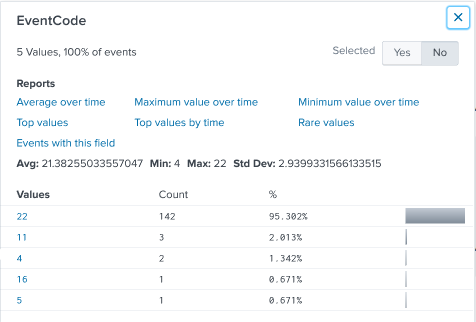
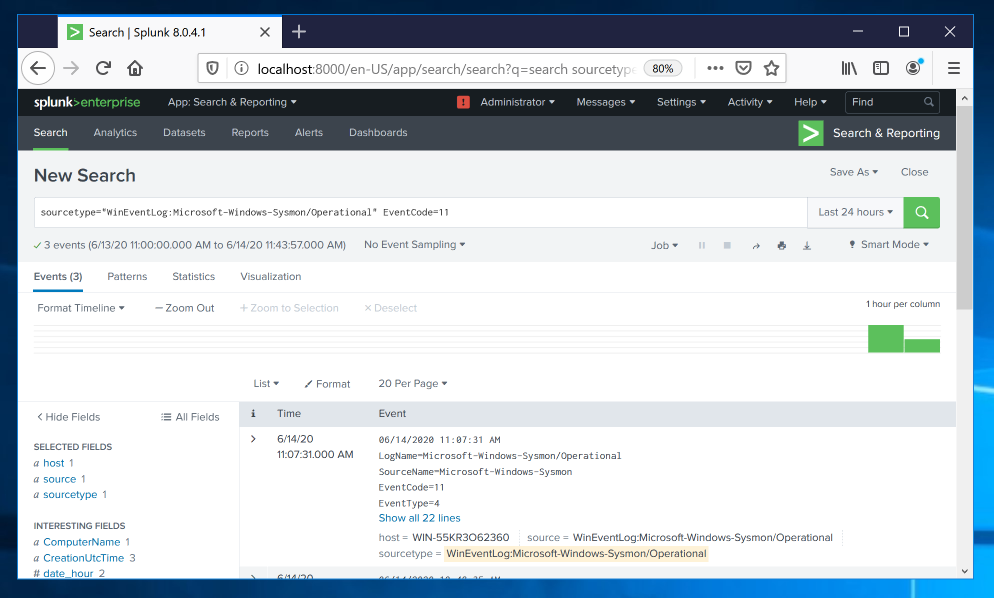
In the EventCode box, in the Values column, click 11.
Events showing file creation are found, as shown below.
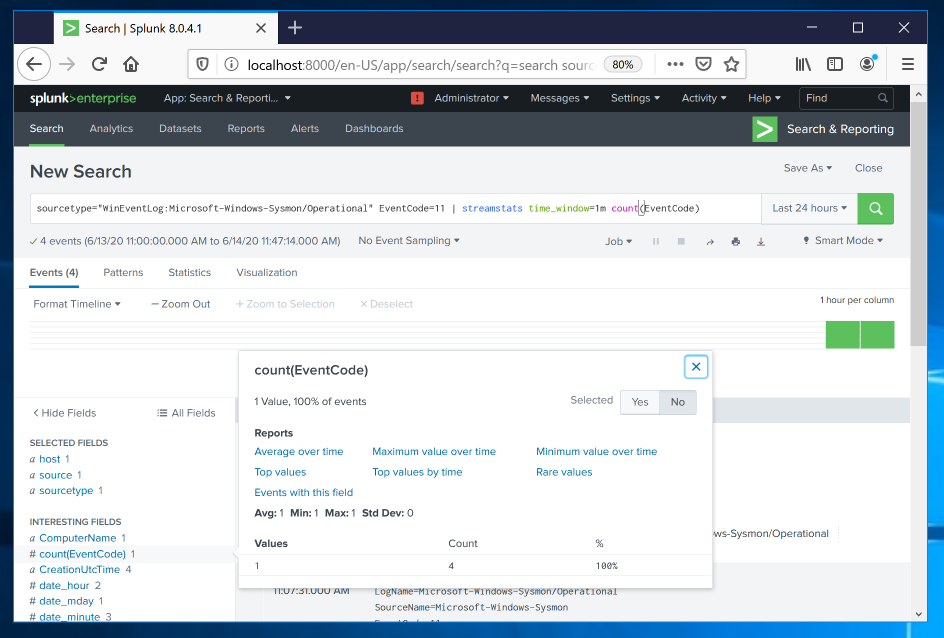
Then add this line to the query, as shown below.
| streamstats time_window=1m count(EventCode)
On the lower left, in the "Interesting Fields" section, click count(EventCode).
There haven't been more than one such event per minute so far, as shown below.
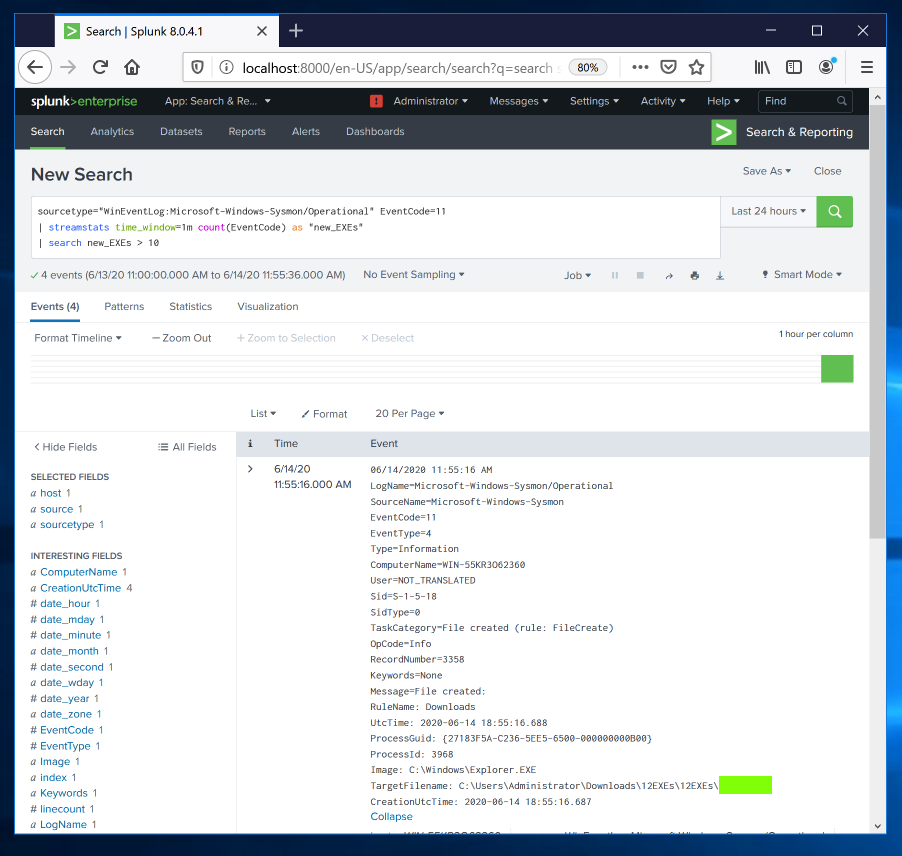
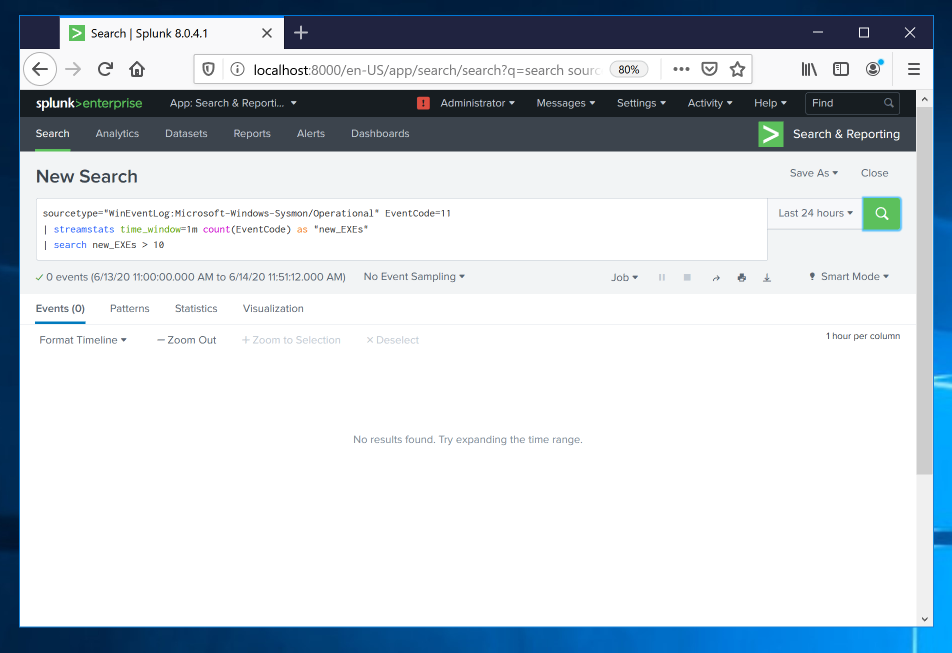
Adjust your query to look like this, as shown below.
sourcetype="WinEventLog:Microsoft-Windows-Sysmon/Operational" EventCode=11
| streamstats time_window=1m count(EventCode) as "new_EXEs"
| search new_EXEs > 10
https://samsclass.info/50/proj/12EXEs.zip
Save the file in your Downloads folder.
At the bottom of your Windows desktop, click the yellow folder icon to open Windows explorer. Navigate to Downloads.
Right-click 12files and click "Extract All...". Click Extract.
Now events are found. In the first event, click "Show all 23 lines".
Complete information about the event apears, as shown below.
Flag IR 330.2: TargetFilename (10 pts)
The flag is covered by a green box in the image below.
In the search results, click regedit. In the User Account Control box, click Yes.
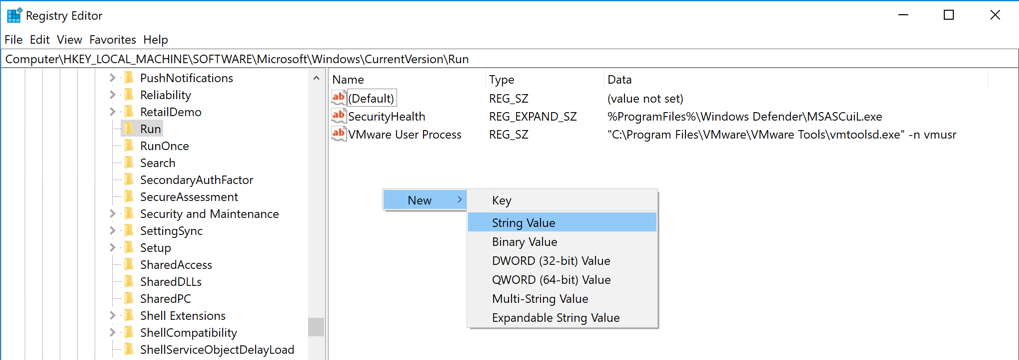
In Registry Editor, in the left pane, navigate to this key, as shown below.
HKEY_LOCAL_MACHINE\Software\Microsoft\Windows\CurrentVersion\Run
In the right pane, right-click an empty space and click New, "String Value", as shown below.
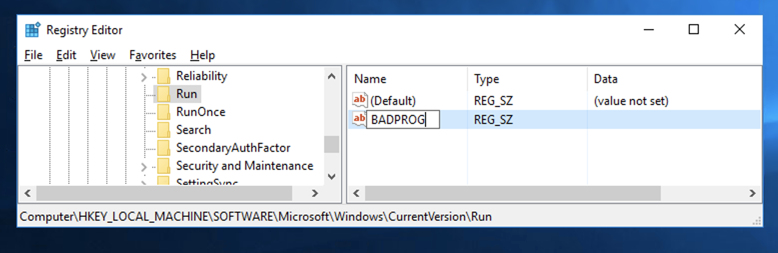
A new value appears, with its name highlighted. Type over the name, entering BADPROG as shown below.
Press Enter.
Close Regedit.
sourcetype="WinEventLog:Microsoft-Windows-Sysmon/Operational" Registry
Flag IR 330.3: TargetFilename (5 pts)
Find the EventCode that shows the name of the new Run key.That's the flag.