https://docs.microsoft.com/en-us/sysinternals/downloads/sysmon
Click "Download Sysmon".
Save the Sysmon.zip file in your Downloads folder.
At the bottom of your Windows desktop, click the yellow folder icon to open Windows explorer. Navigate to Downloads.
Right-click Sysmon. Click "Extract All...". Click Extract.
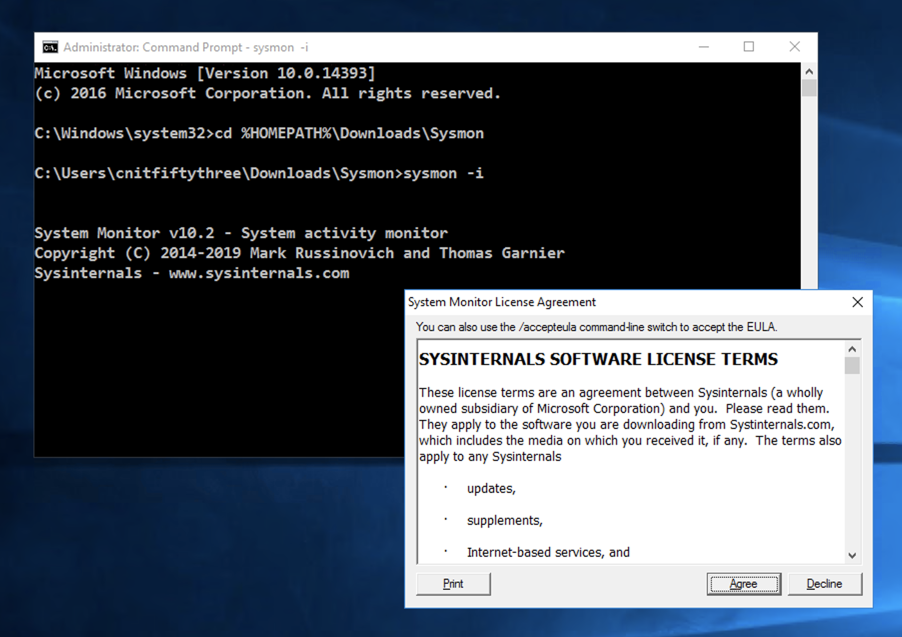
Click Start. Type CMD. Right-click "Command Prompt" and click "Run as Administrator".
In the User Account Control box, click Yes.
In the Command Prompt window, execute these commands, replacing "student" with your logon name.
cd %HOMEPATH%\Downloads\Sysmon
sysmon -i
There are also events for registry changes.
localhost:8000
A Splunk login page appears, as shown below.
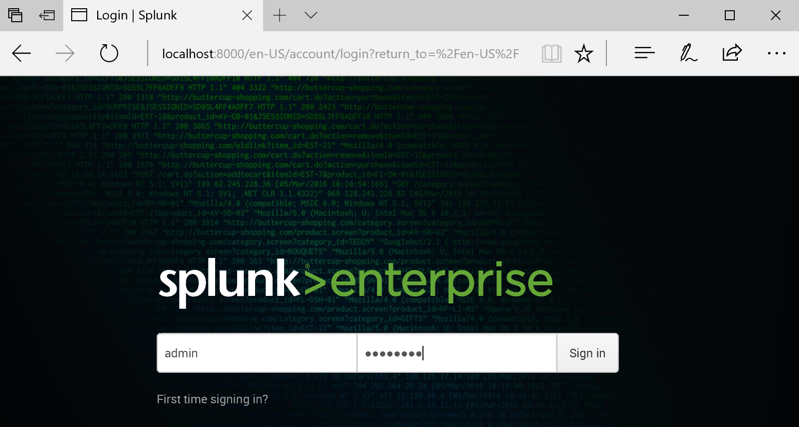
Log in. If you followed the steps in the previous project, your credentials are admin and password
If you have lost your password, reinstall Splunk or try this process.
https://splunkbase.splunk.com/app/1914/
Click the green "LOGIN TO DOWNLOAD" button.
Log in with your Splunk account.
Click the green Download button.
Accept the license agreement and click "Agree to Download".
Save the add-on-for-microsoft-sysmon_604.tgz file in your Downloads folder.
Click OK.
In the Splunk administration page, at the top left, click splunk.
At the top left, next to "Apps", click the gear icon, as shown below.
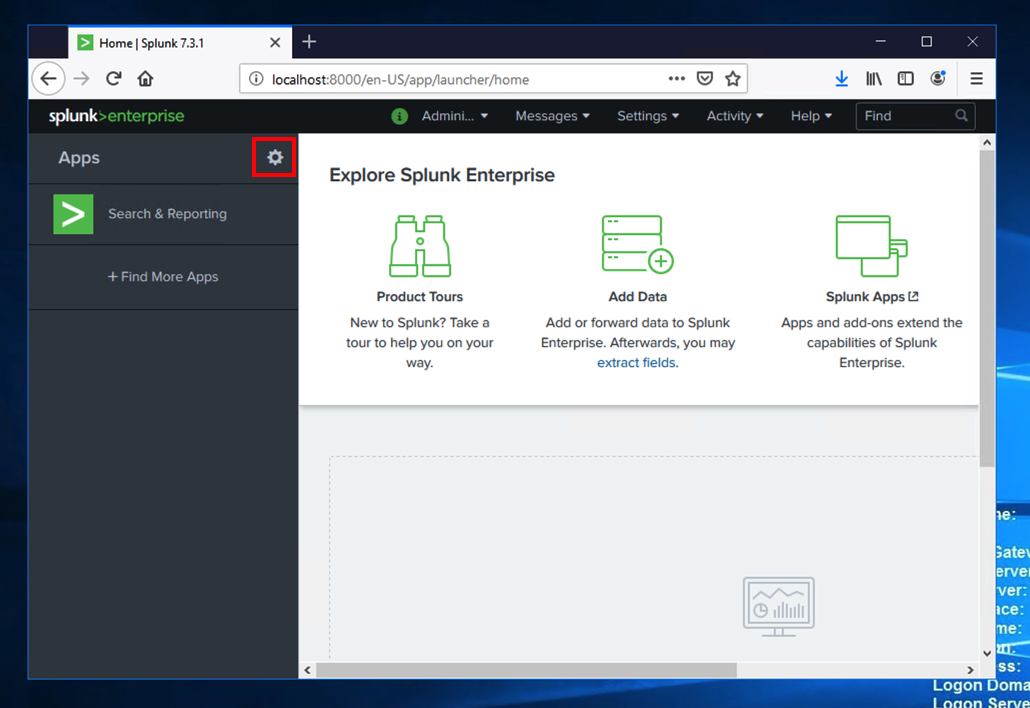
Click "Install app from file".
In the "Upload a file" page, click the Browse... button.
Nagivate to your Downloads folder and click the add-on-for-microsoft-sysmon_810.tgz file.
Click Open.
Click Upload.
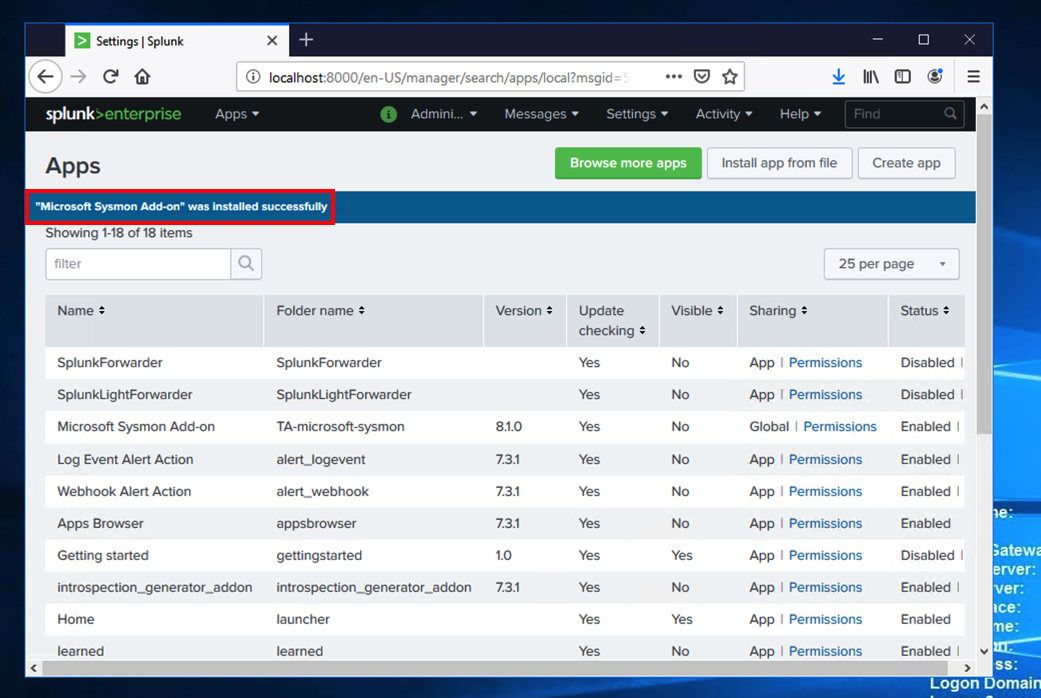
A message appears saying "App "Microsoft Sysmon Add-on" was installed successfully", as shown below.
Click "Search & Reporting".
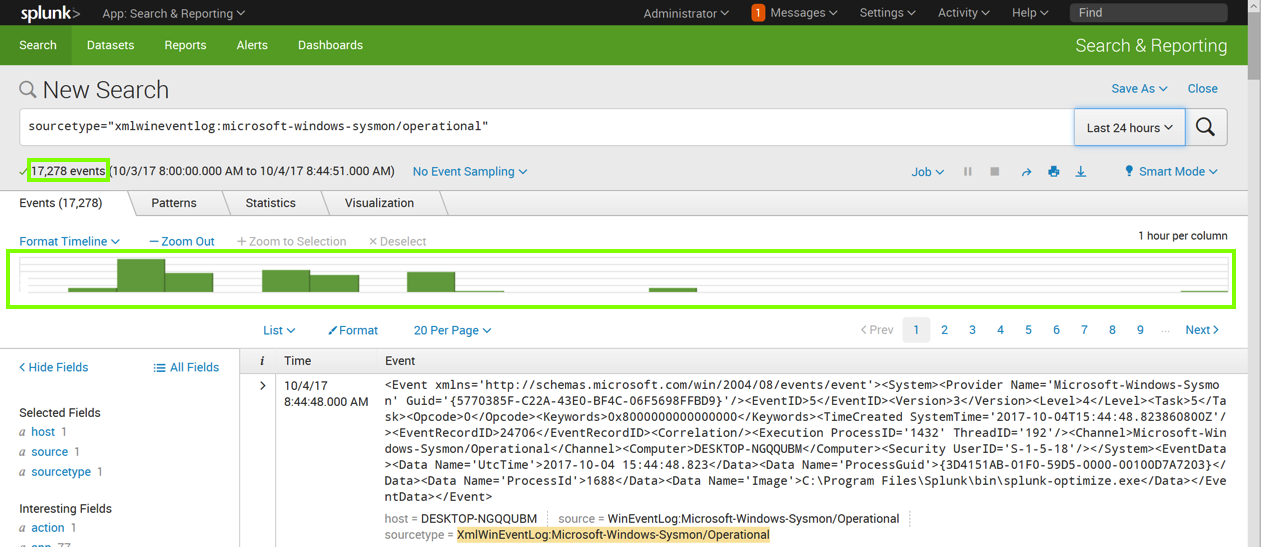
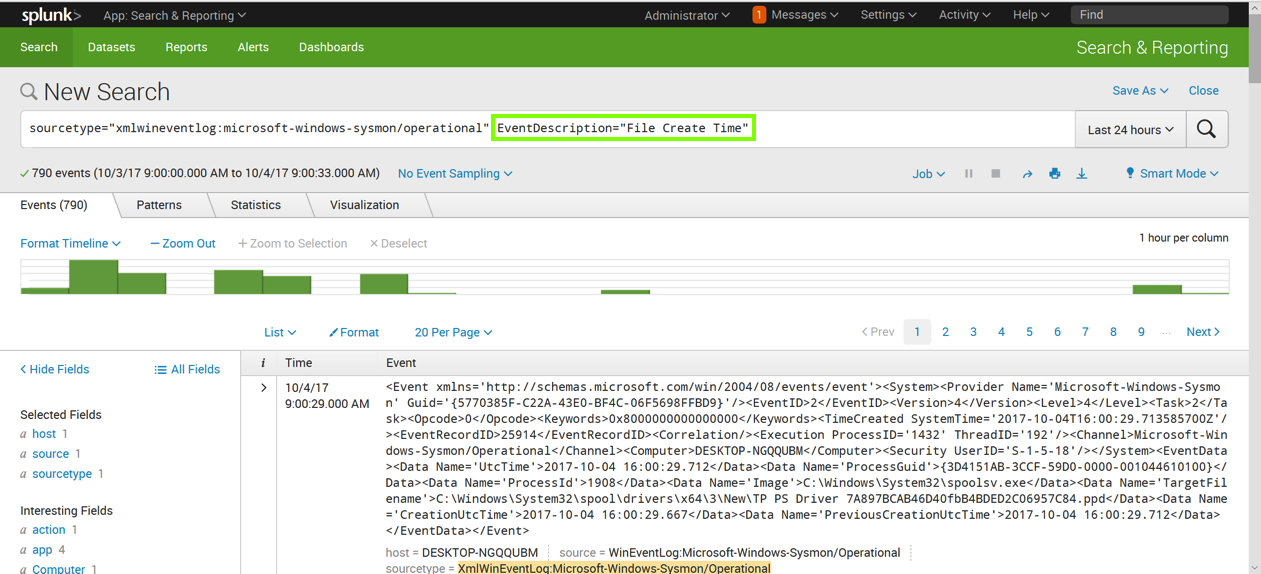
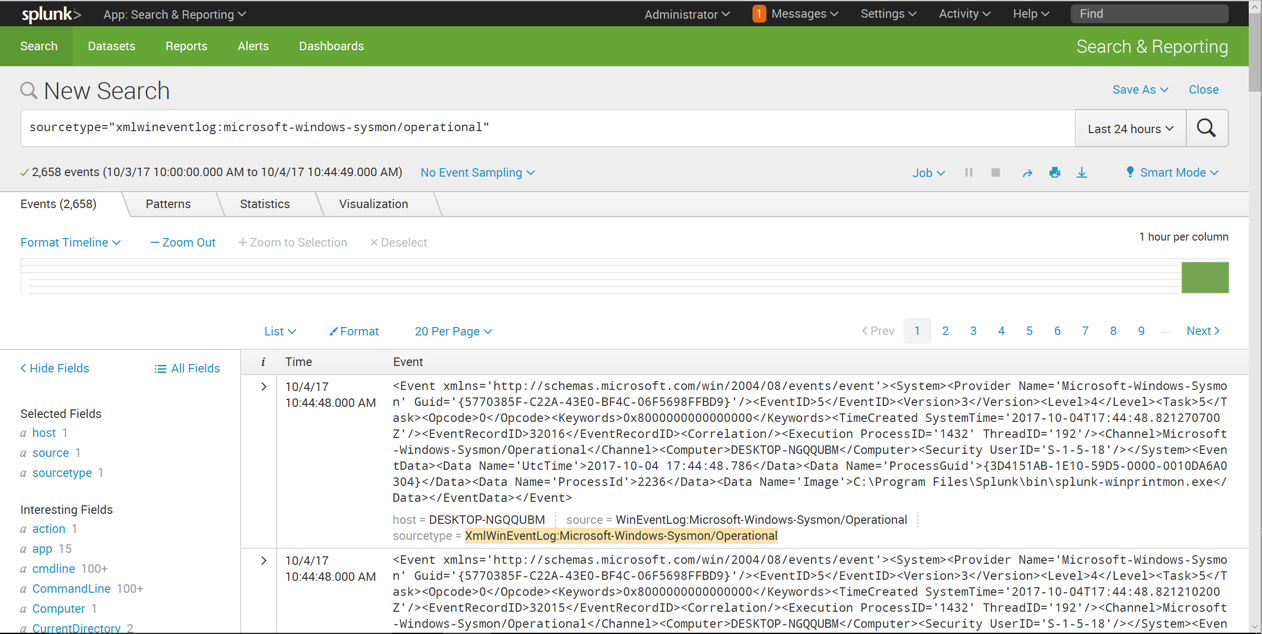
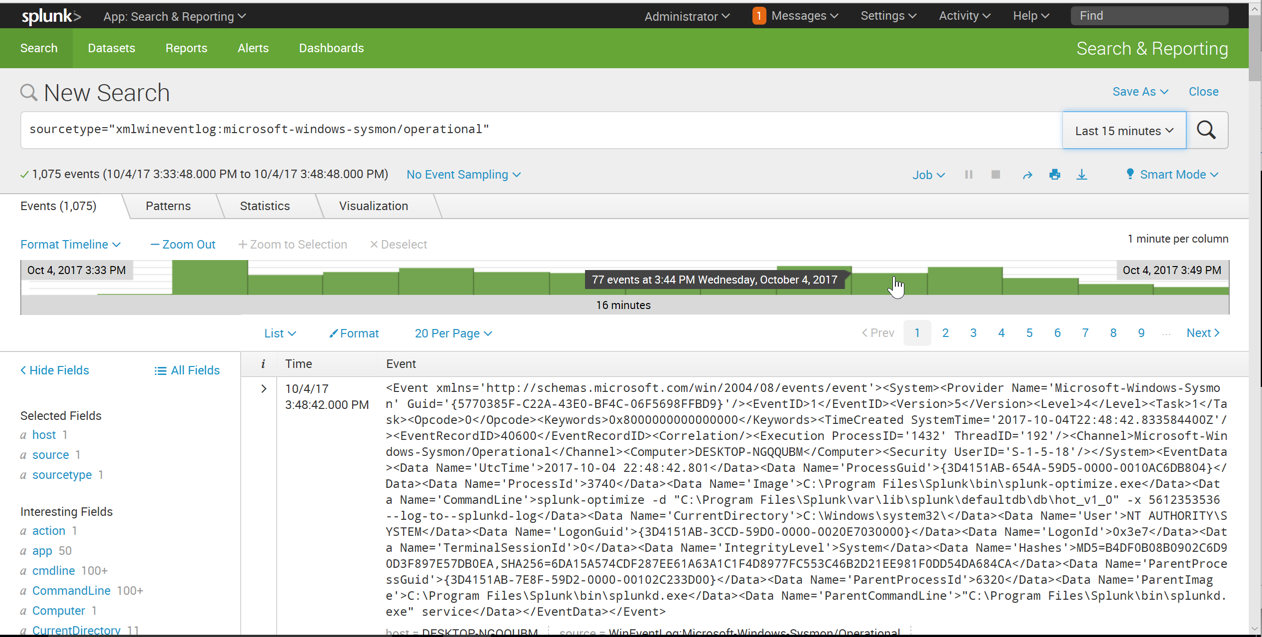
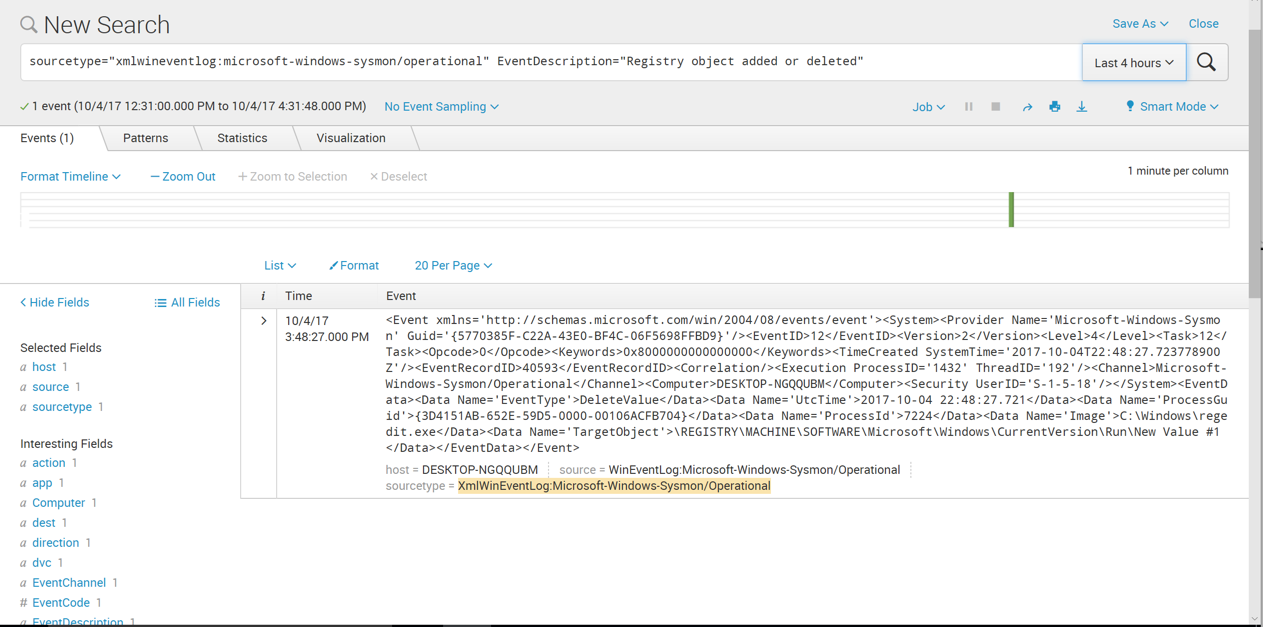
Enter this in the "New Search" field, as shown below. Click the magnifying glass icon on the right side.
sourcetype="xmlwineventlog:microsoft-windows-sysmon/operational"
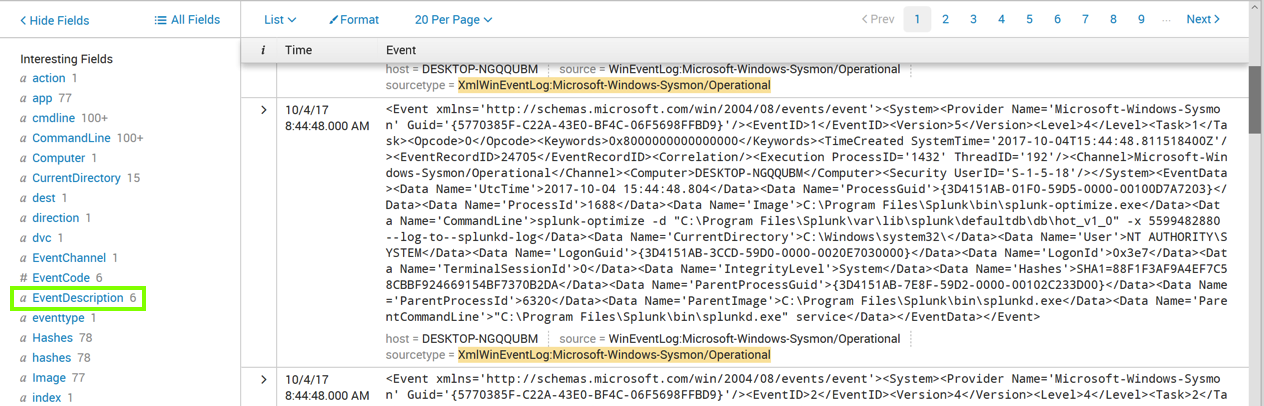
Click EventDescription, as outlined in green in the image above.
An "EventDescription" box pops up, showing how many events of each type were found, as shown below.
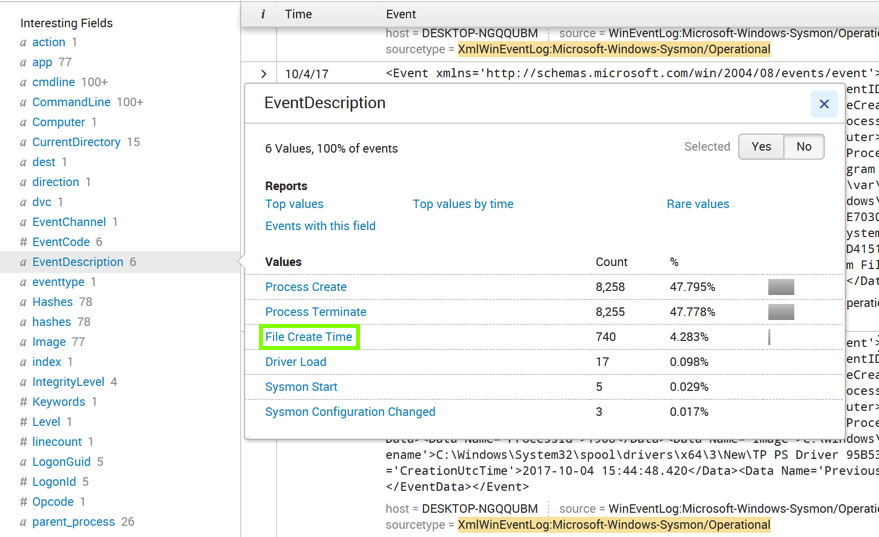
Click "File Create Time", as outlined in green in the image above.
The Search page refreshes. Now the query is more specific, finding only events with EventDescription="File Create Time", as outlined in green in the image below.
Then add this line to the query, as shown below.
| streamstats count(EventDescription)
This query gives the same number of results, but now there's a new item in the "Interesting Fields" section: count(EventDescription), outlined in green, in the lower left of the image below.
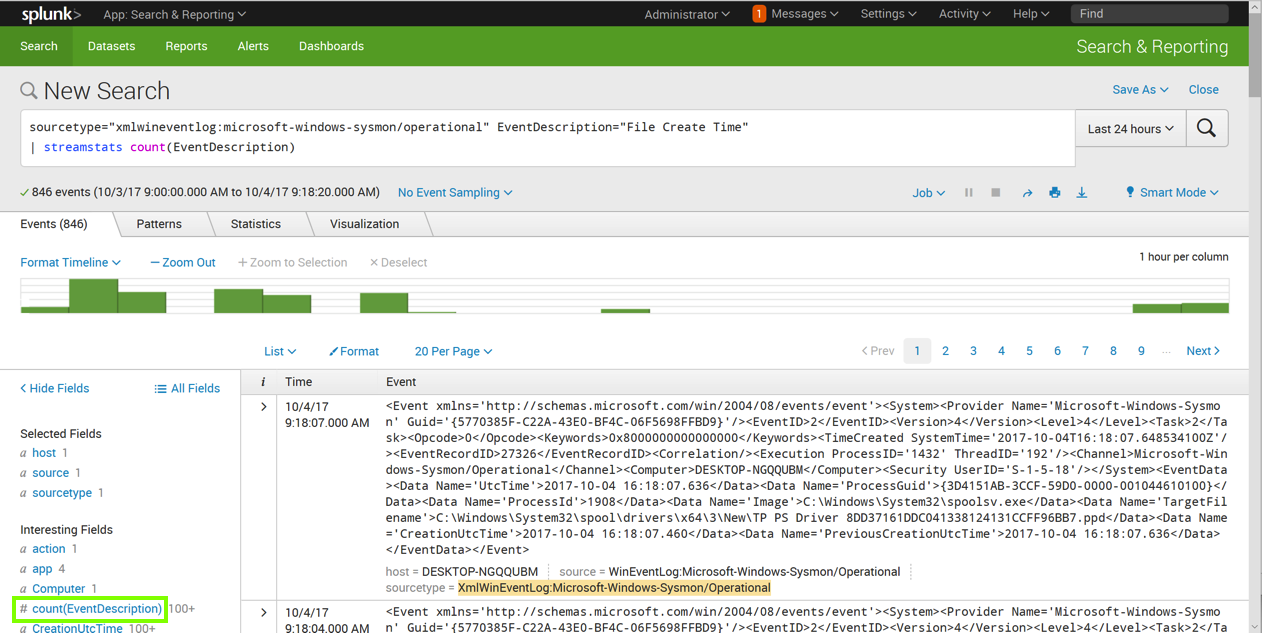
On the lower left, in the "Interesting Fields" section, click count(EventDescription).
A pop-up box appears, showing information about this field, as shown below.
Notice that the "Min" value is 1, and the "Max" value is equal to the total number of events, as shown below.
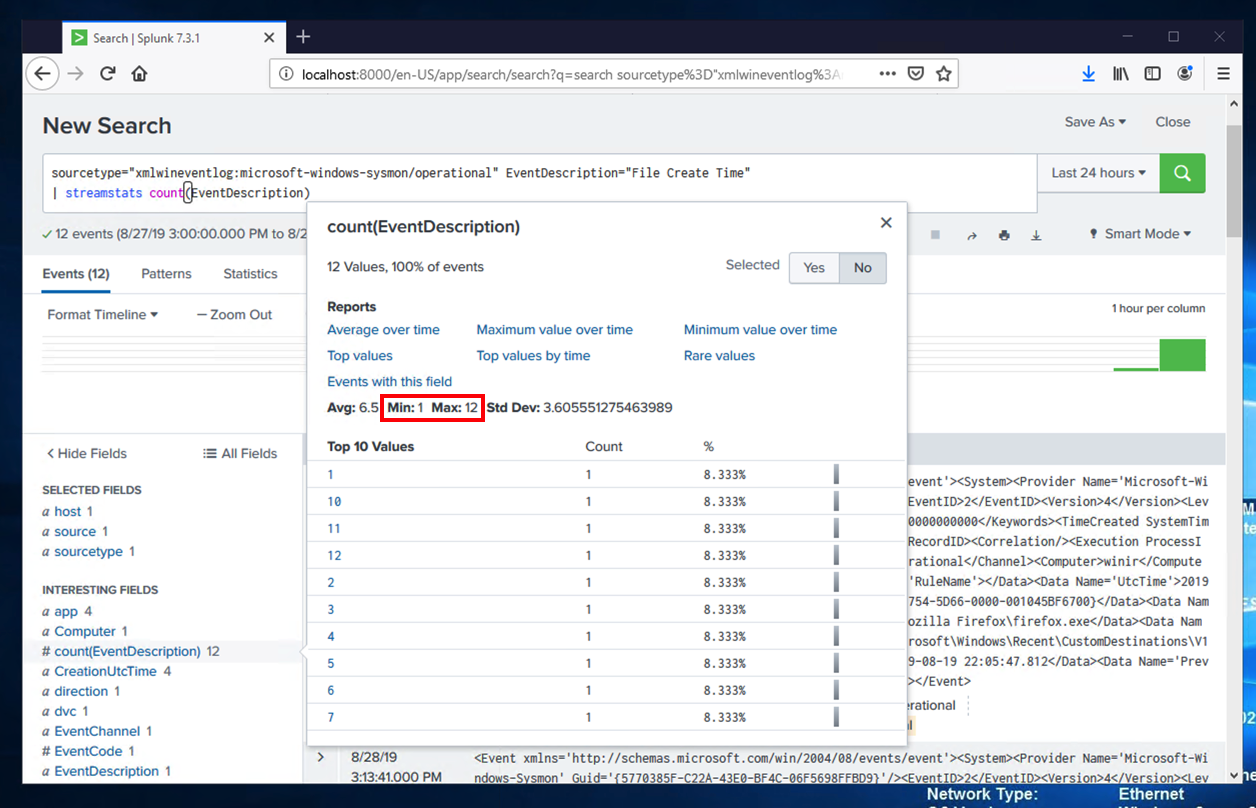
That's not very useful. To make it useful, we need to count events within a time interval, such as per minute.
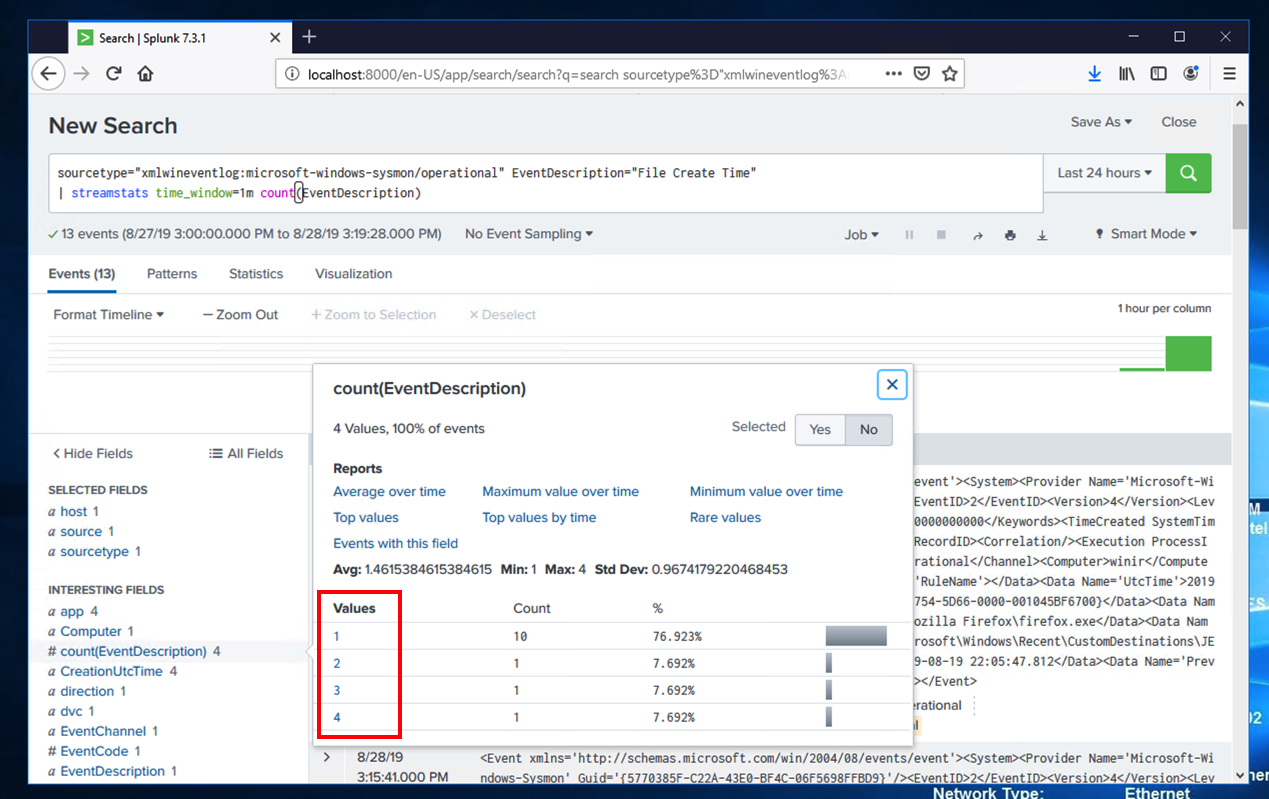
Adjust your query to look like this, as shown below.
sourcetype="xmlwineventlog:microsoft-windows-sysmon/operational" EventDescription="File Create Time"
| streamstats time_window=1m count(EventDescription)
On the lower left, in the "Interesting Fields" section, click count(EventDescription).
It's common for 3 or 4 of these events to occur in a minute, but no larger numbers were visible in this sample, as shown below.
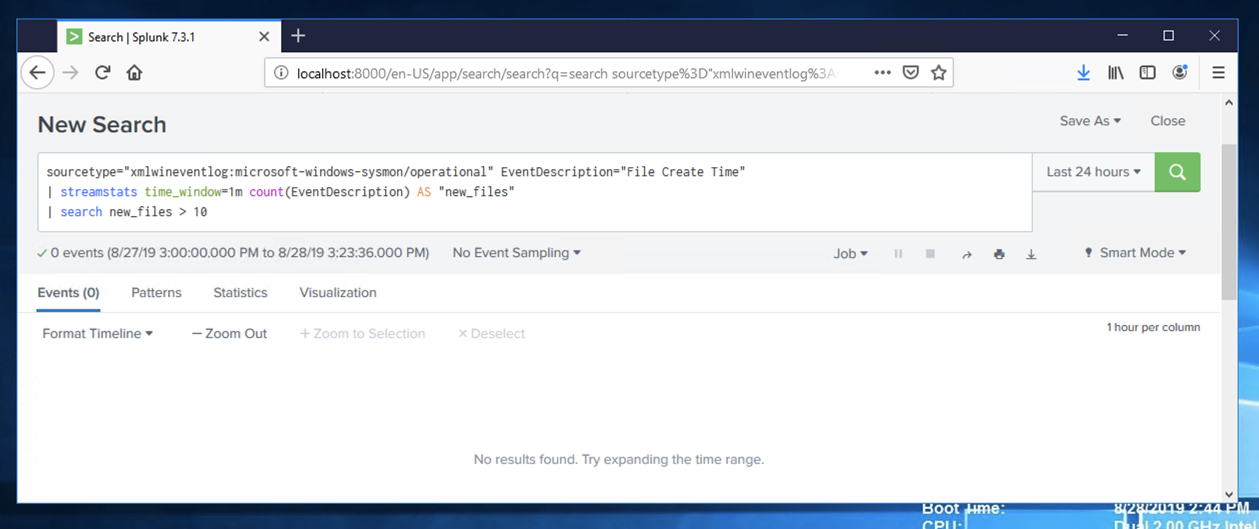
Adjust your query to look like this, as shown below.
sourcetype="xmlwineventlog:microsoft-windows-sysmon/operational" EventDescription="File Create Time"
| streamstats time_window=1m count(EventDescription) AS "new_files"
| search new_files > 10
https://samsclass.info/50/proj/12files.zip
Save the file in your Downloads folder.
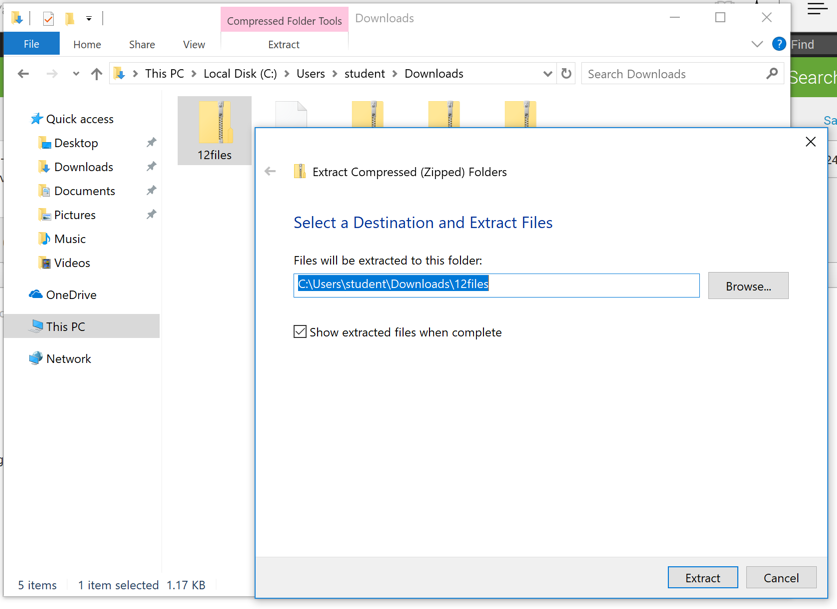
At the bottom of your Windows desktop, click the yellow folder icon to open Windows explorer. Navigate to Downloads.
Right-click 12files and click "Extract All...". Click Extract, as shown below.
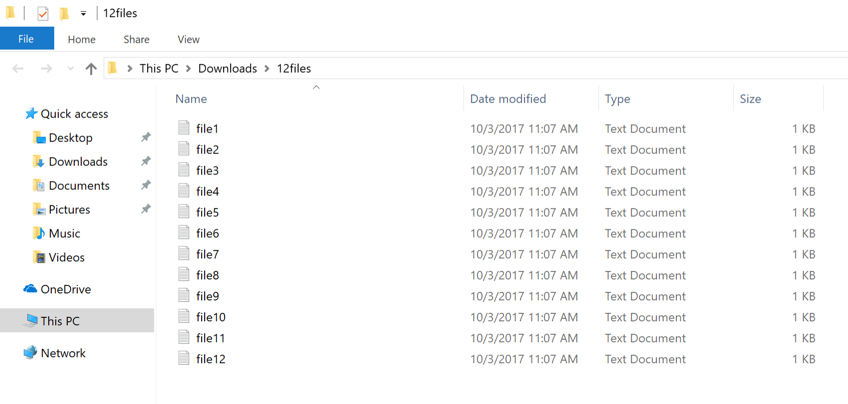
A "12files" window opens, as shown below.
Now events are found, as shown below.
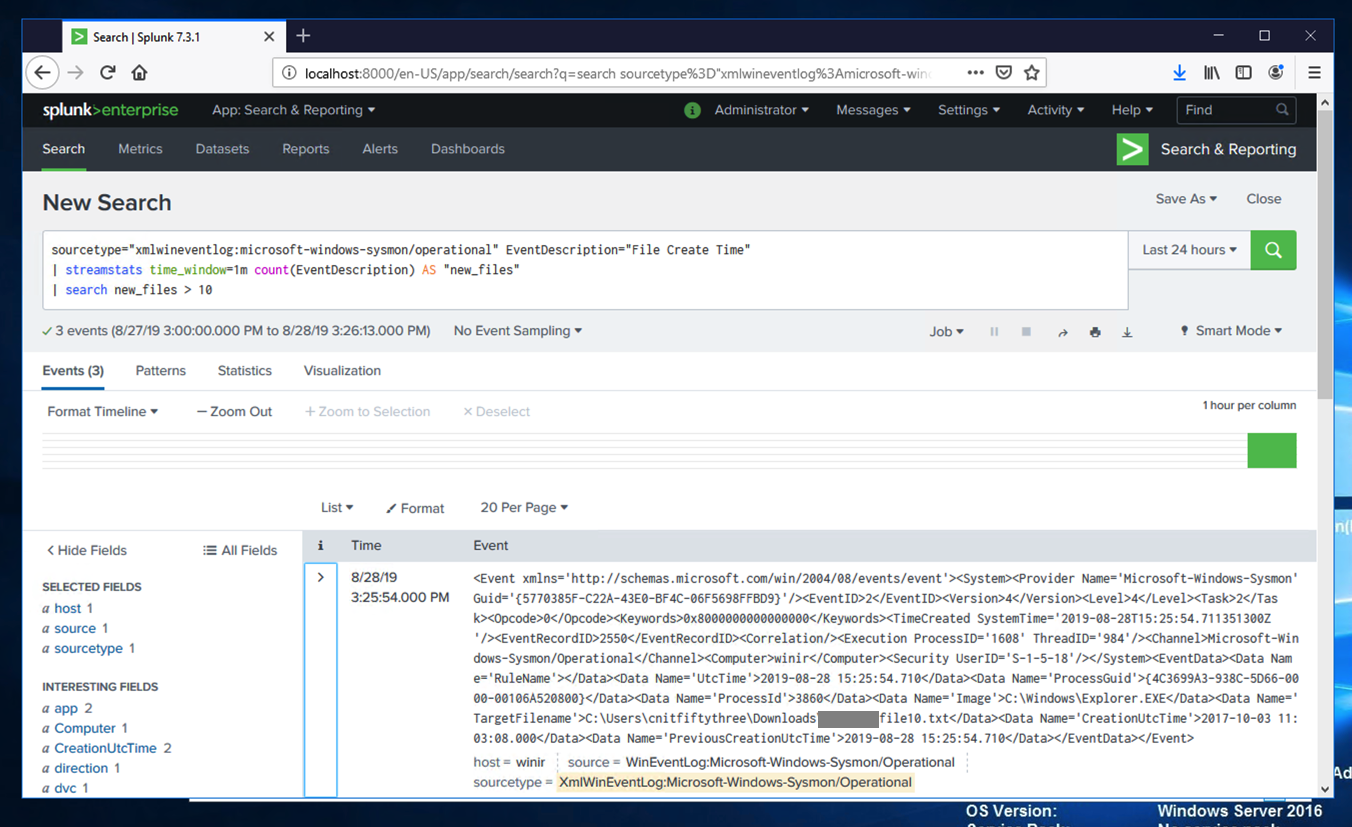
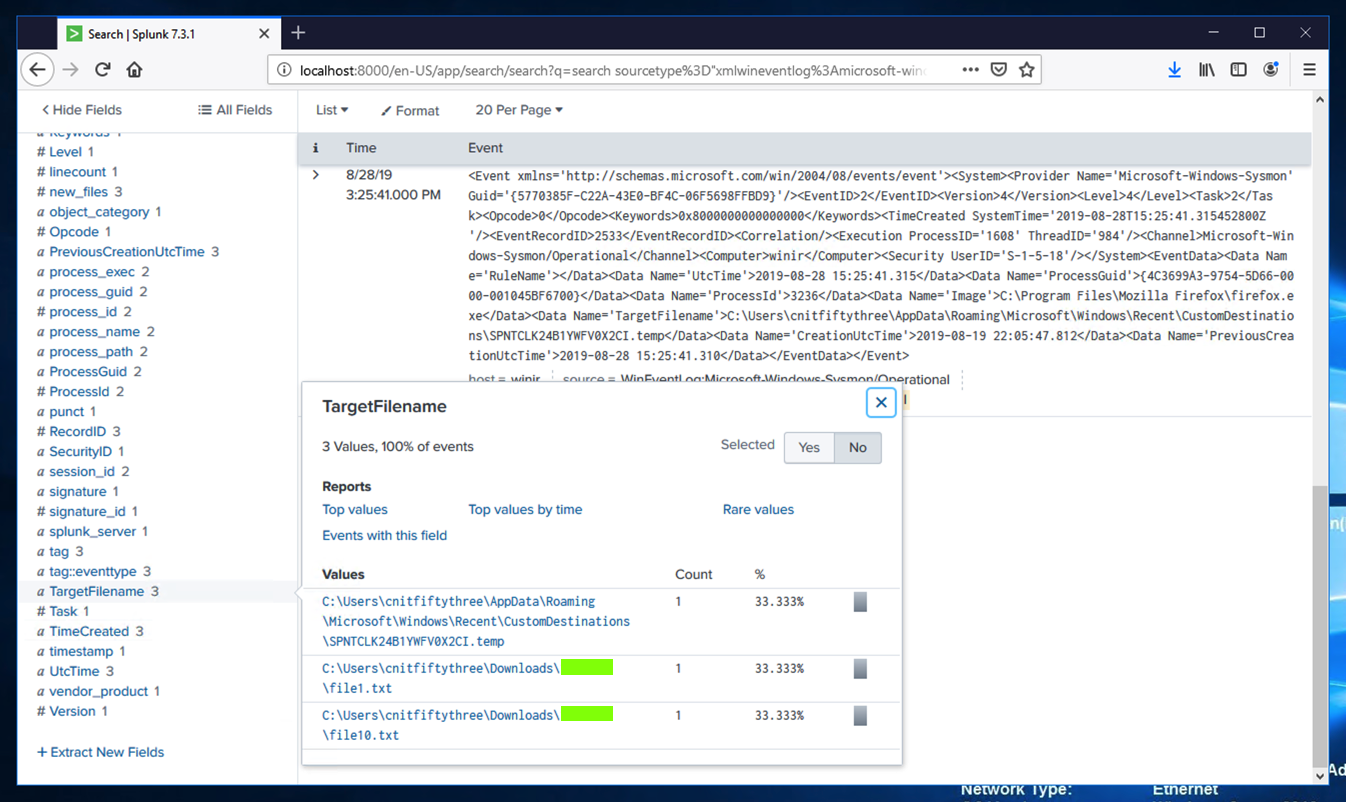
Find the values containing the word "Downloads". The flag value appears in two such values, and is covered by green boxes in the image below.
sourcetype="xmlwineventlog:microsoft-windows-sysmon/operational"
Click the Image field.
A box pops up showing the Top 10 Values, as shown below.
This field contains the full path for the executable that produced the event.
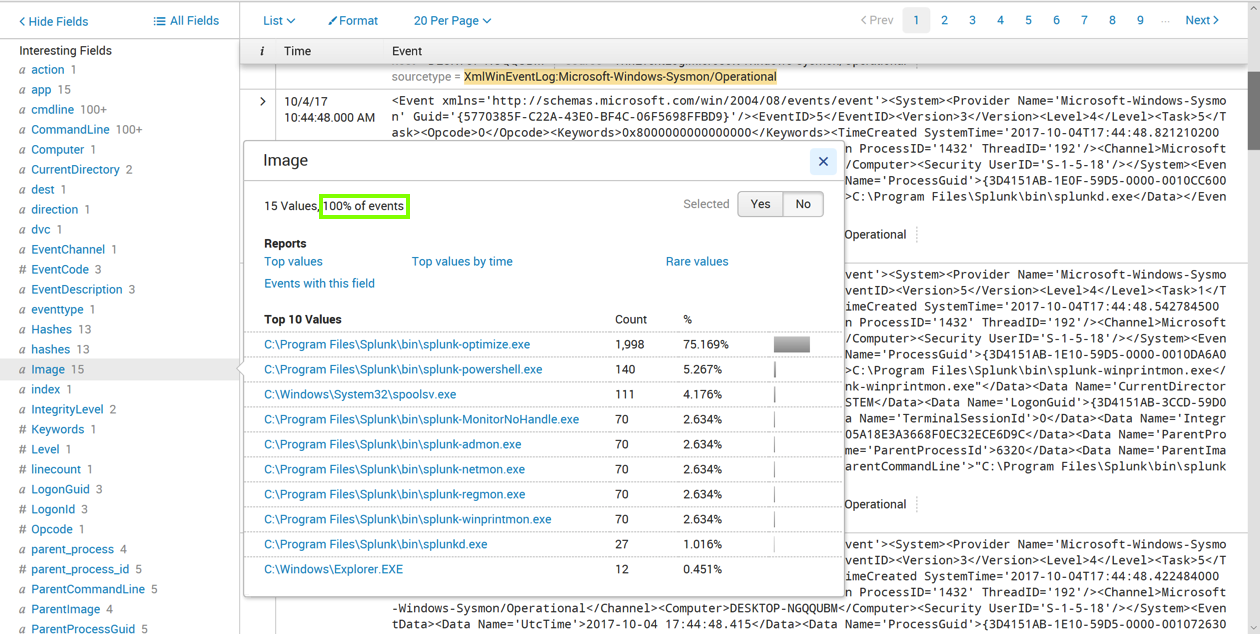
Notice the message outlined in green in the image above, saying "100% of events" (or a number close to 100%). This means that every Sysmon event contains this field.
Click the SHA1 field.
A box pops up showing the Top 10 Values, as shown below.
This field contains the SHA-1 hash for the executable that produced the event.
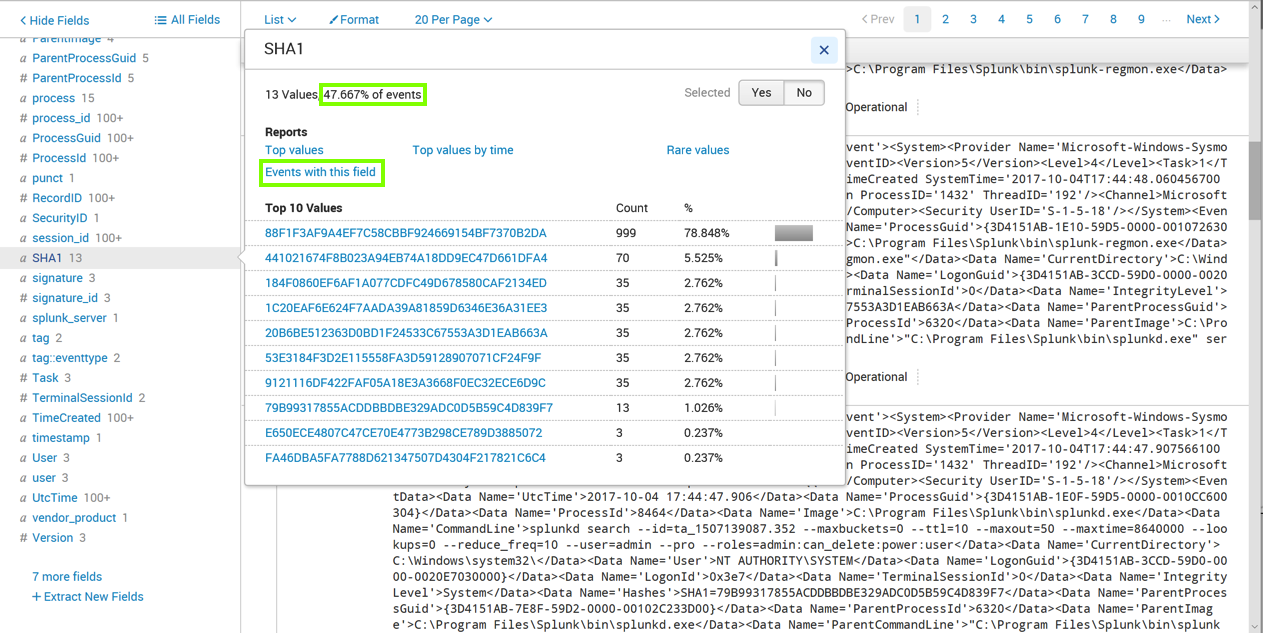
Notice the message outlined in green in the image above. It's less than 100%, because only some Sysmon events contain this field.
In the pop-up box, click "Events with this field", as outlined in green in the image above.
The page refreshes, showing only events containing SHA1, as shown below.
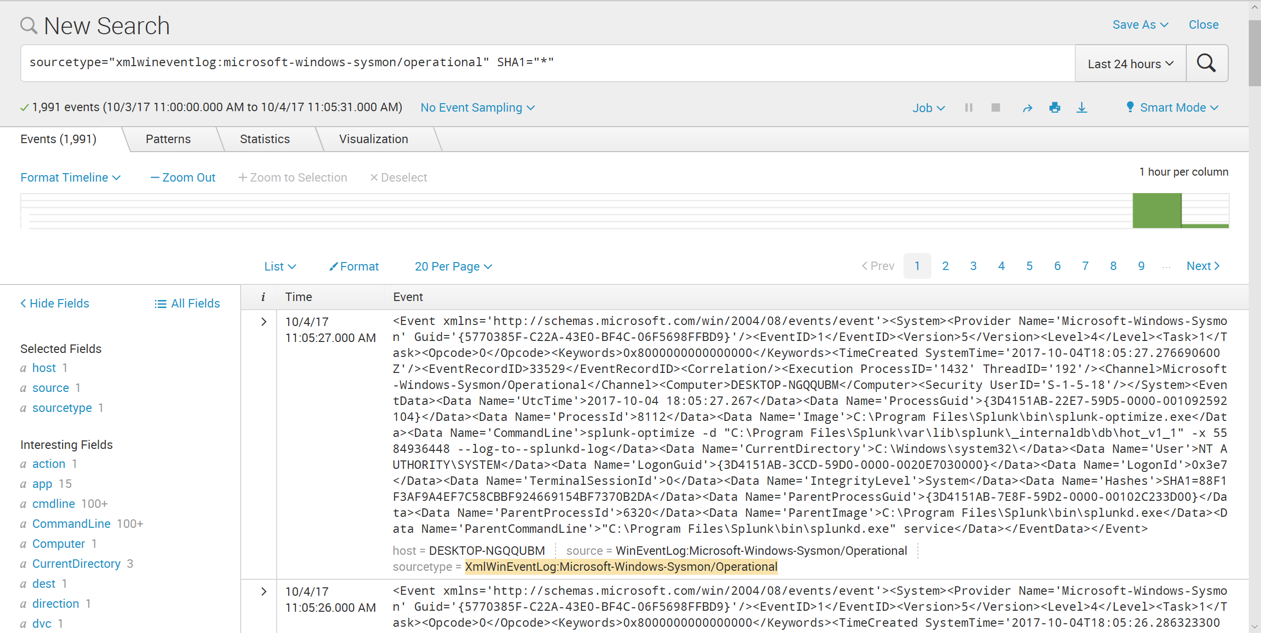
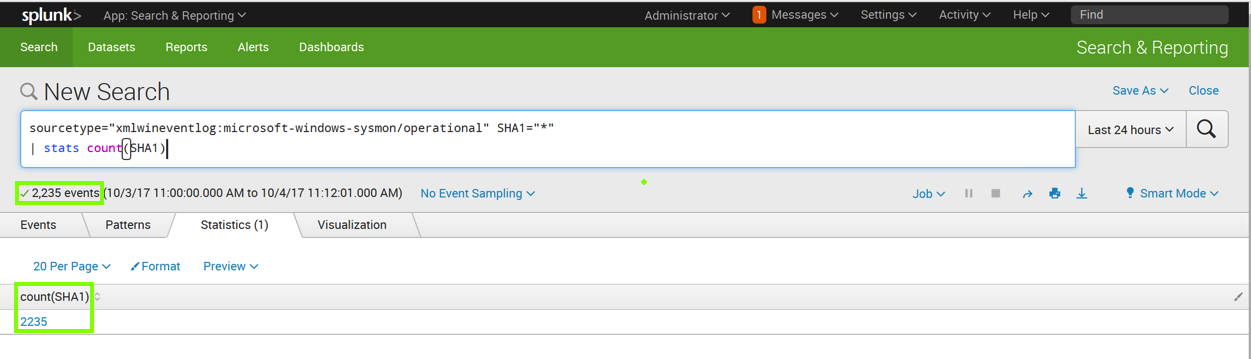
sourcetype="xmlwineventlog:microsoft-windows-sysmon/operational" SHA1="*"
| stats count(SHA1)
This isn't much use.
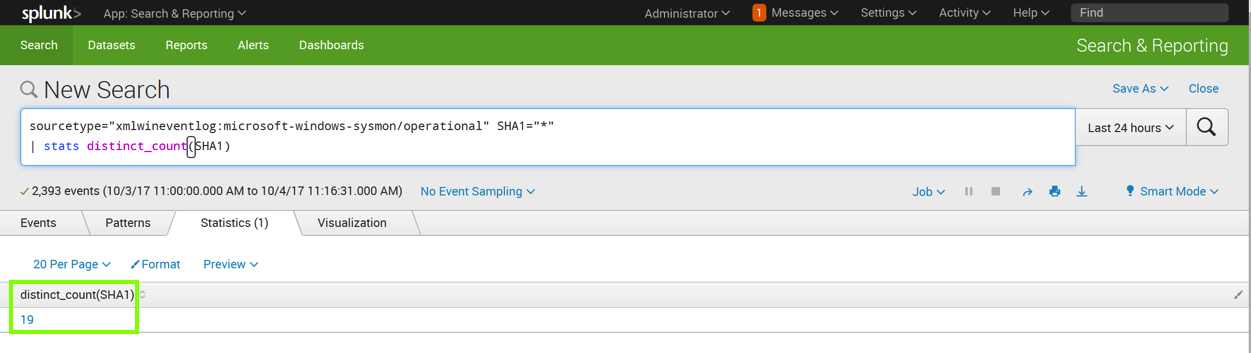
sourcetype="xmlwineventlog:microsoft-windows-sysmon/operational" SHA1="*"
| stats distinct_count(SHA1)
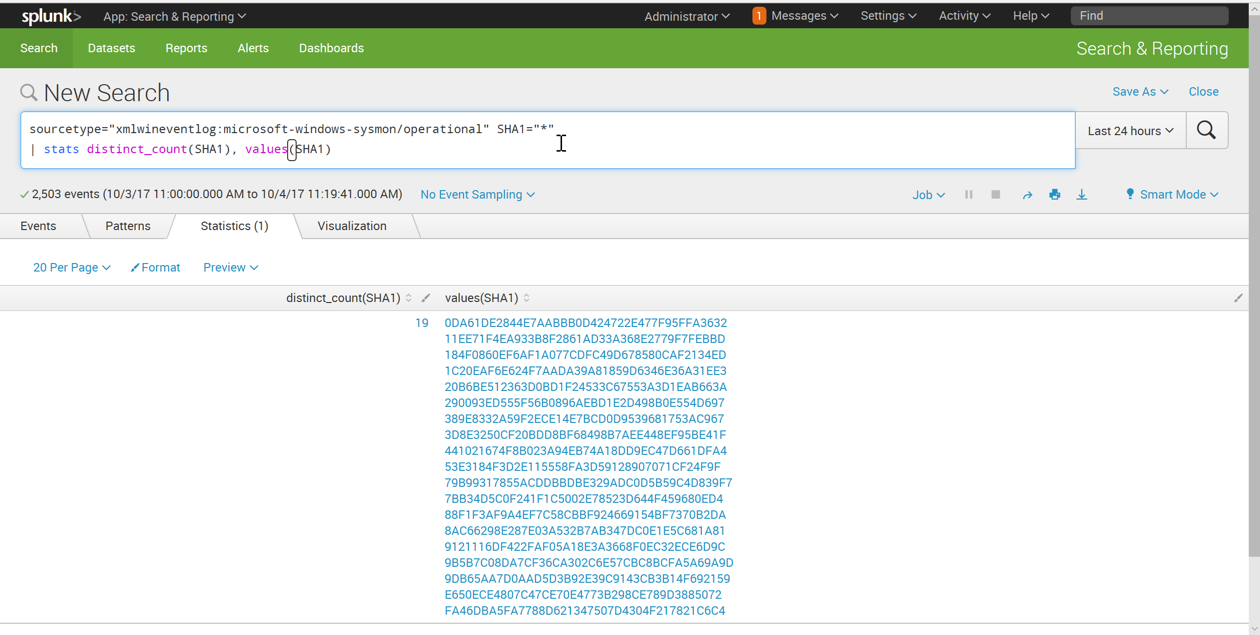
sourcetype="xmlwineventlog:microsoft-windows-sysmon/operational" SHA1="*"
| stats distinct_count(SHA1), values(SHA1)
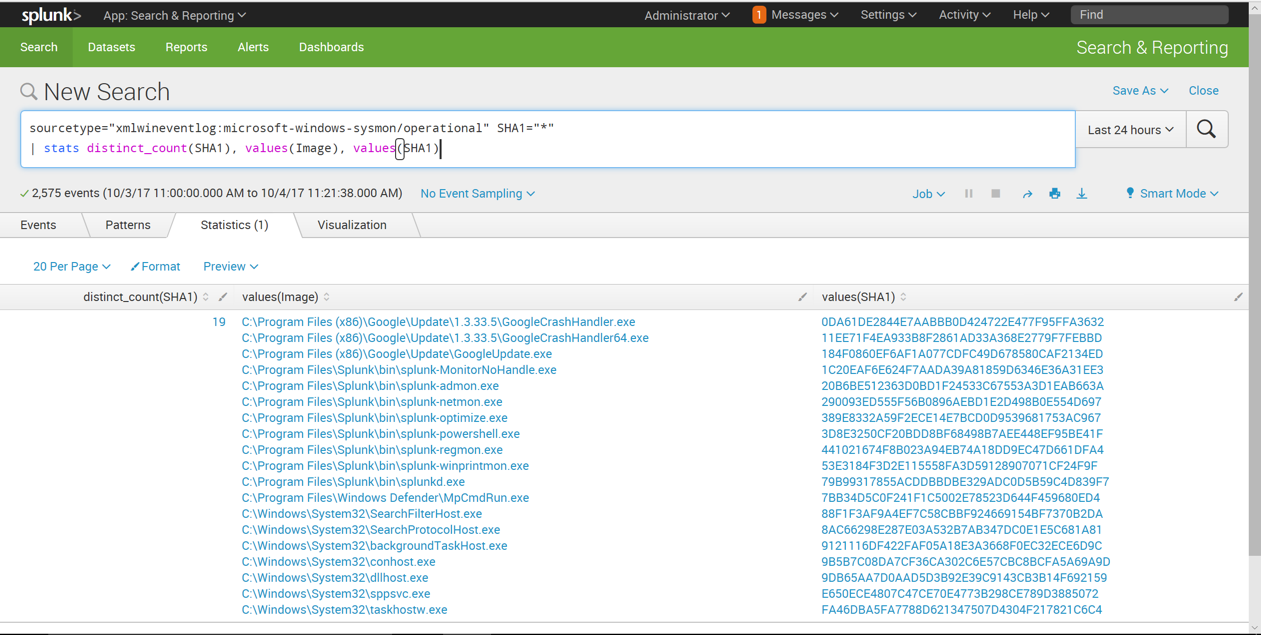
sourcetype="xmlwineventlog:microsoft-windows-sysmon/operational" SHA1="*"
| stats distinct_count(SHA1), values(Image), values(SHA1)
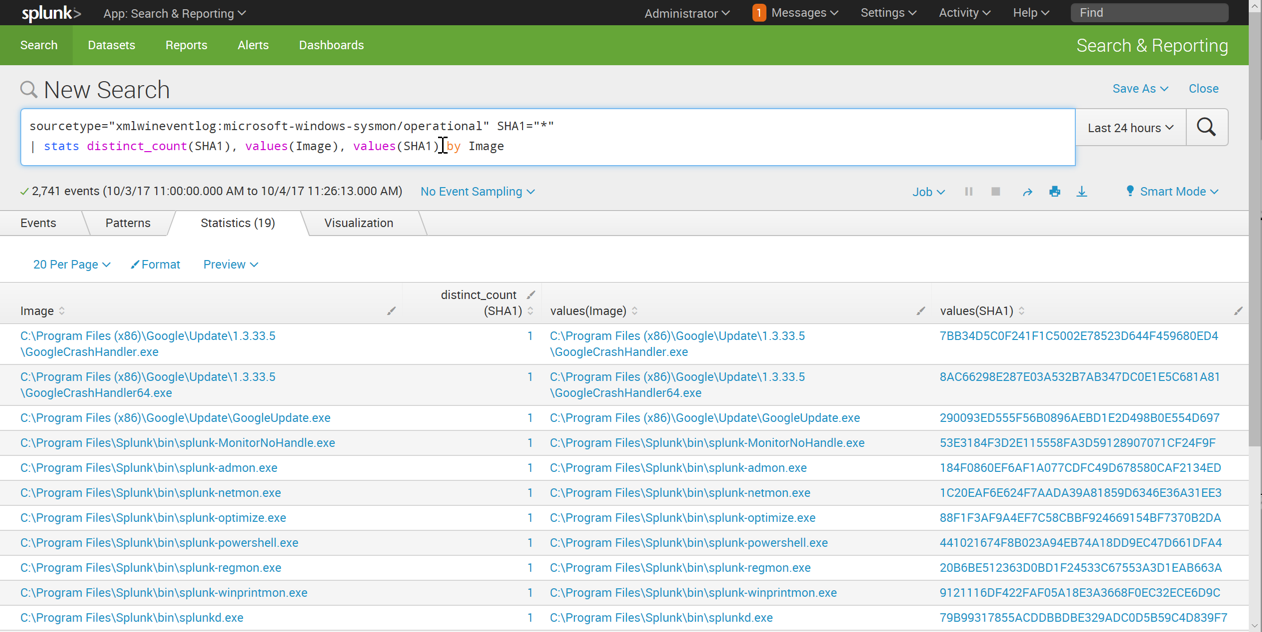
To do that, we need to group the results by Image.
Enter this in the "New Search" field, as shown below. Click the magnifying glass icon on the right side.
sourcetype="xmlwineventlog:microsoft-windows-sysmon/operational" SHA1="*"
| stats distinct_count(SHA1), values(Image), values(SHA1) by Image
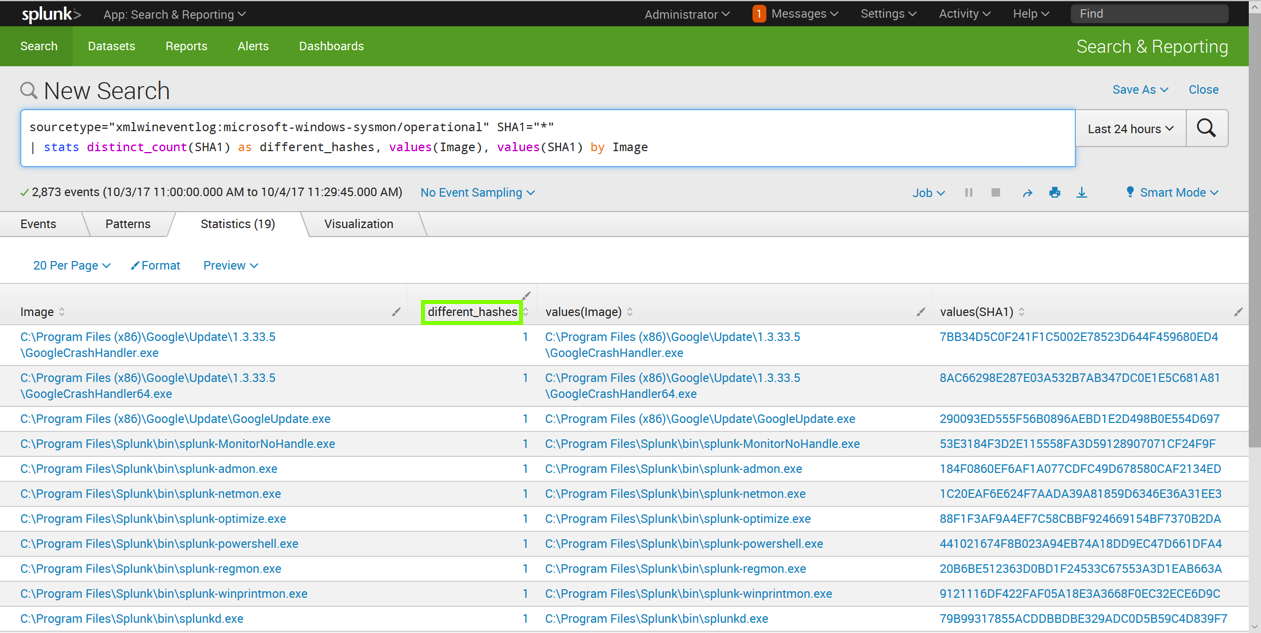
Enter this in the "New Search" field, as shown below. Click the magnifying glass icon on the right side.
sourcetype="xmlwineventlog:microsoft-windows-sysmon/operational" SHA1="*"
| stats distinct_count(SHA1) as different_hashes, values(Image), values(SHA1) by Image
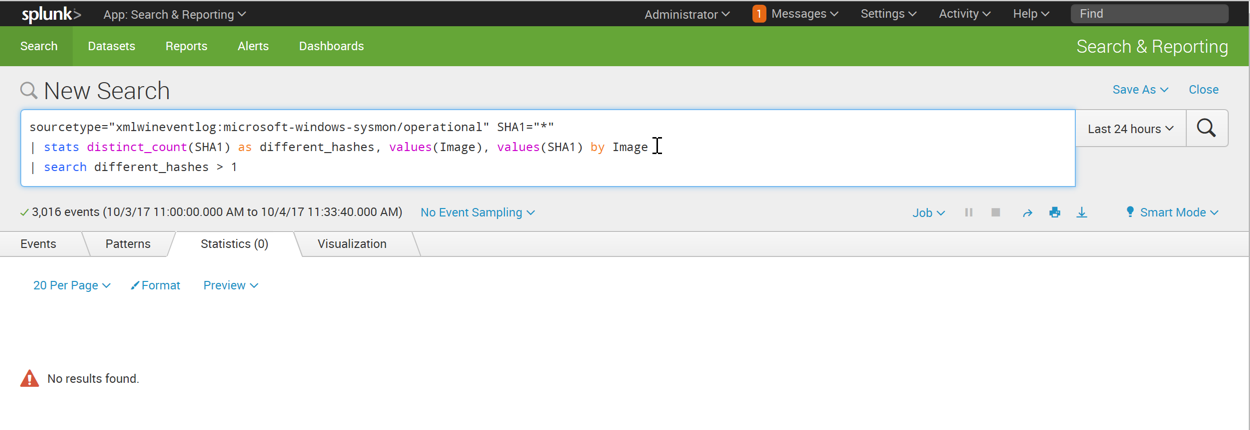
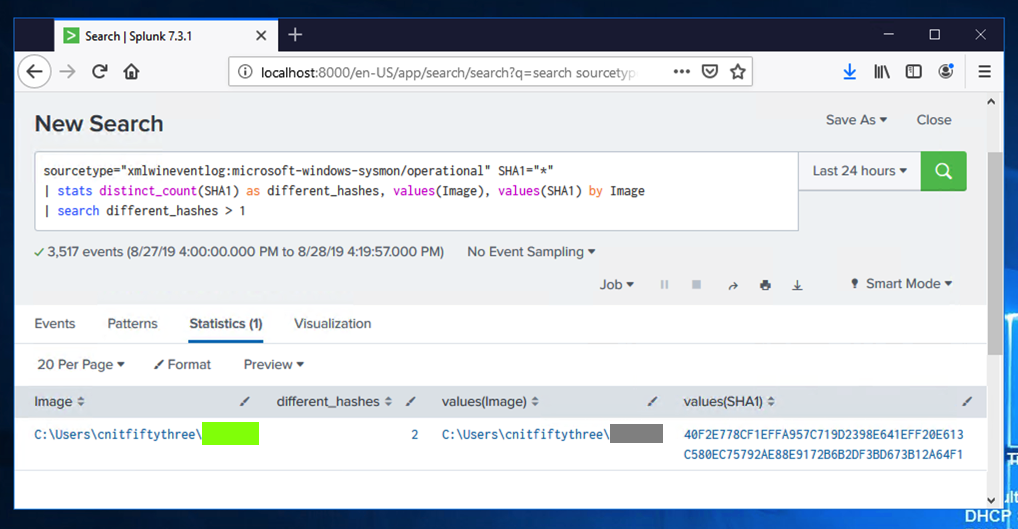
Enter this in the "New Search" field, as shown below. Click the magnifying glass icon on the right side.
sourcetype="xmlwineventlog:microsoft-windows-sysmon/operational" SHA1="*"
| stats distinct_count(SHA1) as different_hashes, values(Image), values(SHA1) by Image
| search different_hashes > 1
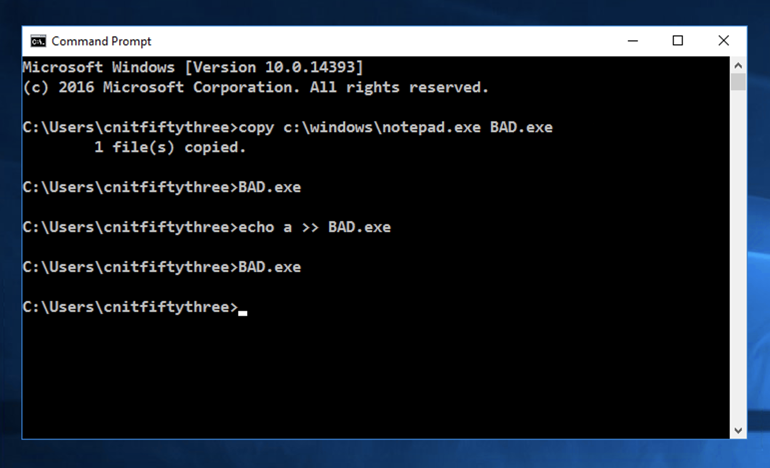
Execute the command below, one at a time. Don't copy and paste them all at once or they will fail.
These, replacing YOURNAME with your own name (without any spaces), as shown below.
These commands copy cmd.exe to your home folder, run it, modify it by adding an "a" to the end, and run it again.
copy c:\windows\notepad.exe BAD.exe

BAD.exe

echo a >> BAD.exe

BAD.exe
Splunk identifies the file that was modified. The flag is the filename, covered by a green box in the image shown below.
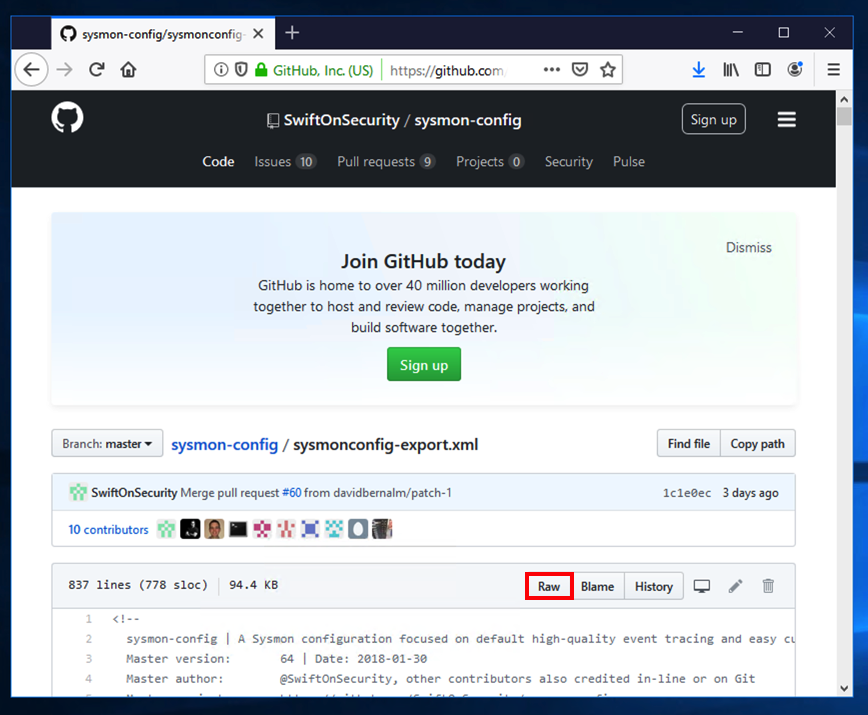
On your Windows machine, in a Web browser, open this page:
https://github.com/SwiftOnSecurity/sysmon-config/blob/master/sysmonconfig-export.xml
Right-click the Raw button, as shown below, and click "Save Target As..." or "Save Link As..." Save the sysmonconfig-export.xml file in your Downloads folder.
In the User Account Control box, click Yes.
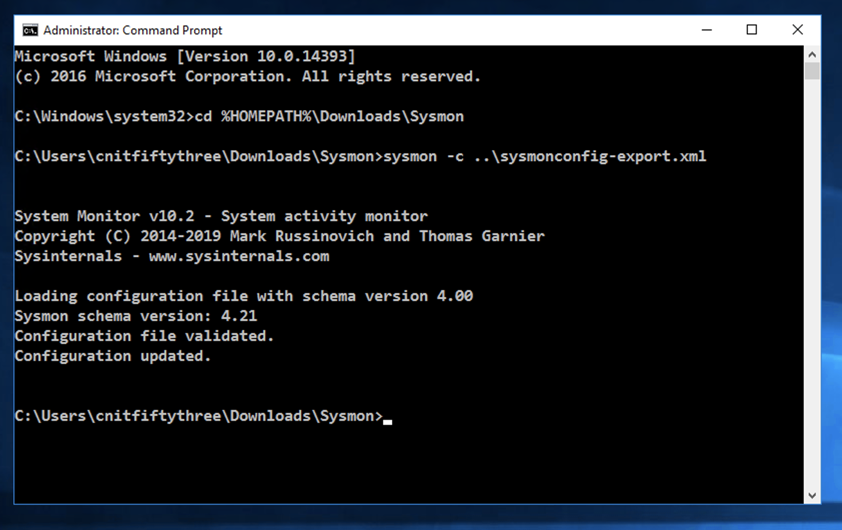
In the Command Prompt window, execute these commands:
cd %HOMEPATH%\Downloads\Sysmon
sysmon -c ..\sysmonconfig-export.xml
In the search results, click regedit. In the User Account Control box, click Yes.
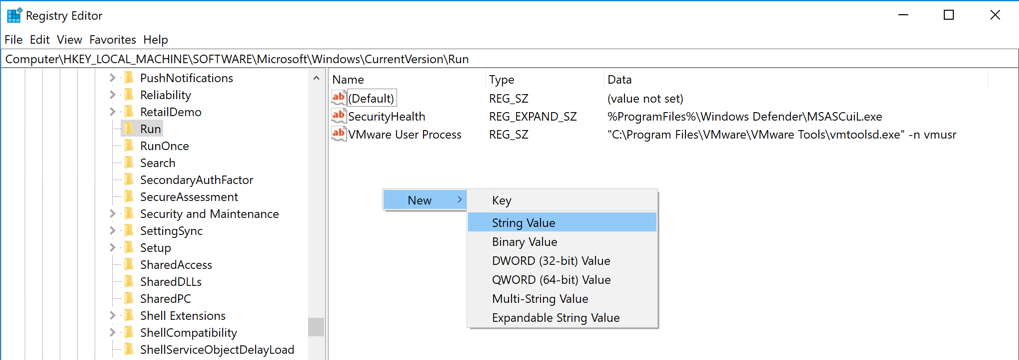
In Registry Editor, in the left pane, navigate to this key, as shown below.
HKEY_LOCAL_MACHINE\Software\Microsoft\Windows\CurrentVersion\Run
In the right pane, right-click an empty space and click New, "String Value", as shown below.
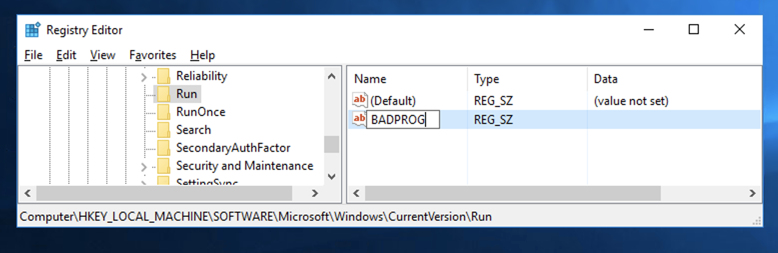
A new value appears, with its name highlighted. Type over the name, entering BADPROG as shown below.
Press Enter.
Close Regedit.
sourcetype="xmlwineventlog:microsoft-windows-sysmon/operational"
Click EventDescription, as outlined in green in the image below.
Notice the two events recording Registry actions. We want to search for them.
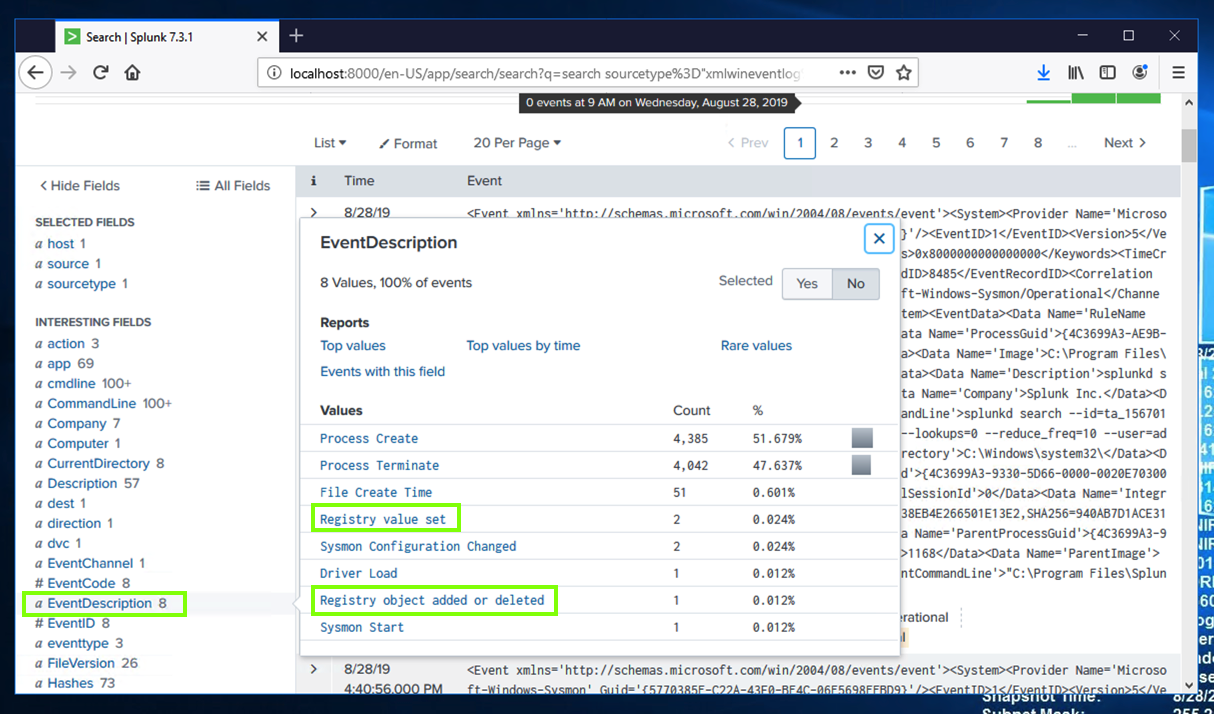
Click "Registry object added or deleted", as outlined in green in the image above.
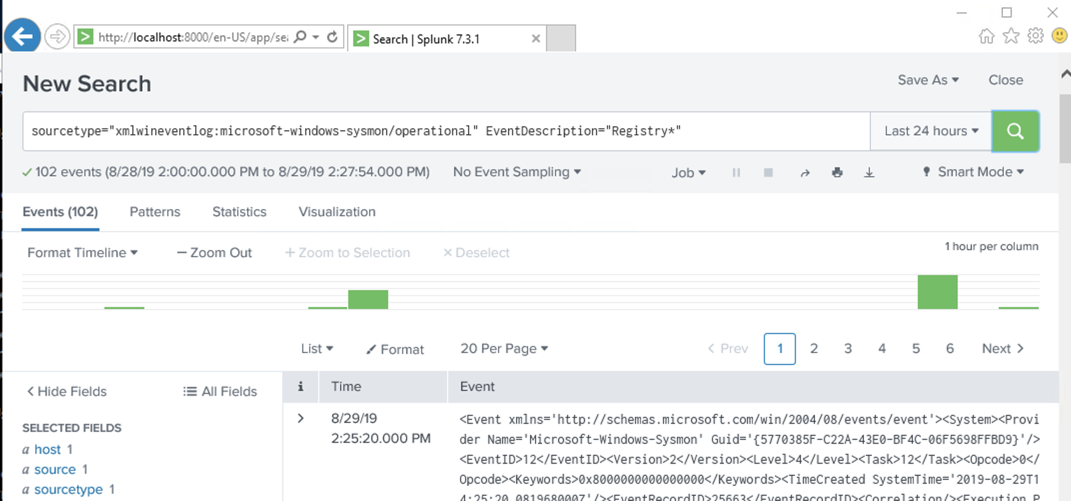
The Search page refreshes. Now the query is more specific, finding only events with that EventDescription, as shown below.
In the search query, remove all the text after "Registry" and replace it with a *, as shown below. Click the magnifying glass icon on the right side.
More events are found now.
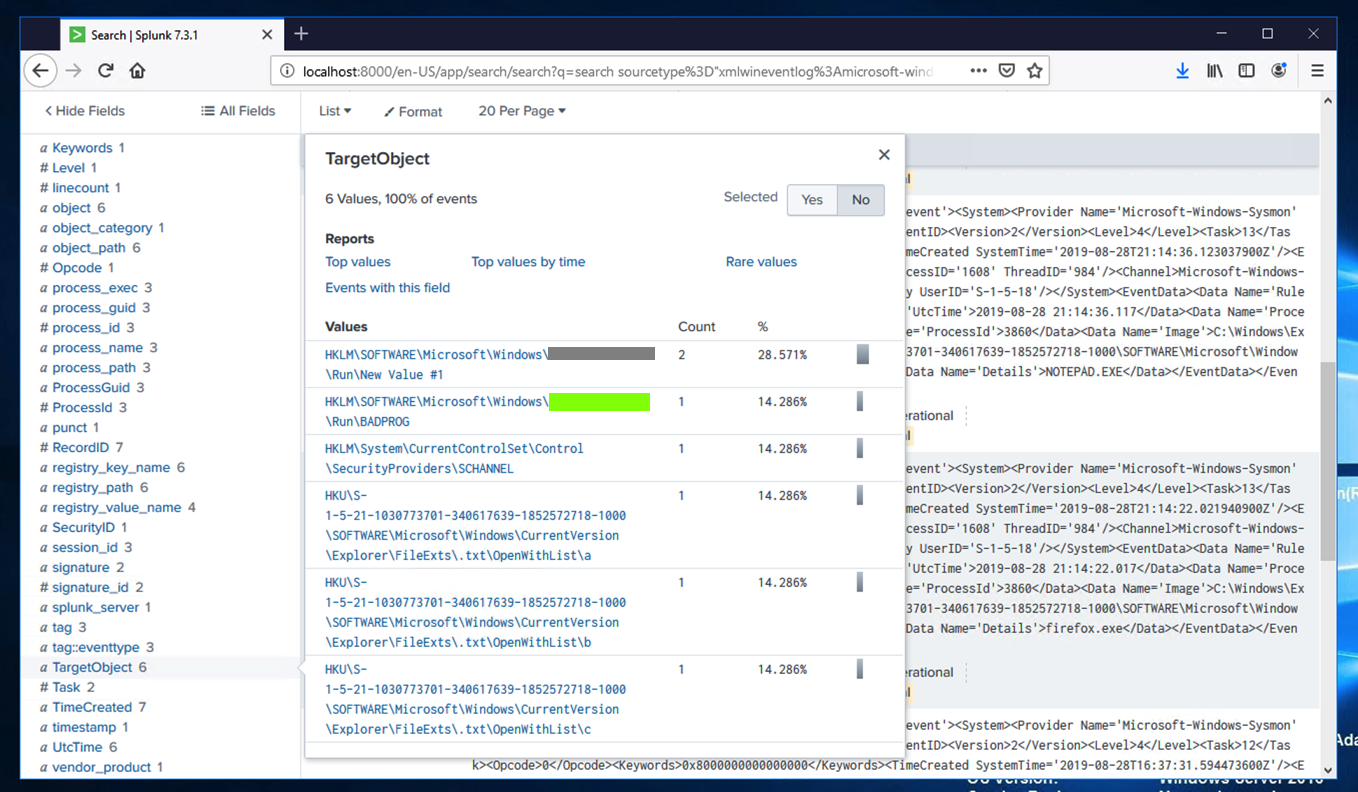
Click TargetObject.
A "TargetObject" box pops up, showing the values.
Notice the two events recording Registry Run key actions. One of them is the suspicious item named "BADPROG".
The flag is the portion of the Run key path covered by a green box in the image below
https://samsclass.info/50/proj/IR302.zipSave the IR302.zip file in your Downloads folder and unzip it there.
Then, in an Administrator Command Prompt, execute this command:
PowerShell Expand-Archive -Path %HOMEPATH%\Downloads\IR302.zip -DestinationPath c:/Program` Files/Splunk/var/lib/splunk
cd "c:\Program Files\Splunk\etc\system\local"
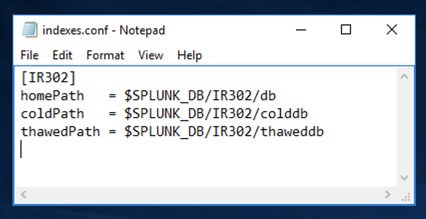
notepad indexes.conf
In Notepad, enter this text, as shown below:
[IR302]
homePath   = $SPLUNK_DB/IR302/db
coldPath   = $SPLUNK_DB/IR302/colddb
thawedPath = $SPLUNK_DB/IR302/thaweddb
Save the Notepad file. Close Notepad.
Click the green "Restart Splunk" button.
Click OK.
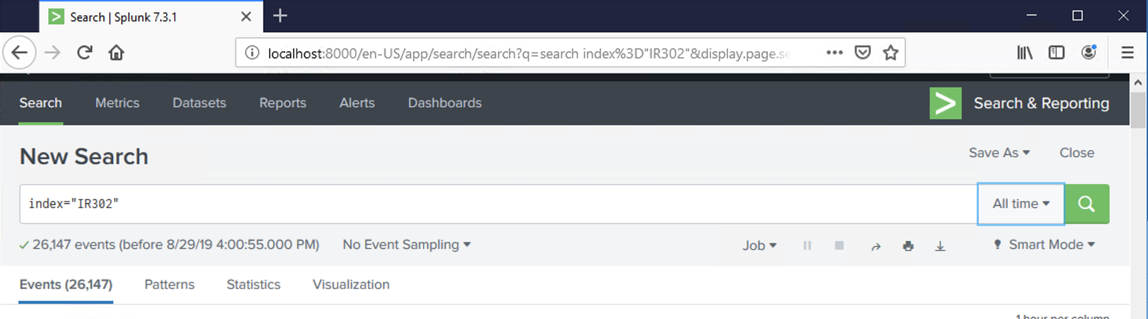
When Splunk restarts, search for these events, over "All time":
index="IR302"
Search those events and find these flags:
Tip: if you don't find two SHA1 values, try SHA256 values.
Hint: add "Run" to the query to exclude irrelevant events.
Clearing Splunk Data
Students don't need to do this. I only put it here so instructors who want to prepare future Splunk projects, including me, can find it.Clearing Splunk Data
In an Administrator Command Prompt, execute these commands:Leave the Administrator Command Prompt window open.Clearing Windows Event Logs
In an Administrator PowerShell Prompt, execute this command:You see several messages like this: "wevtutil : Failed to clear log Microsoft-Windows-LiveId/Analytic. Access is denied." Just ignore them.wevtutil el | Foreach-Object {wevtutil cl "$_"}Restarting Splunk
In the Administrator Command Prompt, execute this command: