Download and install Firefox.
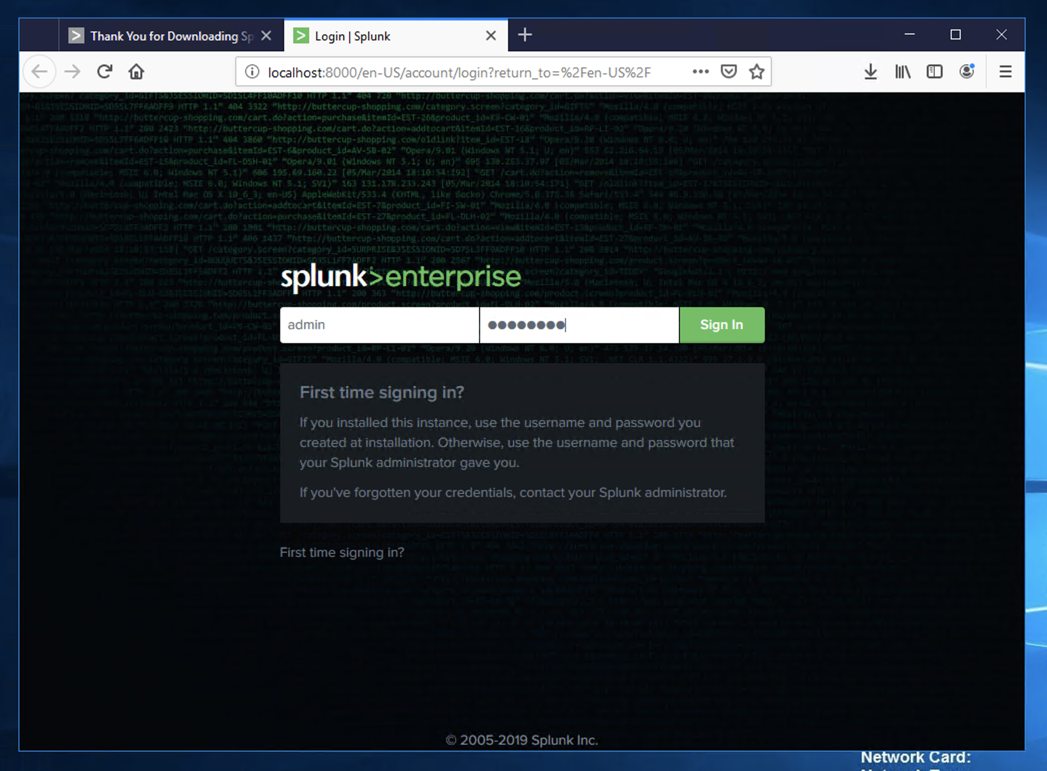
During the installation, you will be prompted to select a username and password, as shown below.
Use these values:
Log in with the username and password you chose during installation.
A box pops up asking you to help make Splunk better. Close it to show the "Explore Splunk Enterprise" page, as shown below.
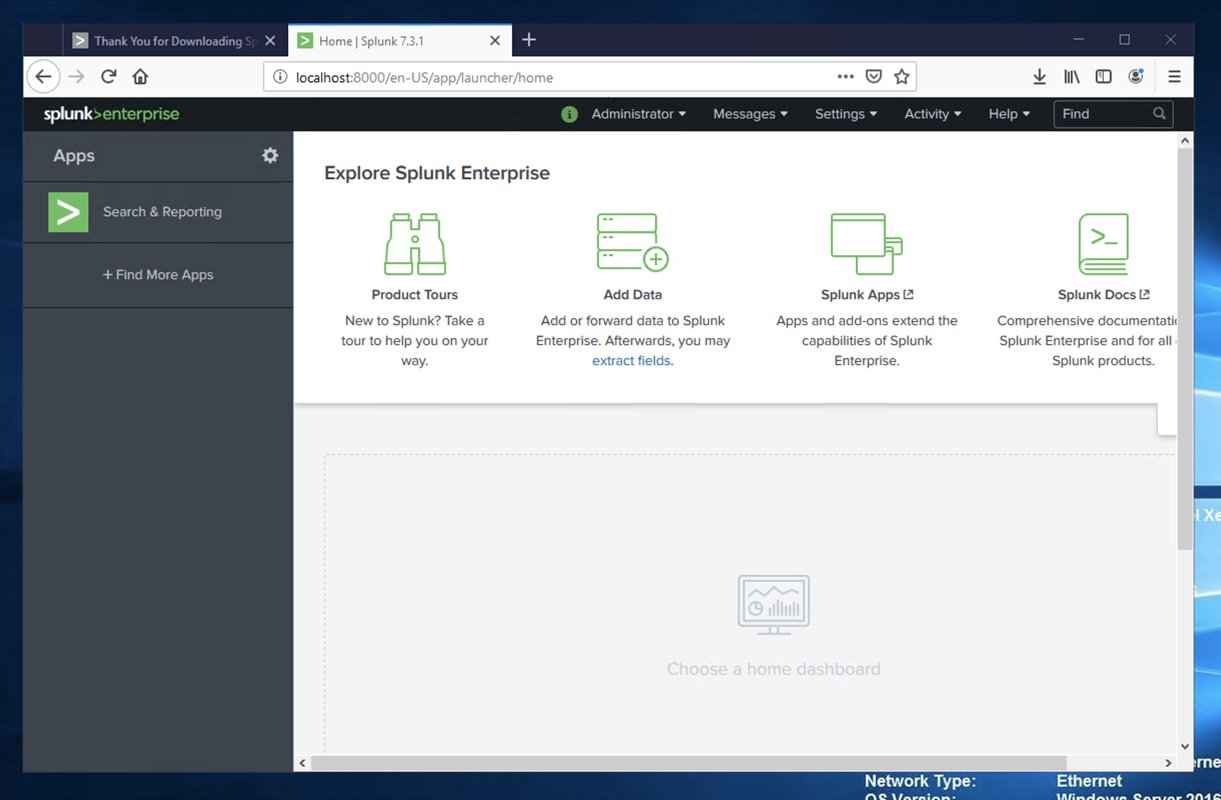
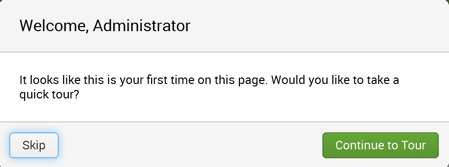
If a box pops up offering you a tour, click Skip.
The "Add data" page opens, as shown below.
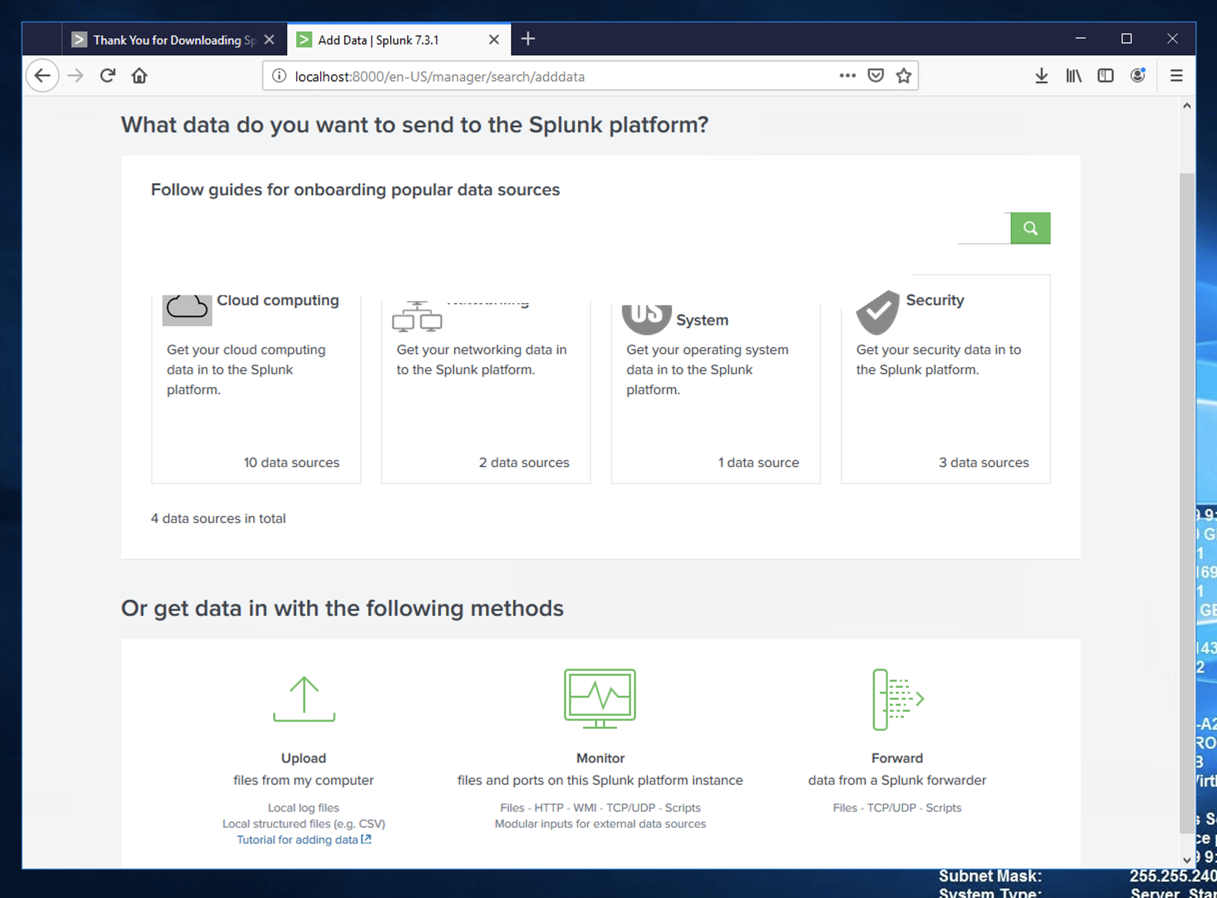
In the bottom center, click Monitor.
If a "Help us improve Splunk software" box pops up, click Skip.
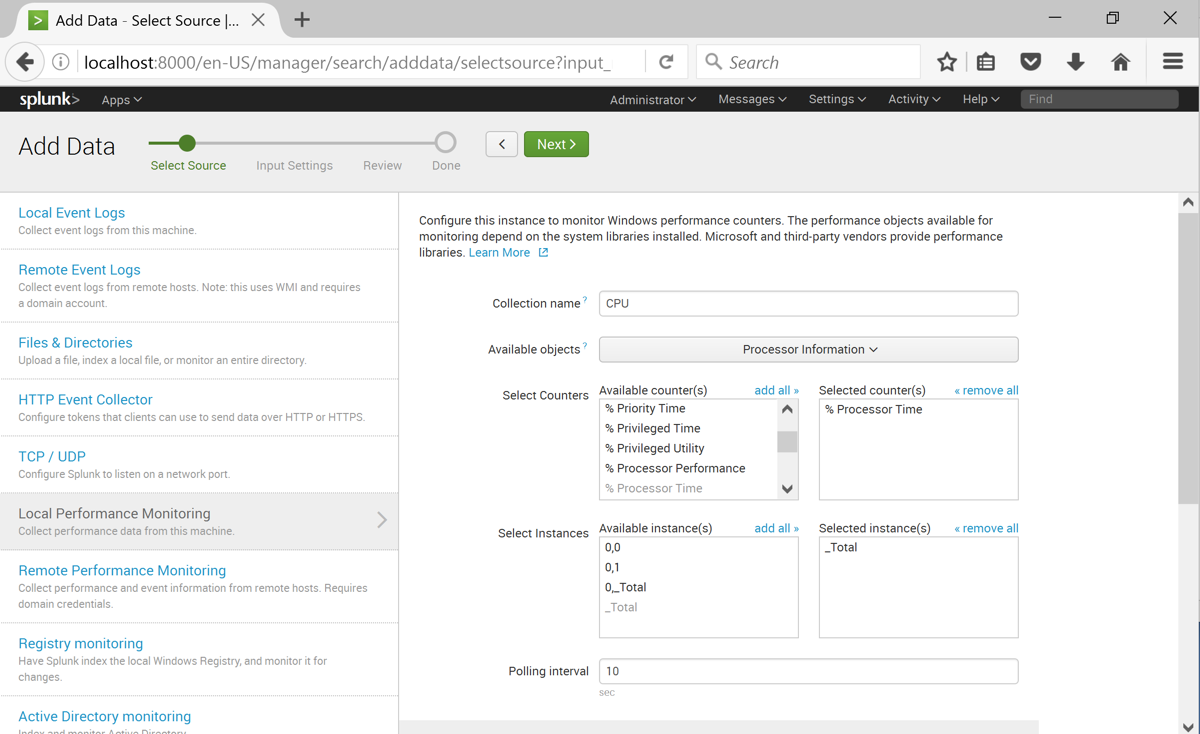
On the left side, click "Local Performance Monitoring".
In the right pane of the page, make these selections, as shown below:
At the top of the page, click the green Next button.
At the top of the page, click the green Review button.
At the top of the page, click the green Submit button.
A page appears saying "Local performance monitoring input has been created successfully" as shown below.
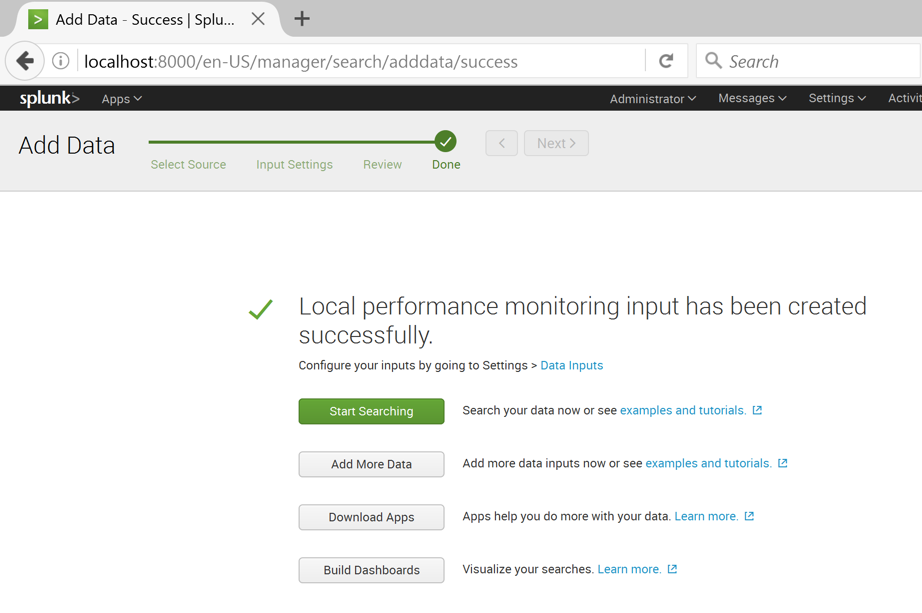
Click "Add more data".
Click Monitor.
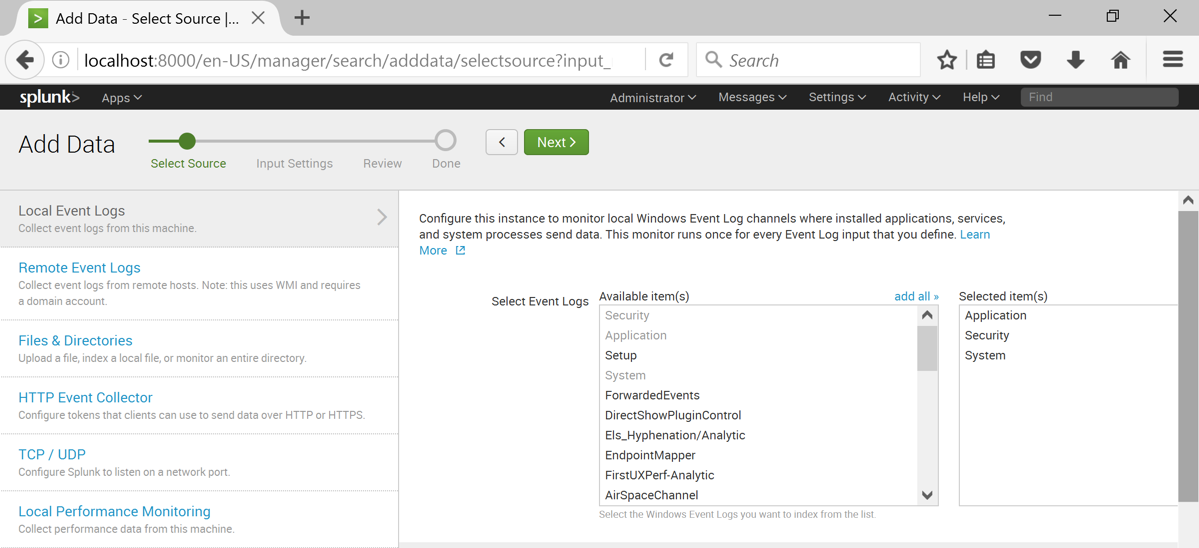
On the left side, click "Local Event Logs".
In the right pane, select these three logs, as shown below:
At the top of the page, click the green Next button.
At the top of the page, click the green Review button.
At the top of the page, click the green Submit button.
A box appears, offering you a tour, as shown below. Click Skip.
Click the green magnifying-glass icon on the top right.
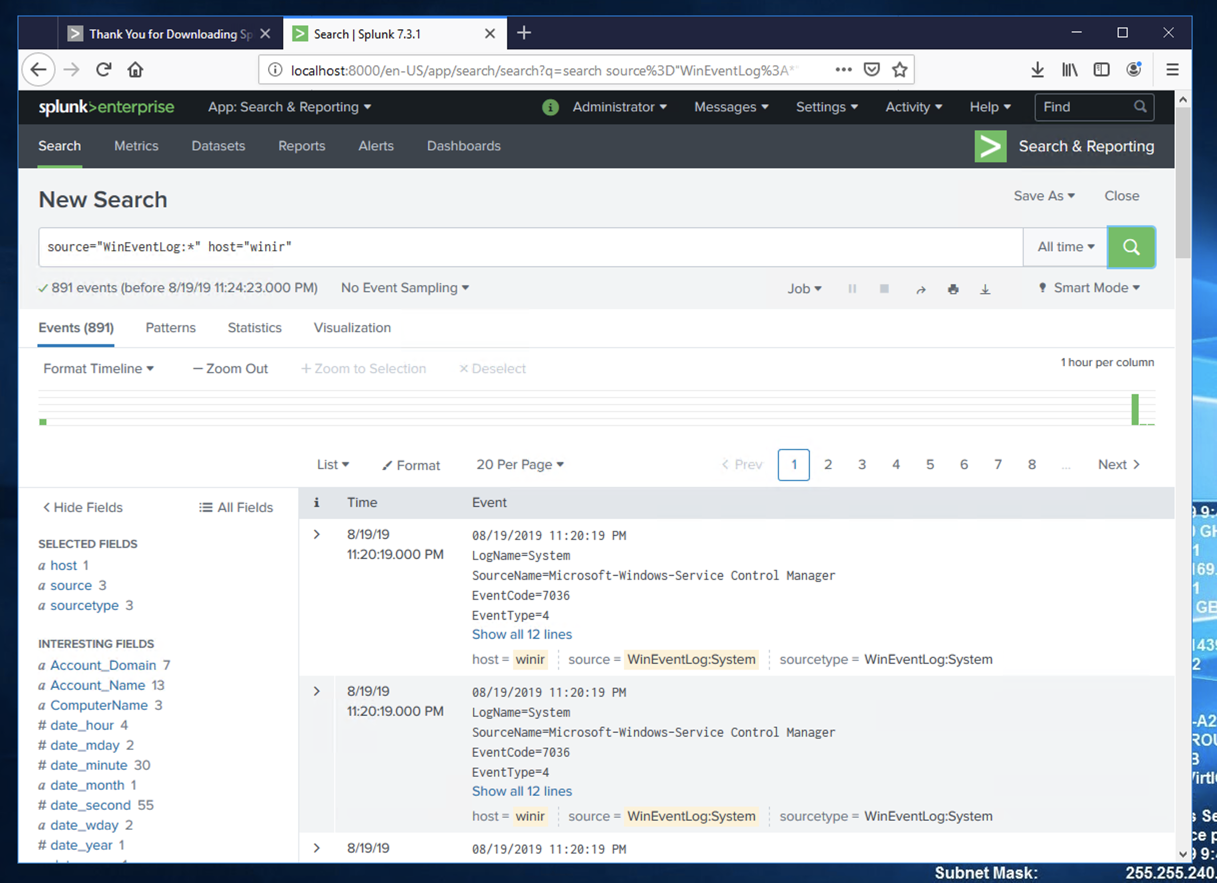
Splunk shows some log entries from your system, as shown below.
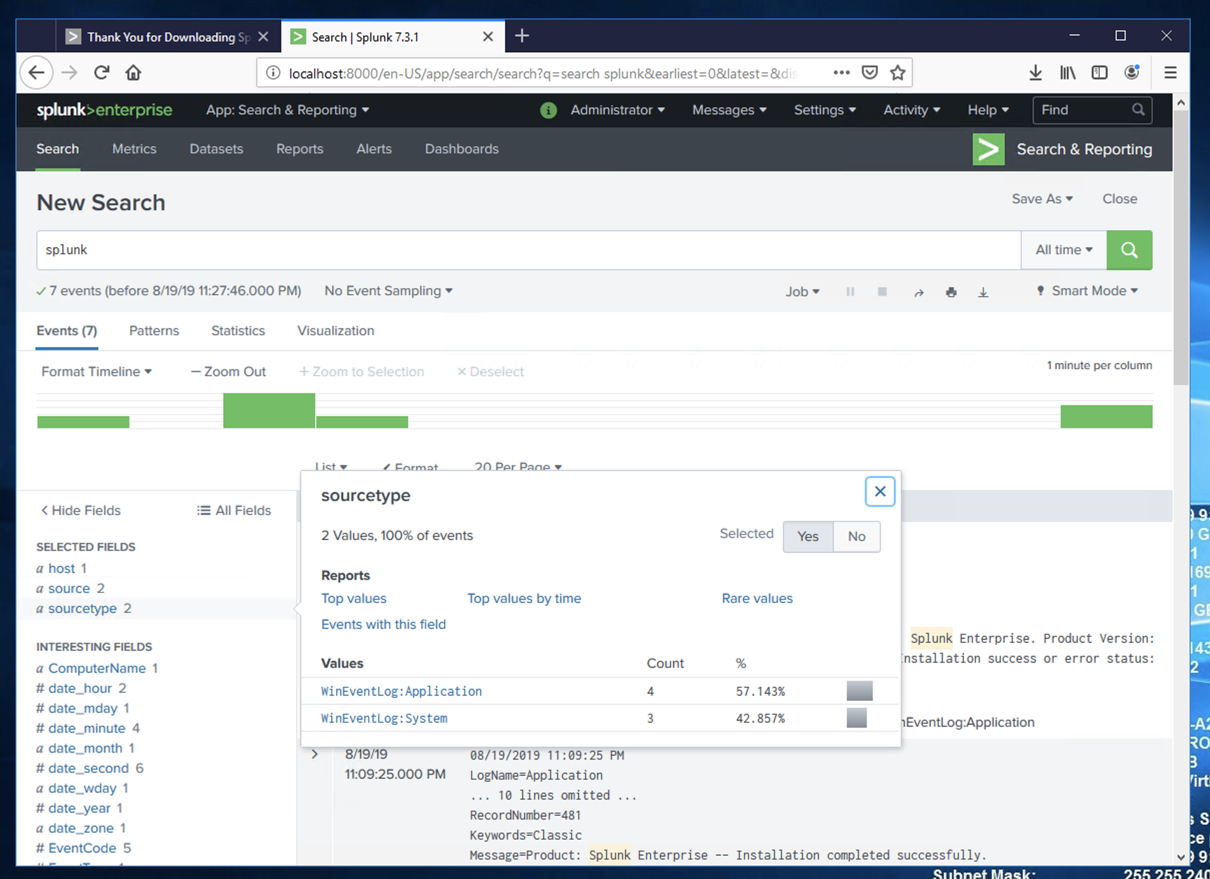
In the "New Search" page, enter a search string of splunk as shown below.
At the top right, click the magnifying glass to perform the search.
Events about splunk appear, as shown below.
On the left side, in the "SELECTED FIELDS" list, click sourcetype.
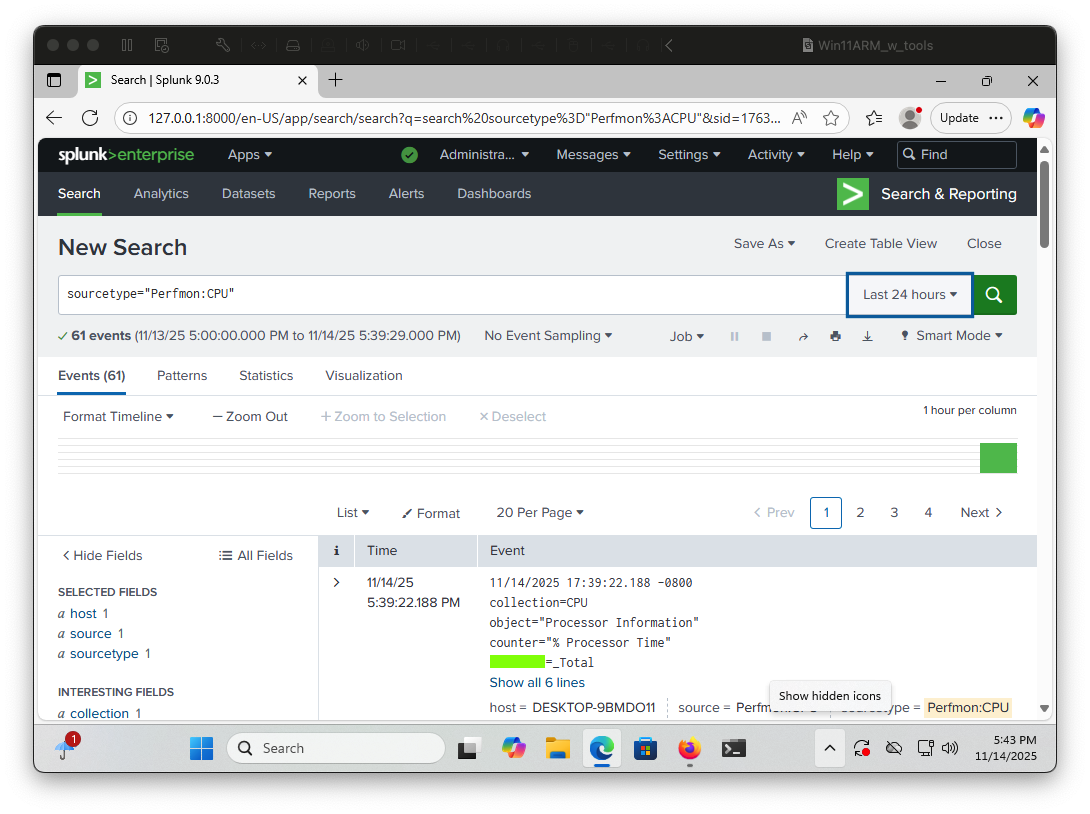
Flag IR 301.1: First Event (15 pts)
In the Search bar, enter:sourcetype="Perfmon:CPU"The flag is covered by a green rectangle in the image below.