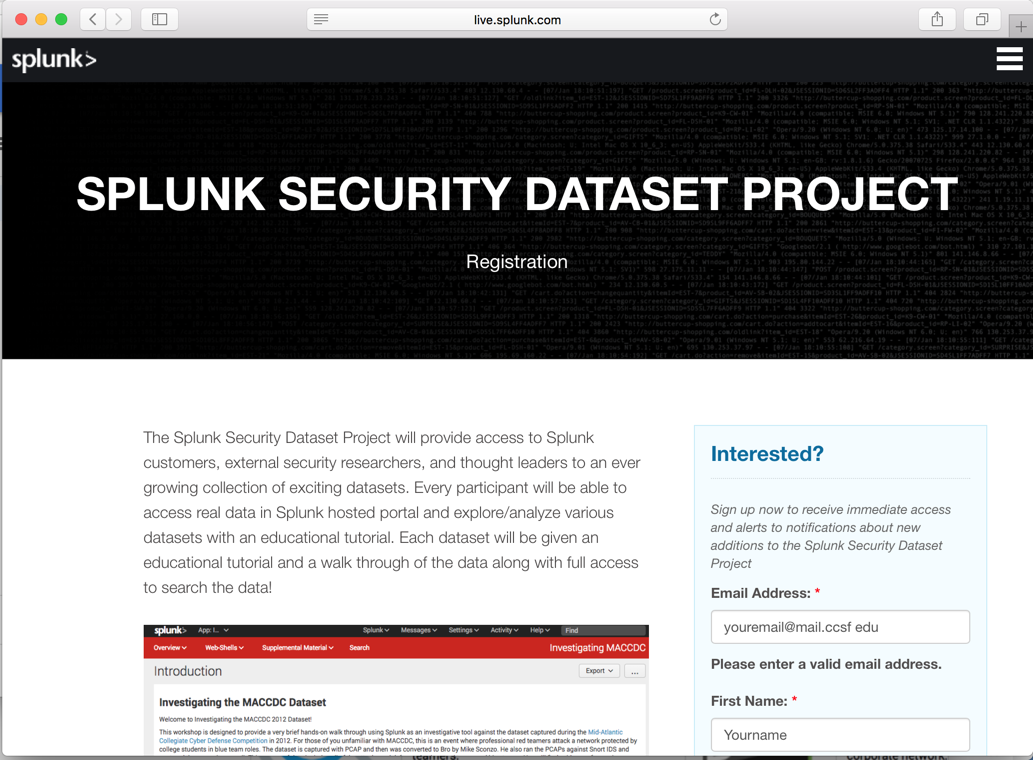
http://live.splunk.com/splunk-security-dataset-project
Fill in the form on the right side, as shown below.
Click the green Submit button.
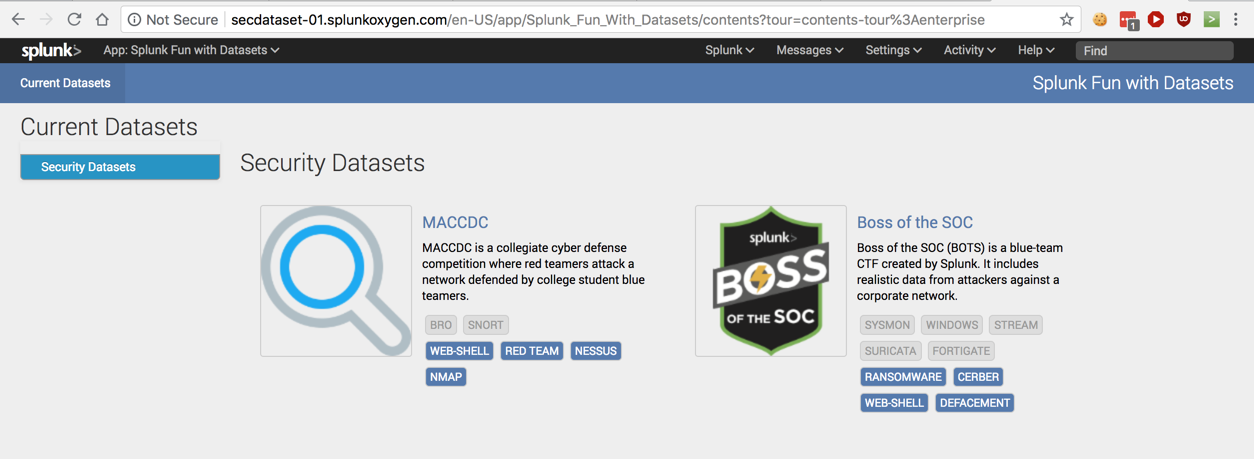
On the right side, click "BOSS OF THE SOC", as shown below.
Go through the tour.
At the bottom of the next page check the three boxes labelled "Lab info", "Data Summary", and "Supporting Apps", as shown below.
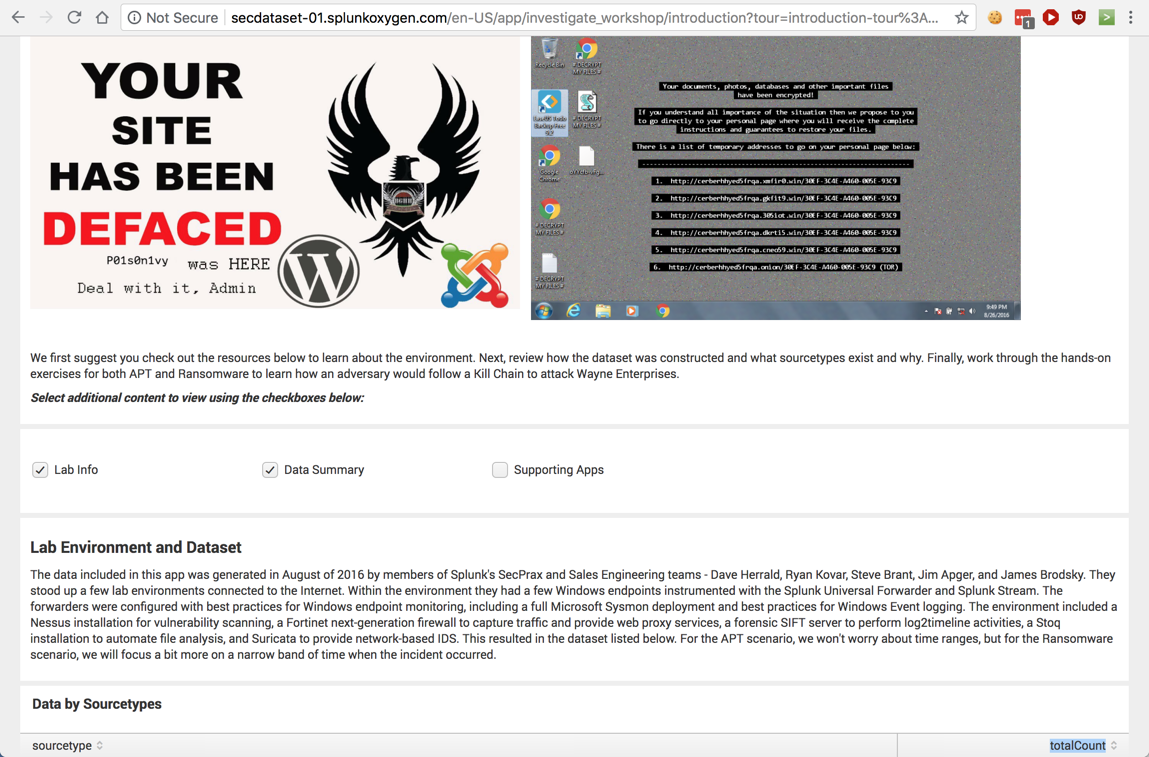
Read through the descriptions.
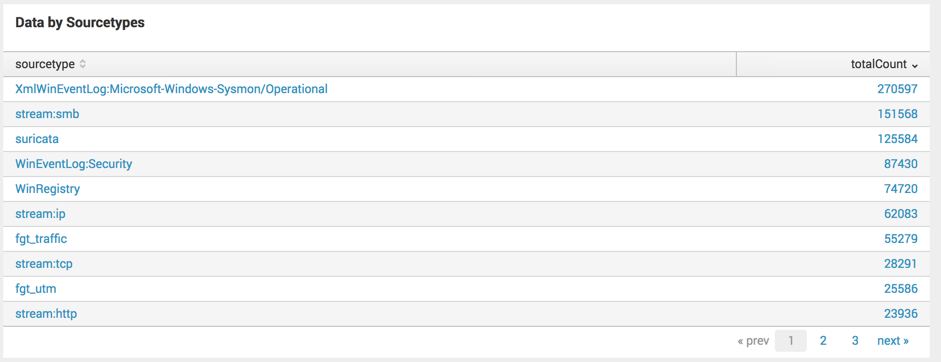
The data includes events from various sources, including these:
At the bottom of the page, in the "Navigation"section, click "Next: Reviewing All Data Available".
At the bottom of the next page, in the "Choose a Scenario" section, click "APT Scenario".
Read through the scenario, as shown below.
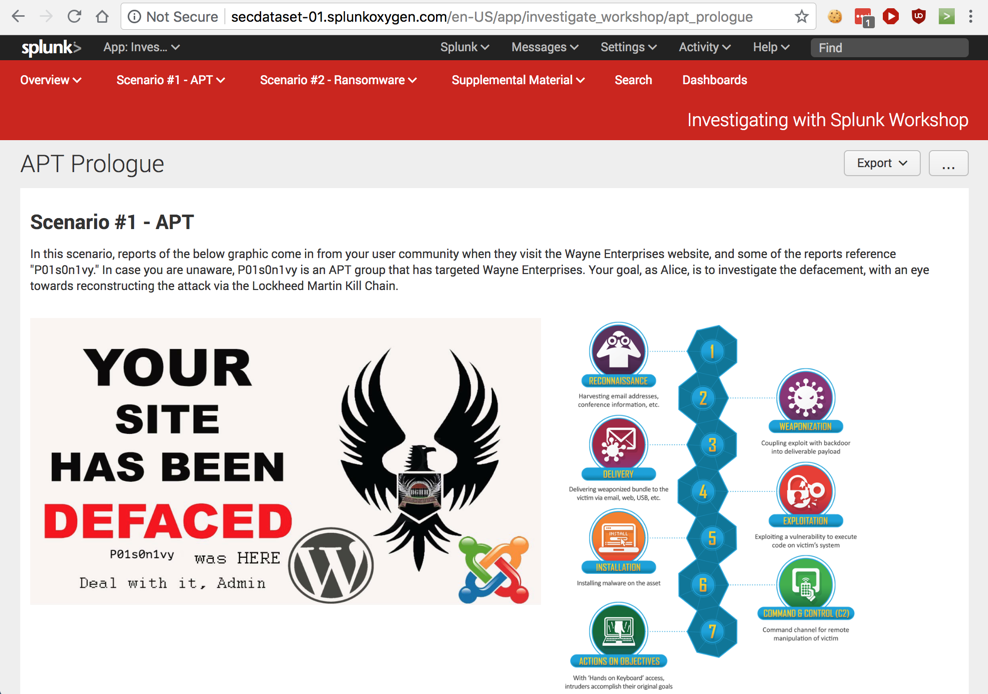
As shown below, the Lockheed-Martin Kill Chain shows that the first step in an attack is "Reconnaissance", which in this case includes scanning the website with a vulnerability scanner.
Vulnerability scanners send thousands of request to the Web server, so the scan should be easy to see in the event data.
At the bottom, click the "Next: Finding the IP Scanning Your Web Server" link.
On the next page, in the "Identify sourcetypes Associated with Search Values" section, click click the green "Run Search in New Tab" button, as shown below.
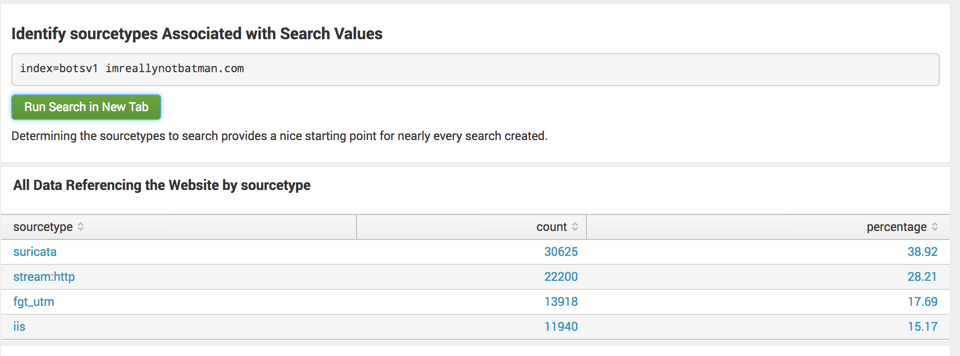
A new browser tab opens, with a live search of sample data.
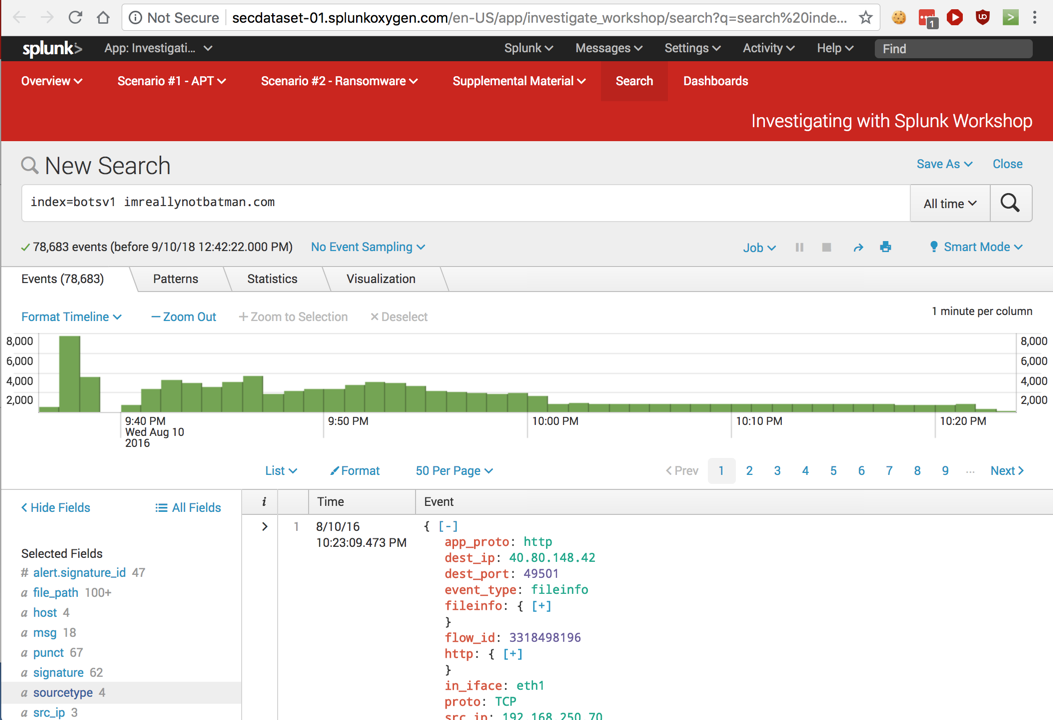
After a few seconds, Splunk finds all 76,683 events including the text "imreallynotbatman.com", as shown below.
The timeline at the top shows a chart with green bars indicating the number of events in various time intervals.
The lower left shows a list of "Selected fields", and the lower right shows individual events.
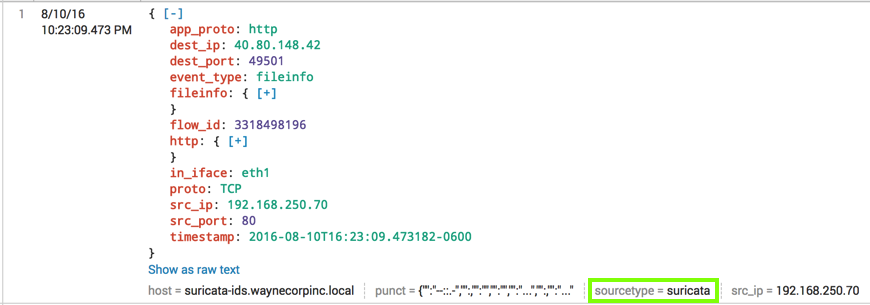
Scroll down to examine an event, as shown below.
On the right side, the event data is shown as name:value pairs, with the names in red and the data in green or blue. The last line in each event shows the "Selected fields" in a single line.
On the left side, the "Selected fields" appear, with a field name in blue and the number of different values found for that field after it, in gray. For this data, there are 4 different "sourcetype" values and 3 "src_ip" values, outlined in green in the image below.

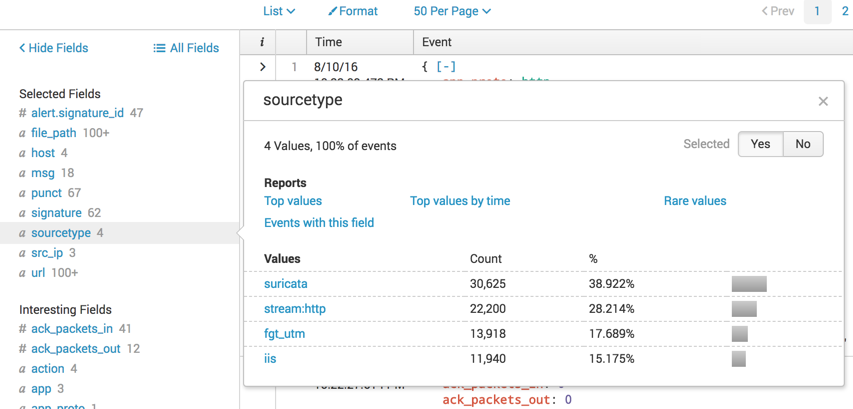
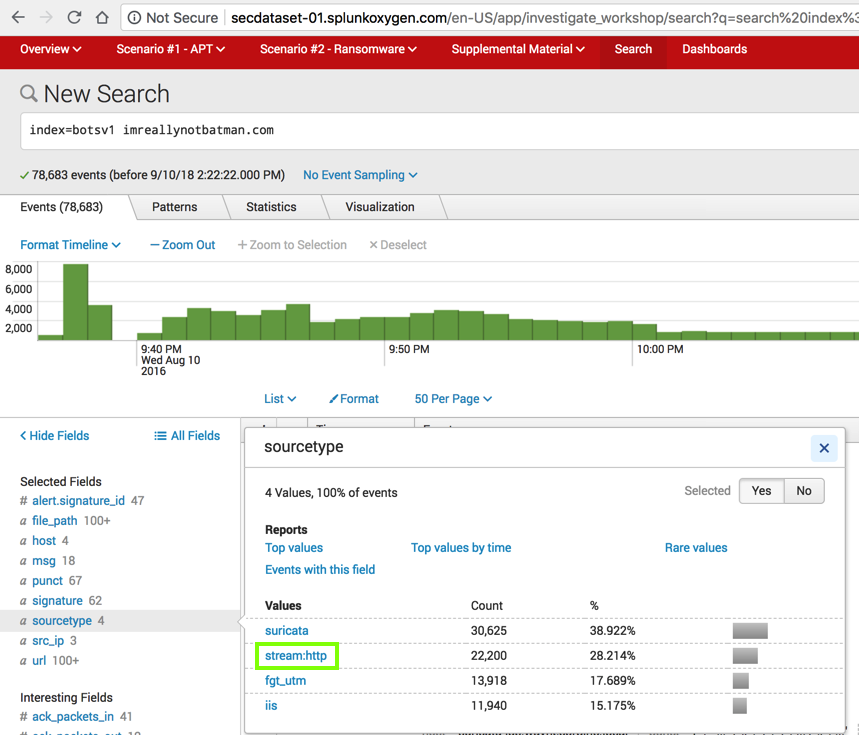
In the lower left, in the "Selected Fields" section, click sourcetype.
A box pops up showing the 4 values, and how many times each value was found, as shown below.
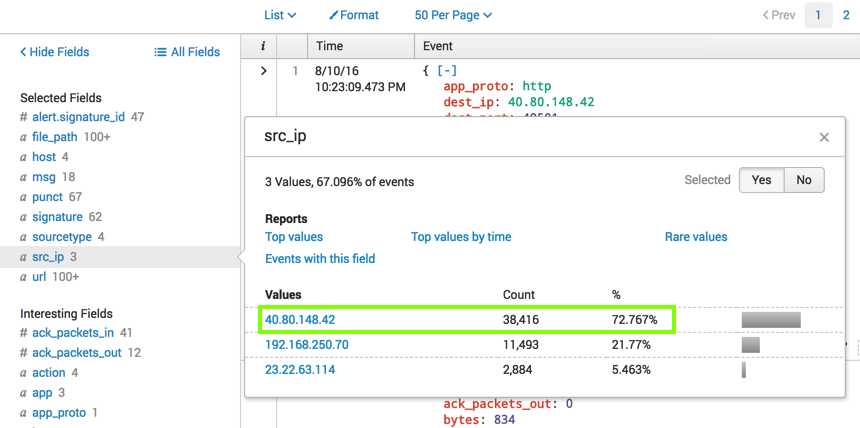
In the lower left, in the "Selected Fields" section, click src_ip.
A box pops up showing the values, as shown below.
The IP "40.80.148.42" appears in the majority of events, 76% of them. This is a likely suspect for the attacker.
It comes from an IDS, so this event indicates that something was detected as suspicious, not just a normal Web request.
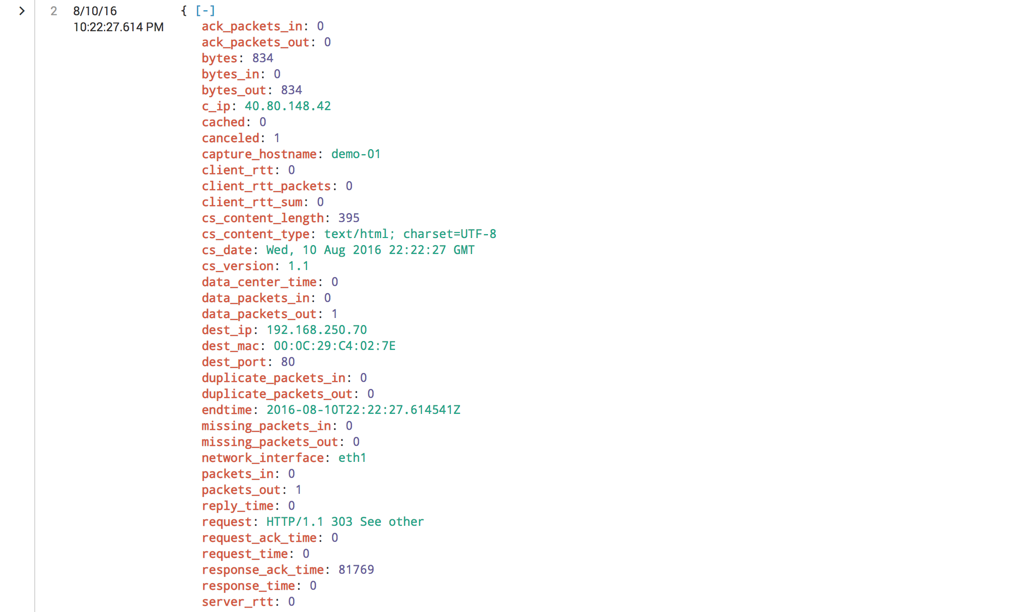
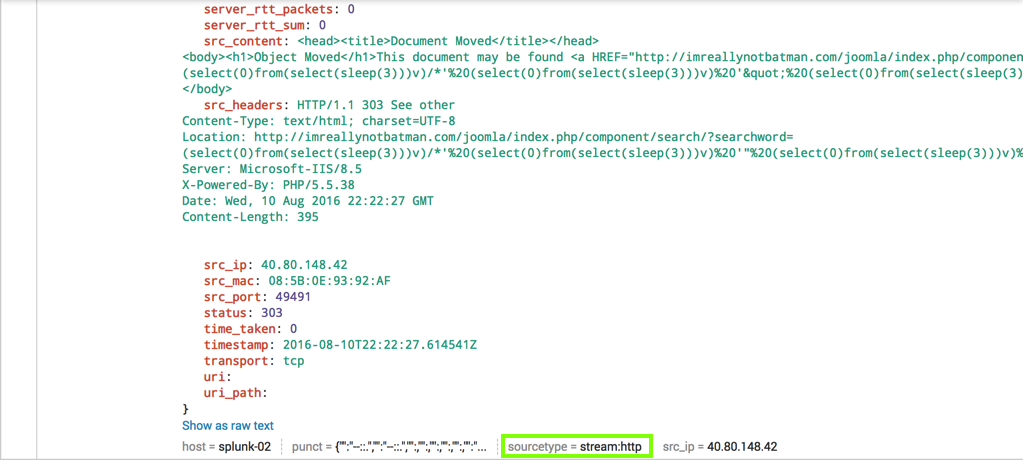
Scroll down and examine event 2, as shown below. There's a lot of data here, from a source of "strem:http". It contains IP addresses, MAC addresses, the HTML source of the response (in the src_content field), the HTTP headers (in the src_headers field), and more.
In the lower left, in the "Selected Fields" list, click sourcetype as shown below.
Splunk performs a new search, adding
sourcetype="stream:http"
to the search string.
Now only 22,200 events are found, as shown below.
In the lower left, in the "Selected Fields" list, click src_ip.
The IP "40.80.148.42" is the source for 94% of the HTTP events, as shown below.
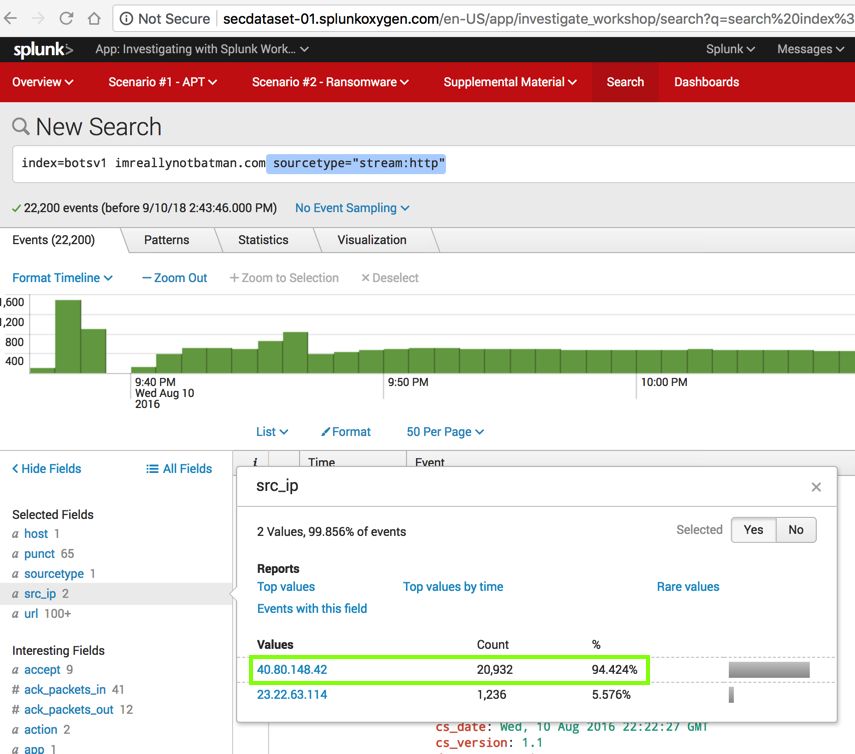
This result shows that IP "40.80.148.42" sent a large amount of HTTP traffic, but it doesn't prove that the traffic was malicious.
Splunk performs the original search again, finding 76,683 events, as shown below.
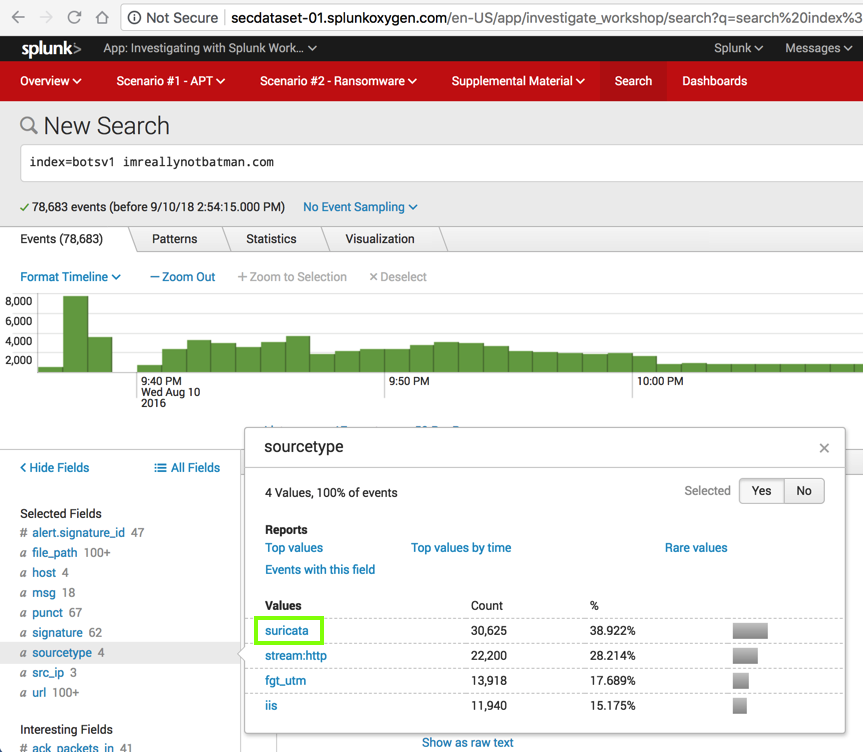
In the lower left, in the "Selected Fields" list, click sourcetype.
In the "sourcetype" box, click suricata, which is outlined in green in the image above.
Splunk searches, and finds 30,625 events, as shown below.
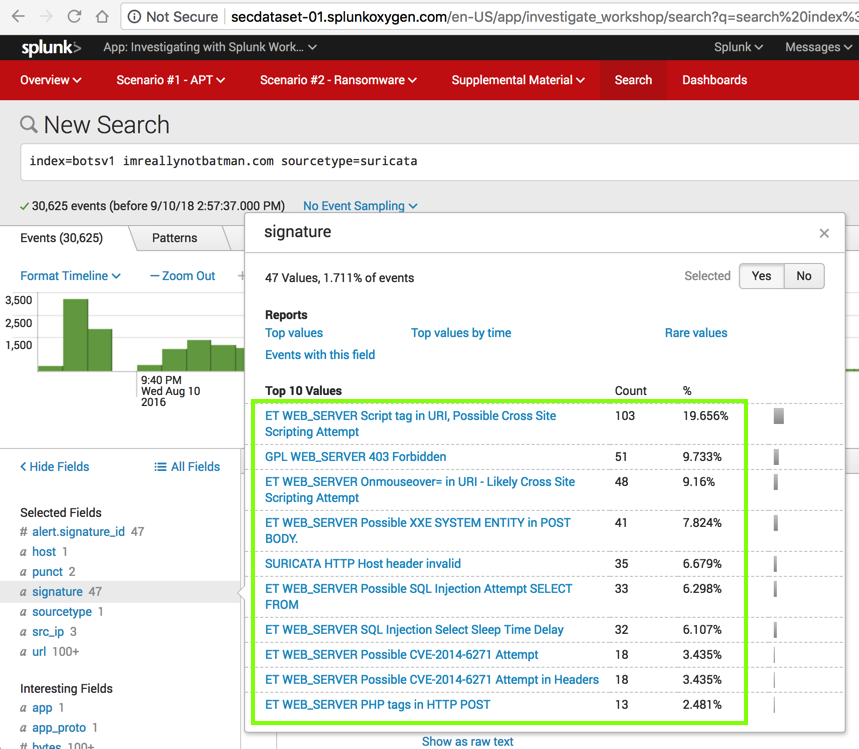
In the lower left, in the "Selected Fields" list, click signature.
In the "signature" box shows the IDS signatures that were detected, outlined in green in the image below.
Now we can see that this is definitely attack traffic, including "Cross Site Scripting", "SQL Injection", and more.
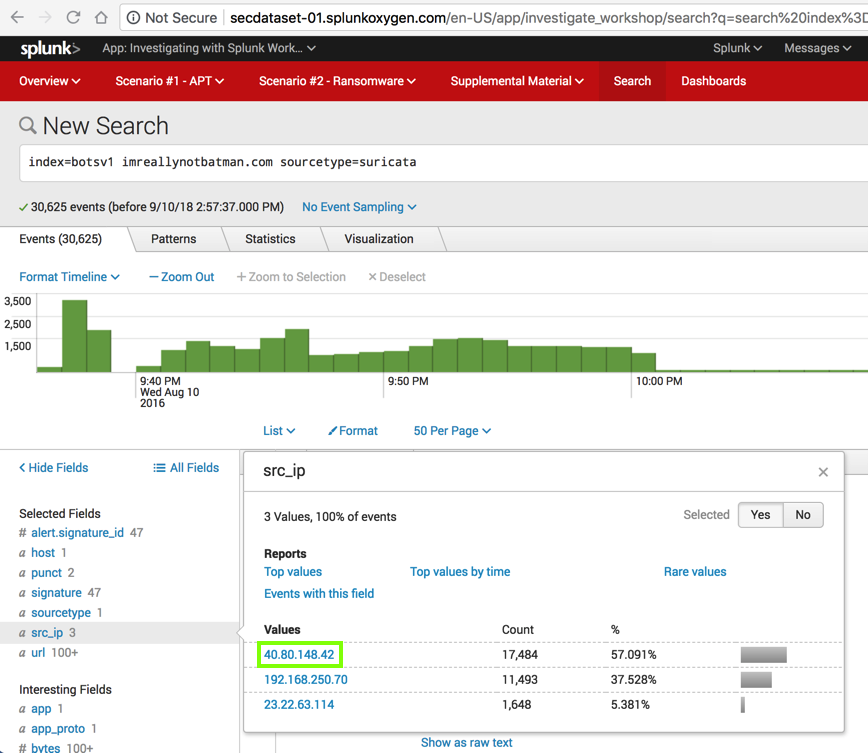
In the lower left, in the "Selected Fields" list, click src_ip.
Three source IP addresses are included in this data, as shown below.
Click the IP address we wish to examine, that is, 40.80.148.42, outlined in green in the image below.
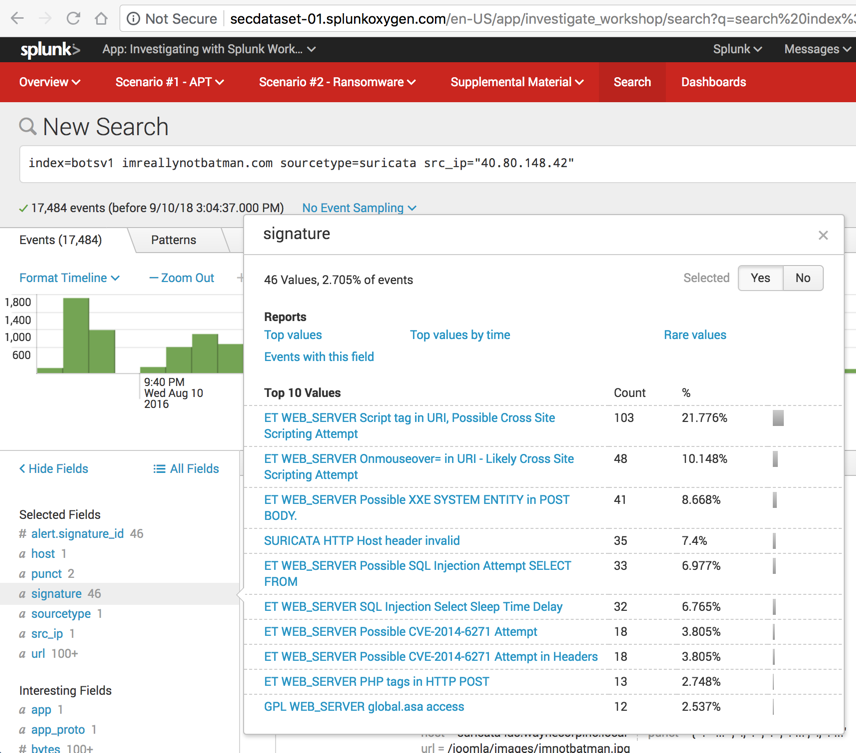
Splunk performs a new search, including only Suricata events from "40.80.148.42". It finds 17,484 events, as shown below.
In the lower left, in the "Selected Fields" list, click signature.
In the "signature" box shows the IDS signatures that were detected, outlined in green in the image below.
Now we can see that this IP address is definitely sending attack traffic, including "Cross Site Scripting", "SQL Injection", and more.
In the "New Search" page, at the top, remove sourcetype=suricata from the query.
Leave the src_ip="40.80.148.42" condition in the query and press Enter.
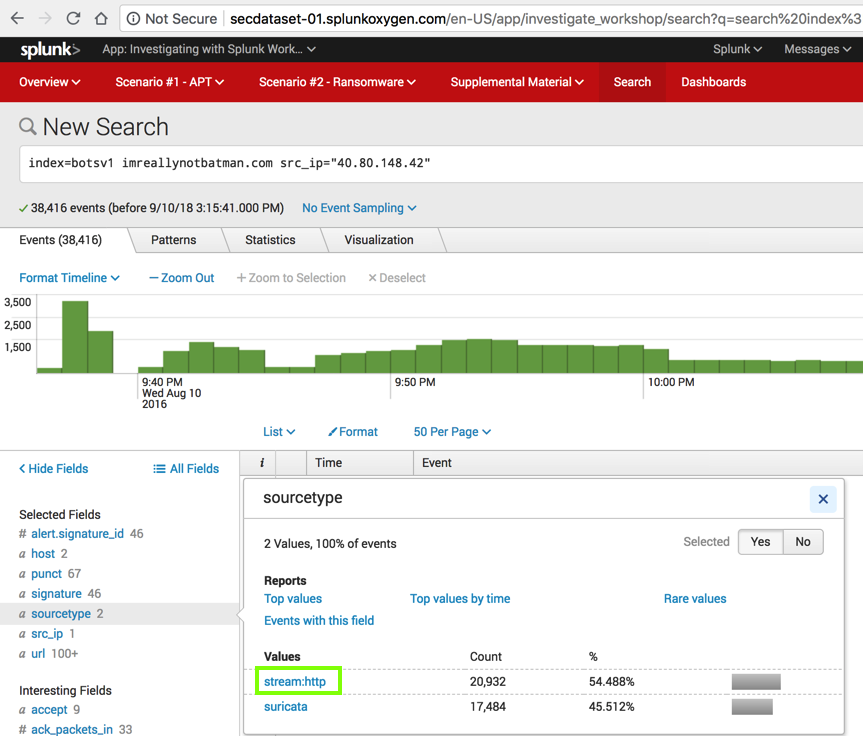
Splunk performs the search, finding 38,418 events, as shown below.
In the lower left, in the "Selected Fields" list, click sourcetype.
In the "sourcetype" box, click stream:http, which is outlined in green in the image below.
Splunk performs a new search, finding 20,932 events, as shown below.
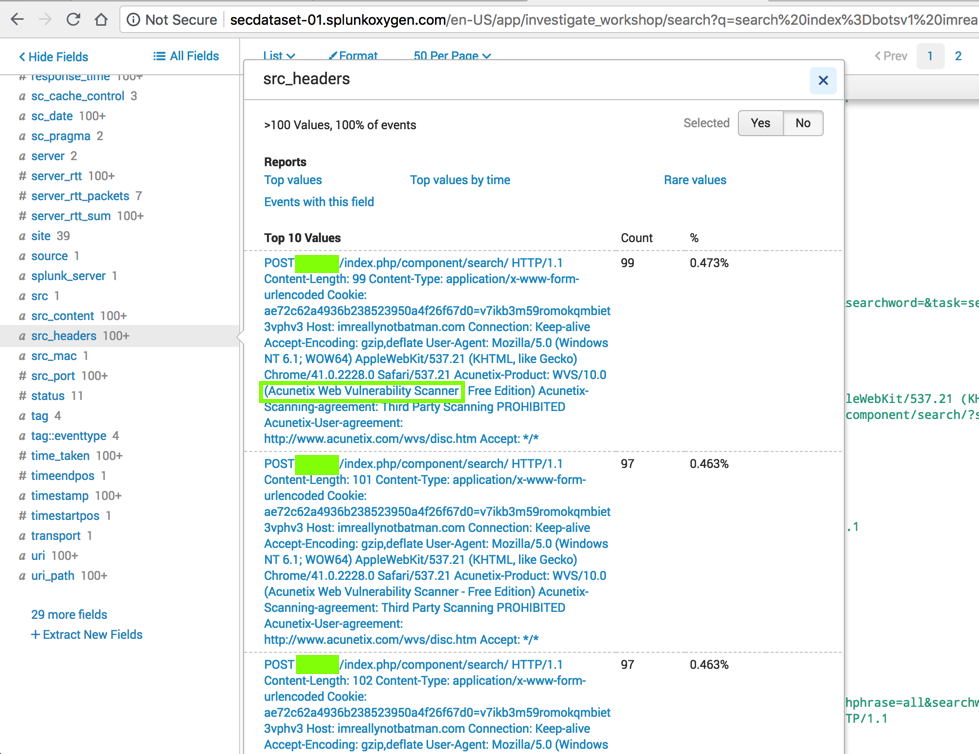
In the lower left, scroll down to find src_headers, as shown below, and click it.
The headers include the brand name of the vulnerability scanner, as outlined in green in the image below.
Notice the directory name, which is covered by a green box in the image below. Enter it into the form below.
If you don't have a Canvas account, see the instructions here.
What IP address is likely attempting a brute force password attack against imnotreallybatman.com?
Use the form below to record your score in Canvas.
If you don't have a Canvas account, see the instructions here.
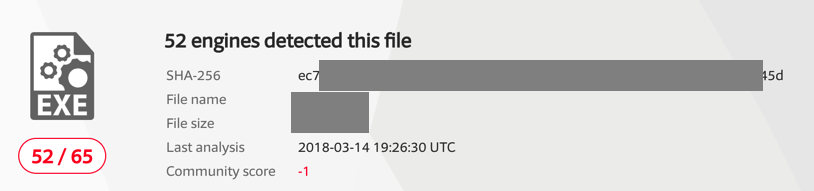
What is the MD5 hash of the executable uploaded?
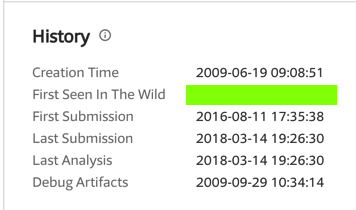
Search VirusTotal.com and find the date that file first was seen in the wild, which is covered by a green box in the image below.
Use the form below to record your score in Canvas.
If you don't have a Canvas account, see the instructions here.
Posted 9-10-18