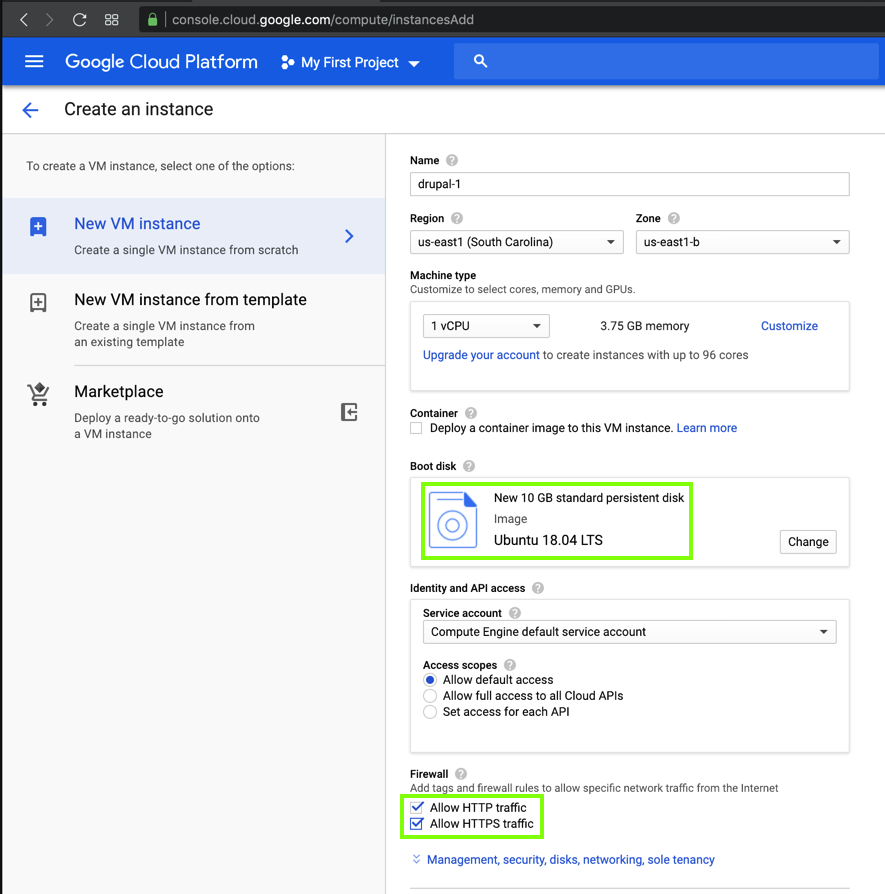
Make another Google Cloud server running Ubuntu 18.04, allowing HTTP and HTTPS traffic, as shown below.
sudo apt-get update
sudo apt-get install nano apache2 -y
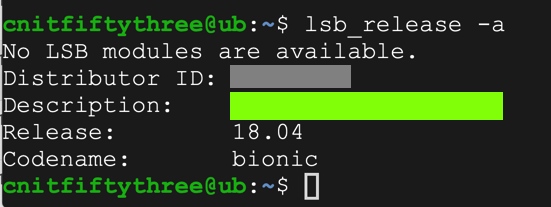
lsb_release -a
At the top right, click the tiny head-and-shoulders icon, outlined in aqua in the image below.
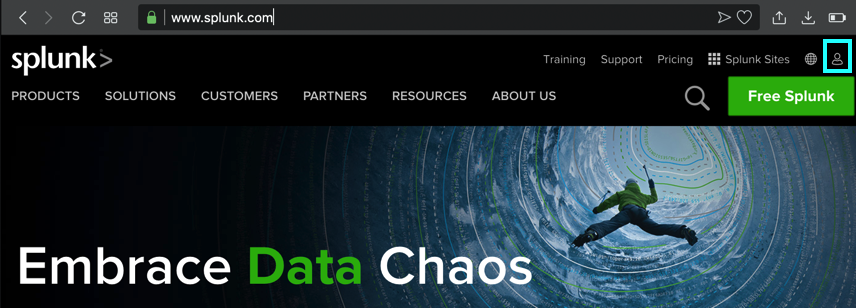
If you have a Splunk account, log in. Otherwise create one now.
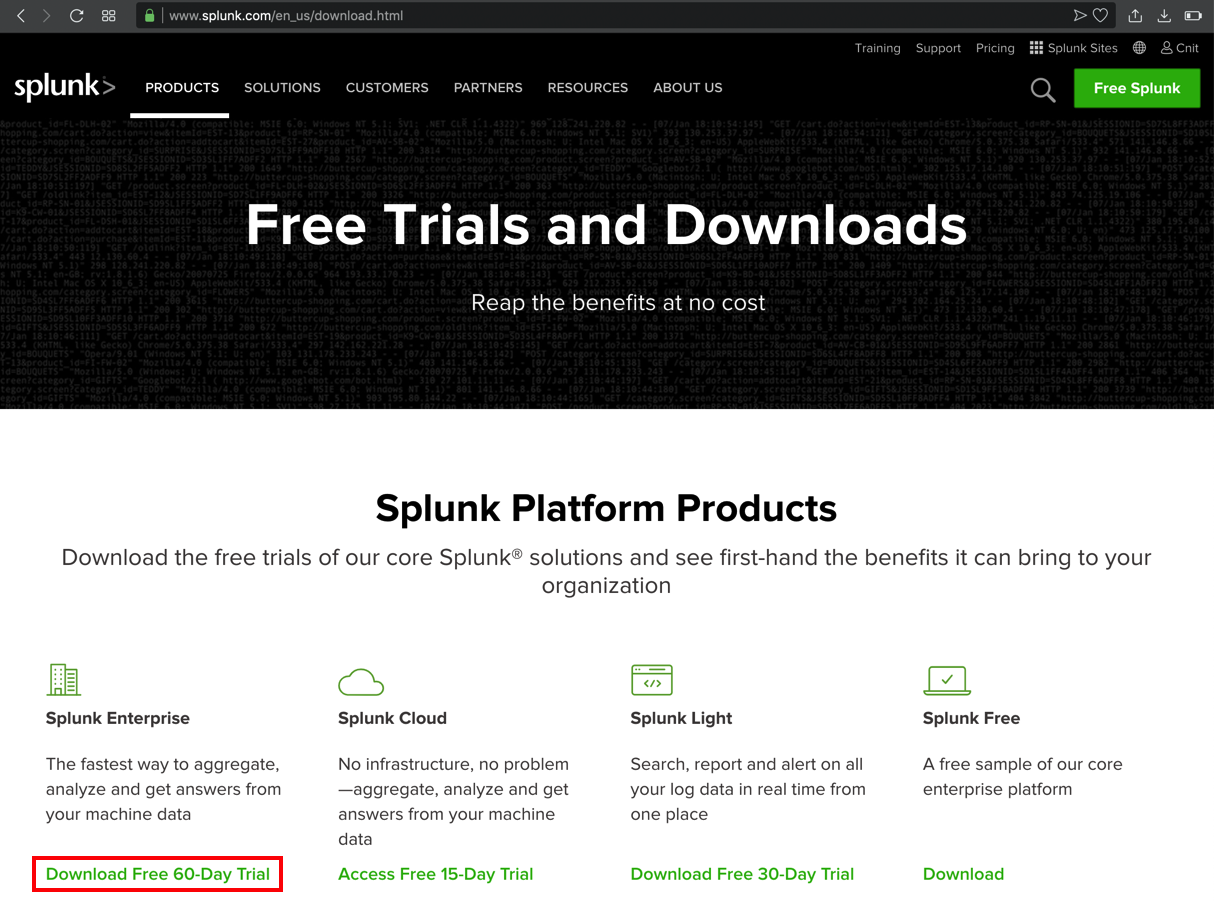
At the top right, click the green "Free Splunk" button.
At the lower left of the next page, in the "Splunk Enterprise" sectin, click "Download Free 60-Day Trial", as shown below.
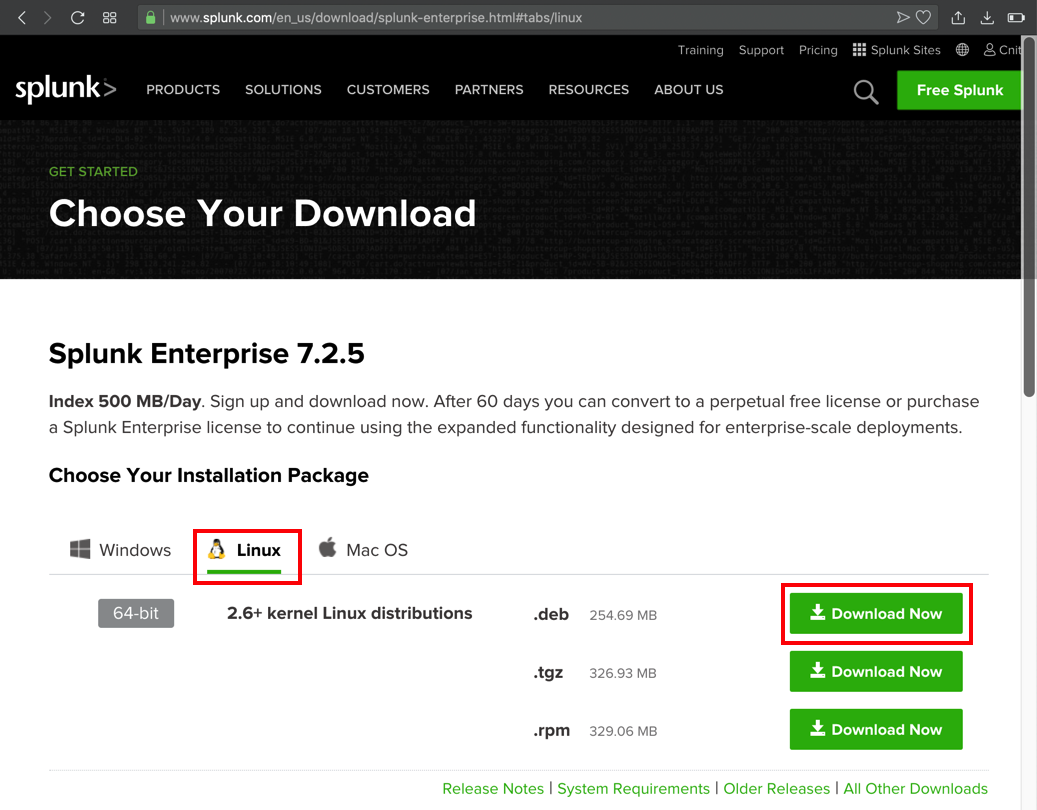
On the next page, click the Linux tab, and, in the ".deb" line, click the "Download Now" button, as shown below.
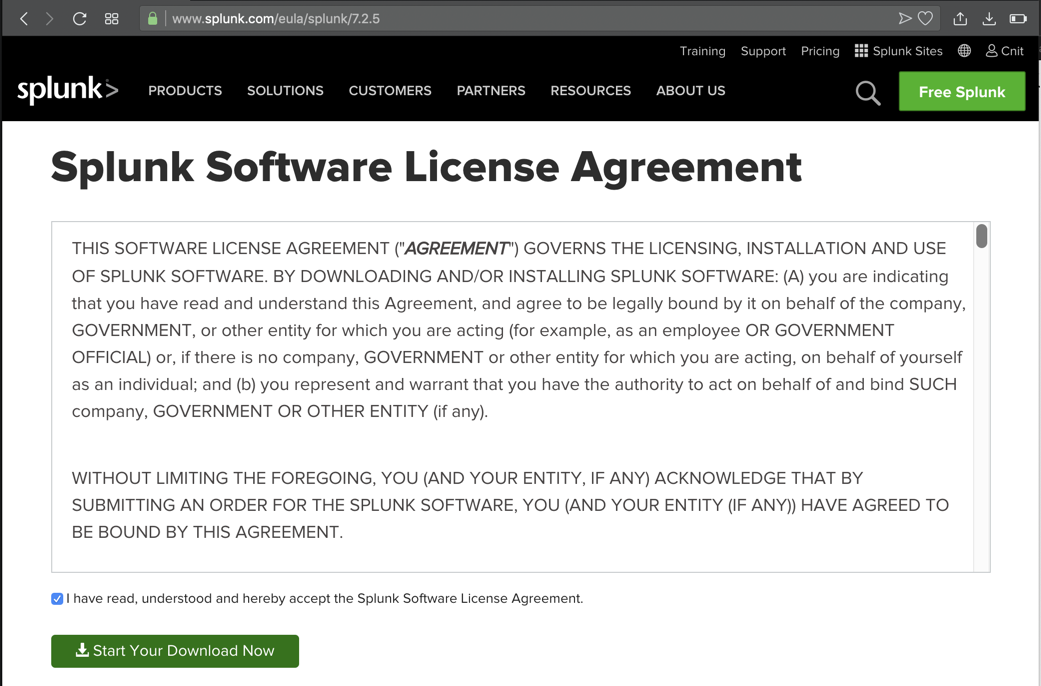
On the next page, accept the agreement and click the "Start Your Download Now" button, as shown below.
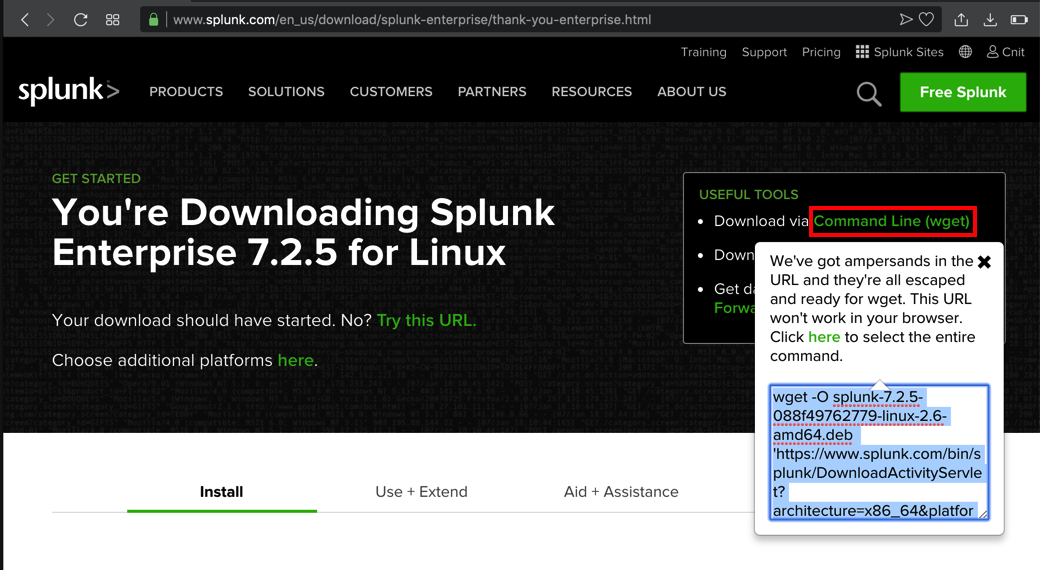
When the download starts, cancel it. At the top right of the next page, click "Command Line (wget)".
Highlight the command in the pop-up box and copy it, as shown below.
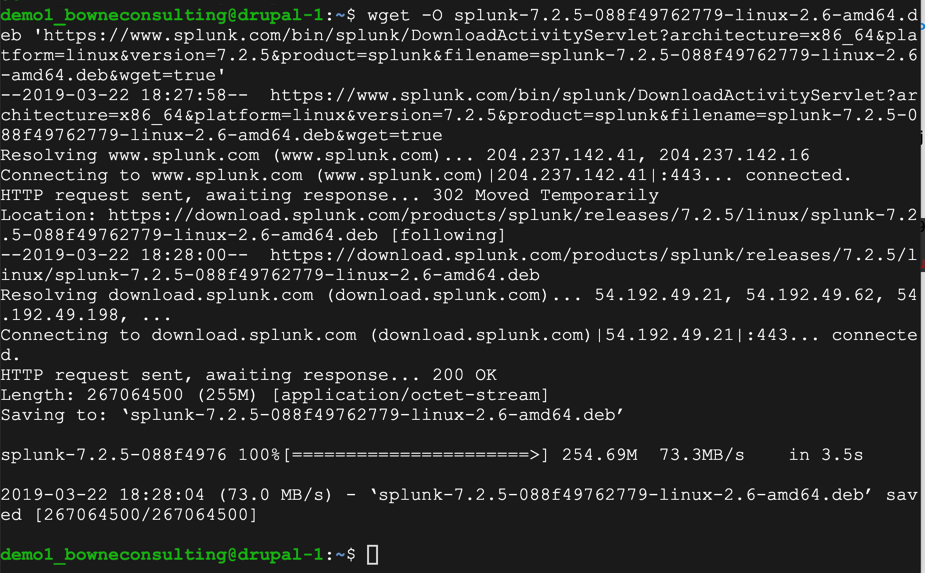
On the Ubuntu server, execute these commands.
sudo dpkg -i splunk*
cd /opt/splunk/bin
sudo ./splunk set web-port 443
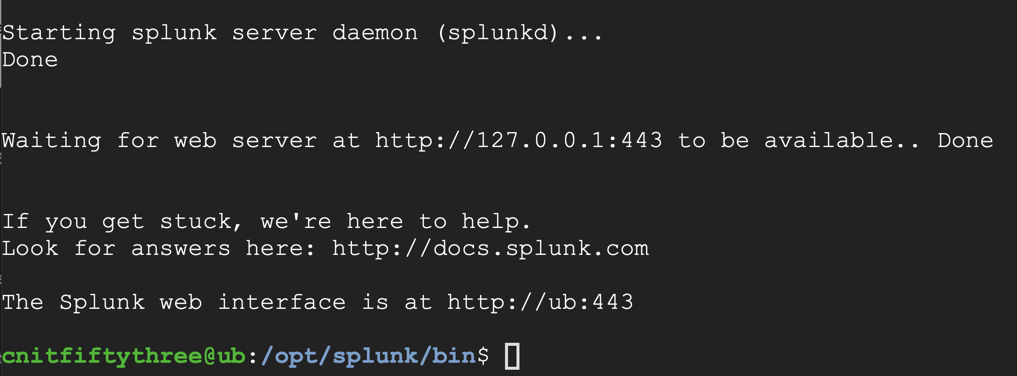
sudo ./splunk start
Enter y to agree to the license. Enter a username and password of your choice for Splunk. Make a note of the username and password you chose!
Splunk installs, as shown below.
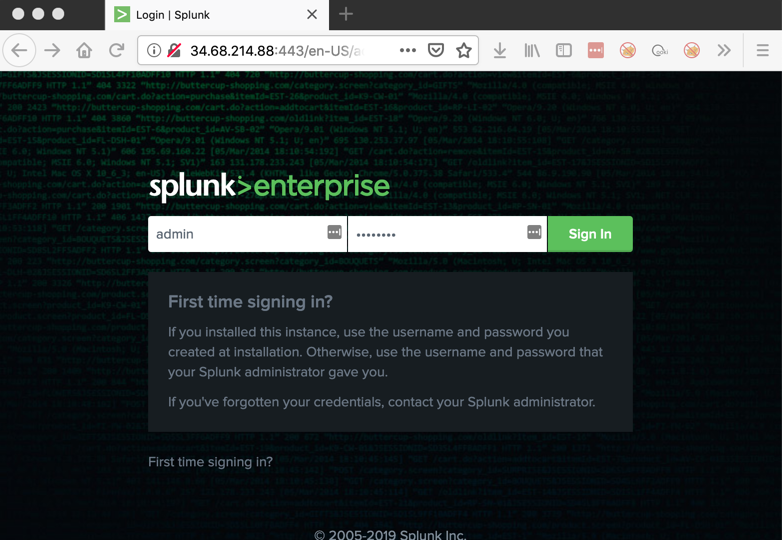
http://34.73.73.12:443
The Splunk management opens. Log in with the username and password you specified when installing Splunk, as shown below.
Troubleshooting
The CCSF network blocks this traffic, so you'll need to work around that, using a technique such as:
- Connecting to "Danger Zone" in S37 or S2145
- Connecting through your cell phone
- Working off-campus
- Using a VPN
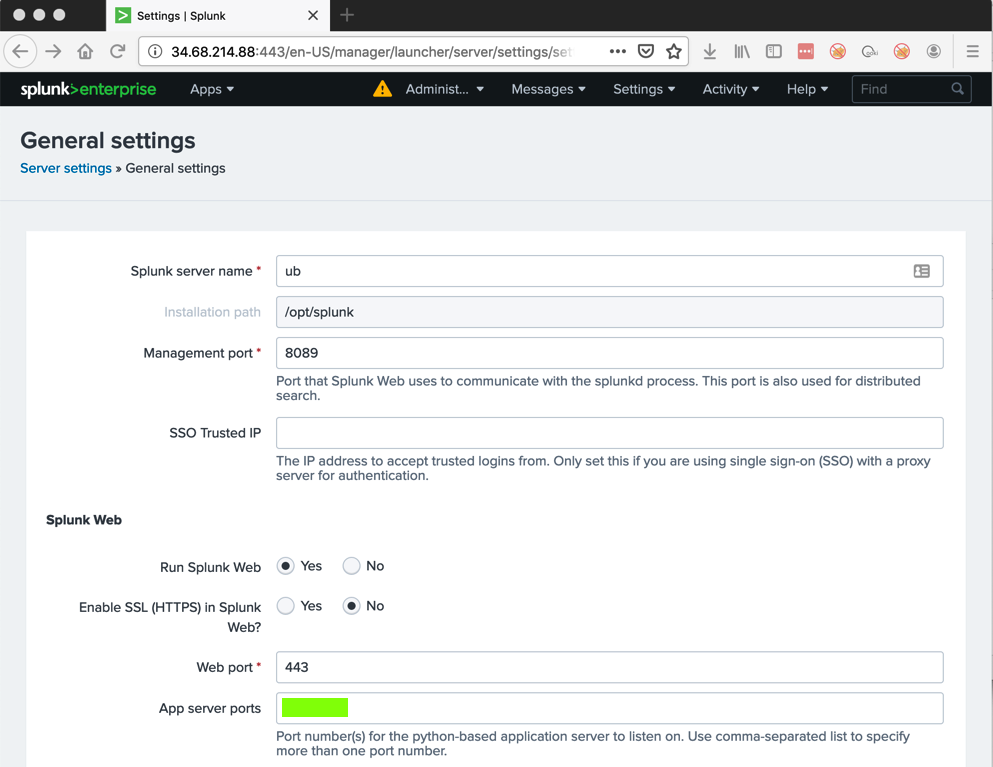
The text covered by the green box in the image below is the flag.
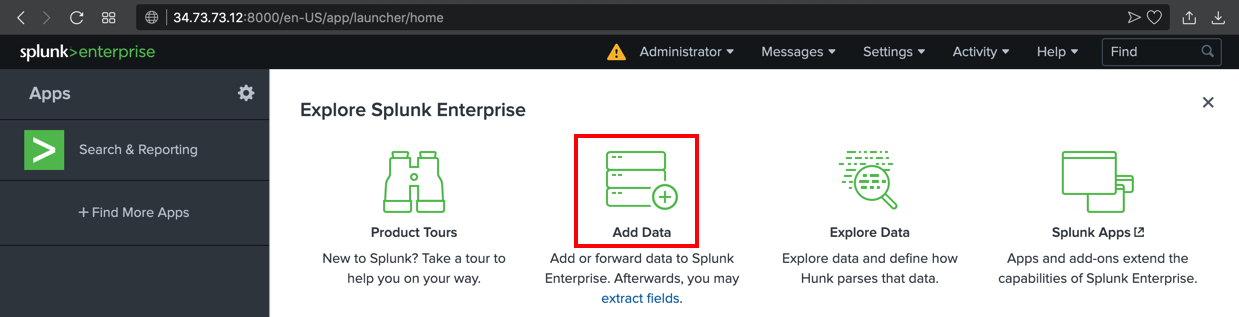
If a box pops up asking you to take a tour, click Skip.
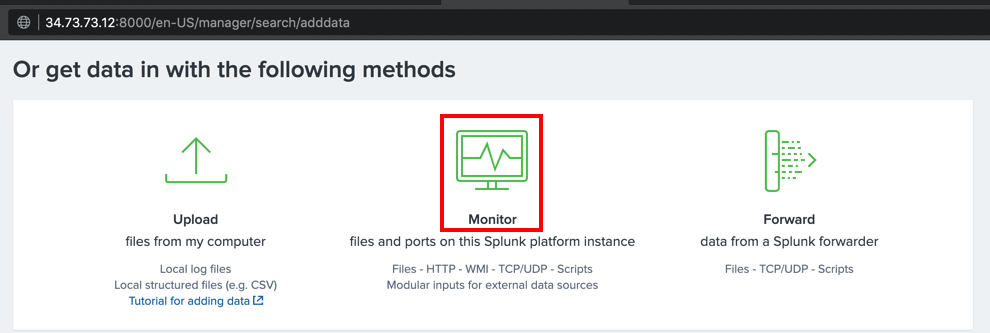
In the next page, scroll down to the "Or get data in with the following methods" section, and click Monitor, as shown below.
In the "Add Data" screen, on the left side, click "Files & Directories".
On the right side, enter a "File or Directory" of
/var/log
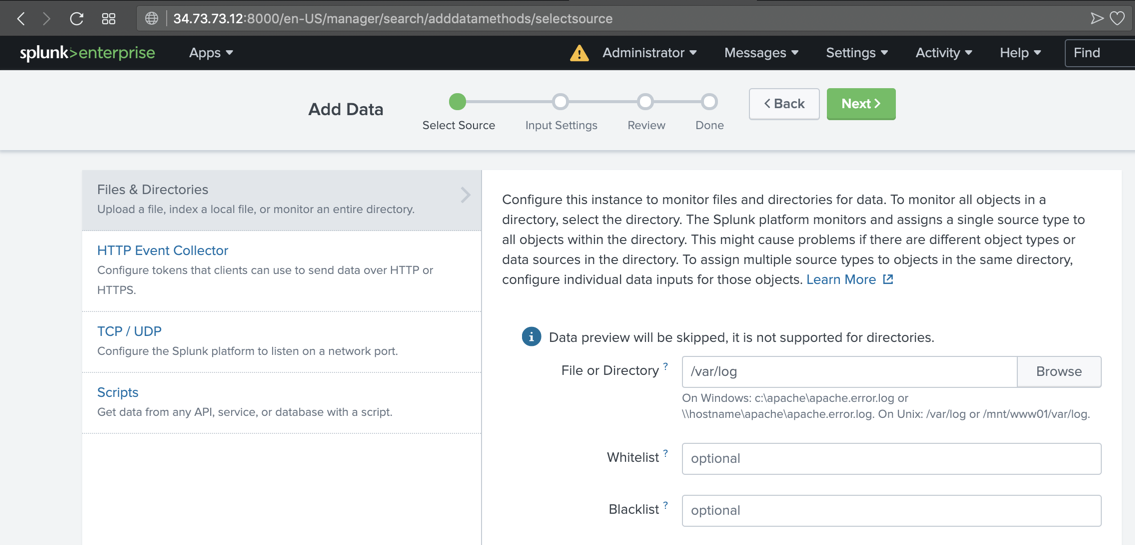
At the top right, click the green Next button.
Click Review. Click Submit.
Click "Start Searching".
If a box pops up asking you to take a tour, click Skip.
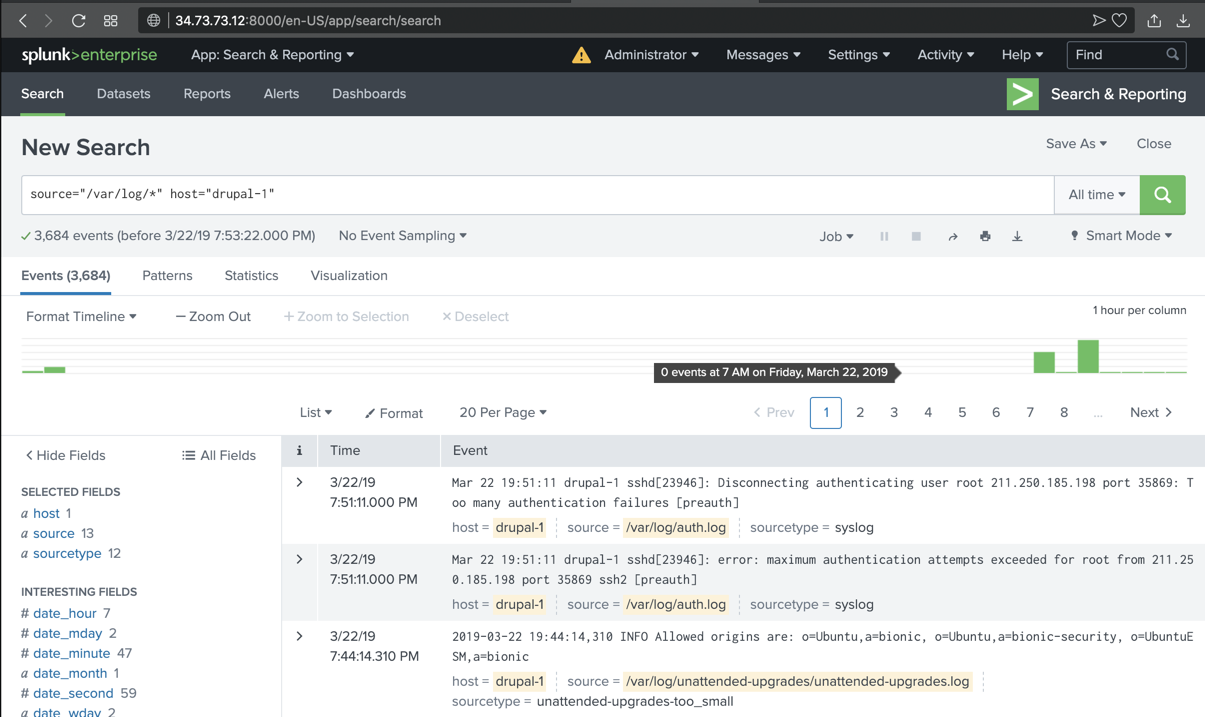
Splunk shows log entries, as shown below.
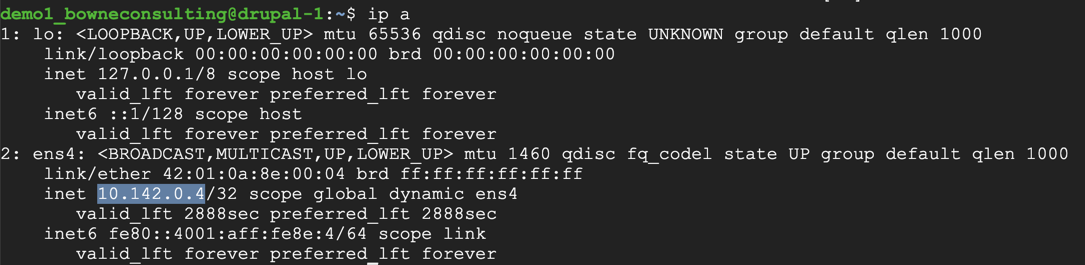
ip a
sudo nano /etc/ssh/sshd_config
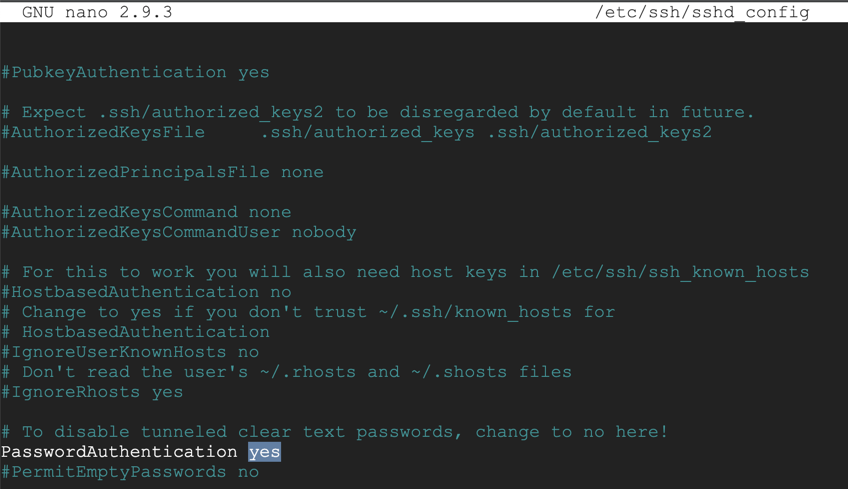
Save the file with Ctrl+X, Y, Enter.
Execute this command to restart SSH:
sudo systemctl restart ssh
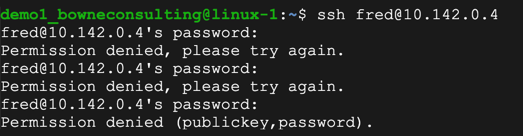
ssh fred@10.142.0.4
On the left side, click "Search & Reporting".
In the Search page, in the lower right, click the "Data Summary" button, as shown below.

A "Data Summary" box pops up, as shown below.
Click the hostname of your server, which appears in blue letters.
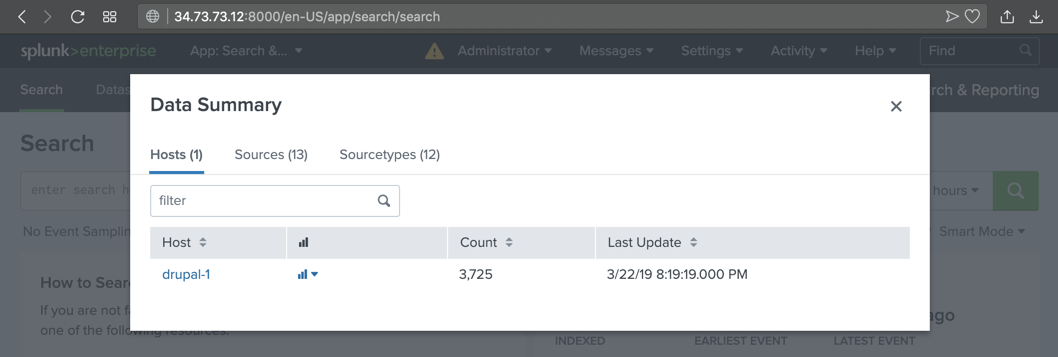
The text covered by the green box in the image below is the flag.

sudo apt install software-properties-common -y
sudo add-apt-repository ppa:oisf/suricata-stable
sudo apt update
sudo apt-get install suricata -y
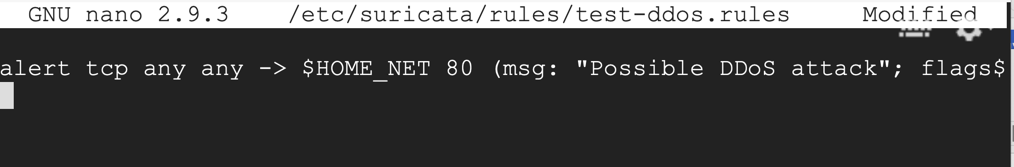
sudo nano /etc/suricata/rules/test-ddos.rules
alert tcp any any -> $HOME_NET 80 (msg: "Possible DDoS attack"; flags: S; flow: stateless; threshold: type both, track by_dst, count 20, seconds 1; sid:1000001; rev:1;)
Save the file with Ctrl+X, Y, Enter.
On your Ubuntu server, execute this command:
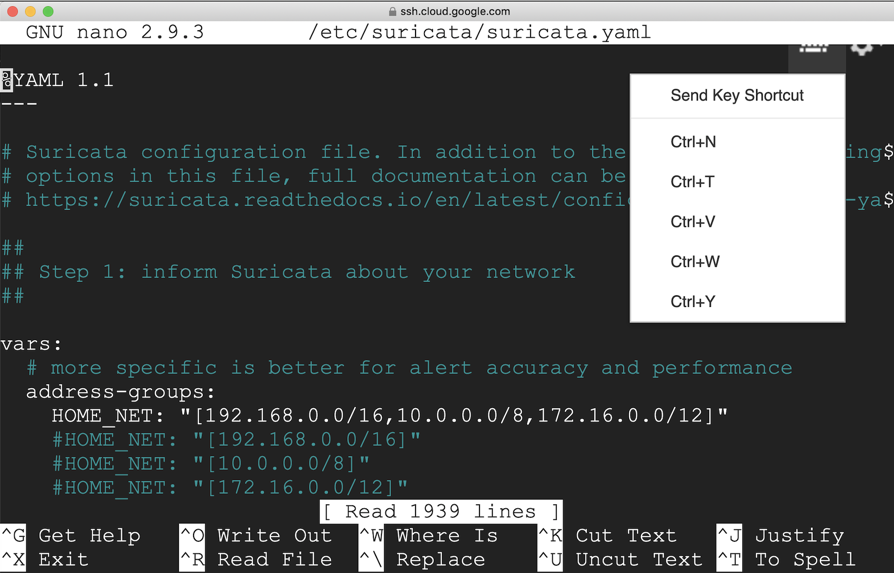
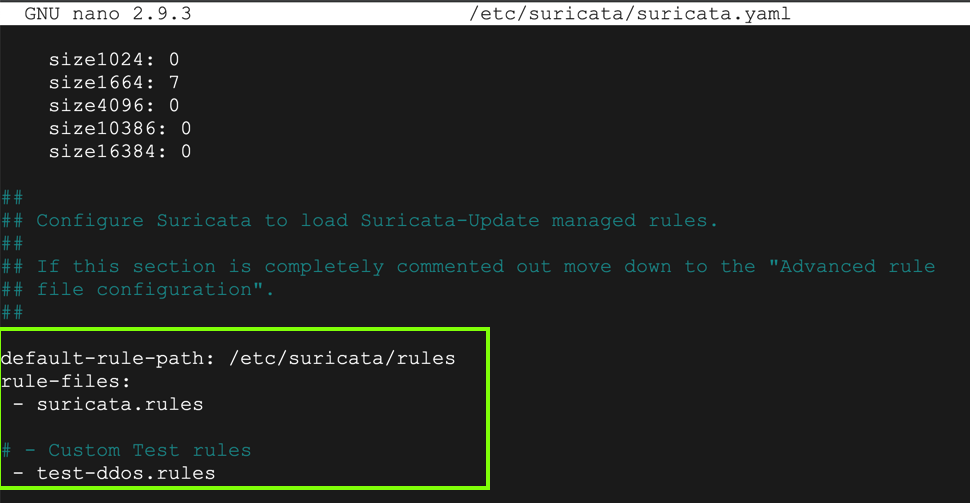
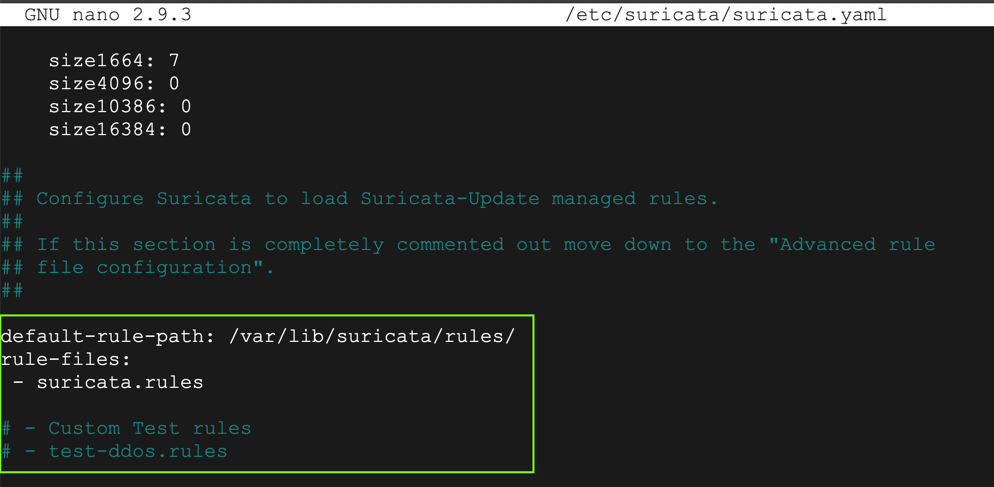
sudo nano /etc/suricata/suricata.yaml
If your browser doesn't let you press Ctrl+W, use the mouse to select it from the on-screen keyboard icon, as shown below.Adjust the "default-rule-path" and insert a "Custom Test Rule", as shown below.
Use Ctrl+W to find all references to "eth0" and change them to "ens4"
Save the file with Ctrl+X, Y, Enter.
sudo service suricata stop
sudo rm /var/run/suricata.pid
sudo suricata -D -c /etc/suricata/suricata.yaml -i ens4
tail -f /var/log/suricata/fast.log
sudo apt install hping3
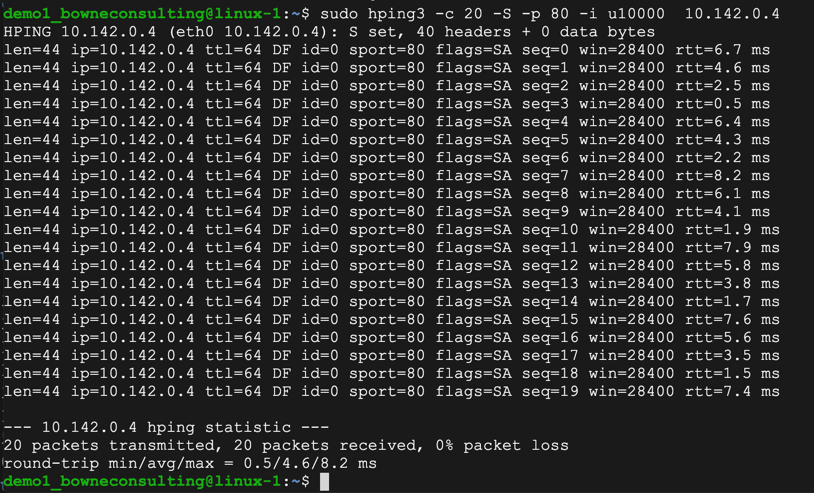
sudo hping3 -c 20 -S -p 80 -i u10000 10.142.0.4
The text covered by the green box in the image below is the flag.

Troubleshooting
If you see no alerts, check the /etc/suricata/suricata.yaml file and make sure it is exactly as shown above.
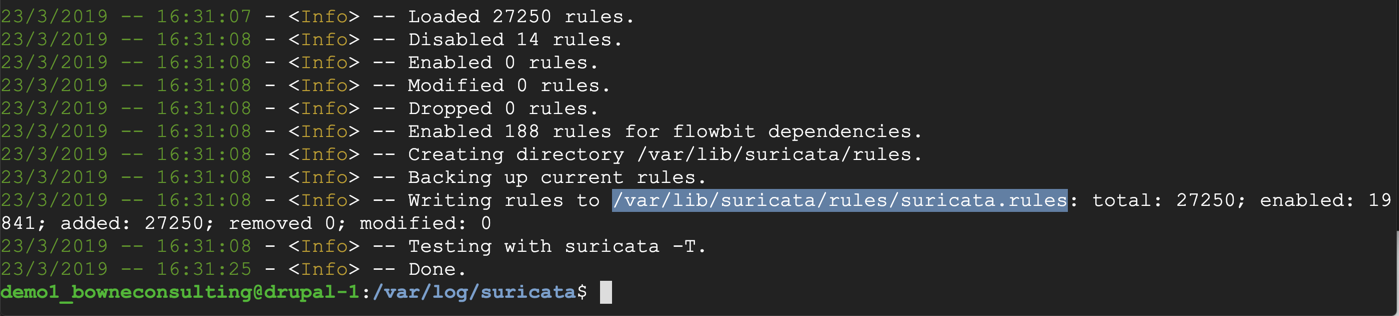
sudo suricata-update
sudo nano /etc/suricata/suricata.yaml
Adjust the "default-rule-path" and comment out the "Custom Test Rule", as shown below.
Save the file with Ctrl+X, Y, Enter.
sudo service suricata stop
sudo rm /var/run/suricata.pid
sudo suricata -D -c /etc/suricata/suricata.yaml -i ens4
On the left side, click "Search & Reporting".
In the lower center, click the "Data Summary" button.
In the "Data Summary" box, click the Sources tab. Several Suricata files appear, as shown below.
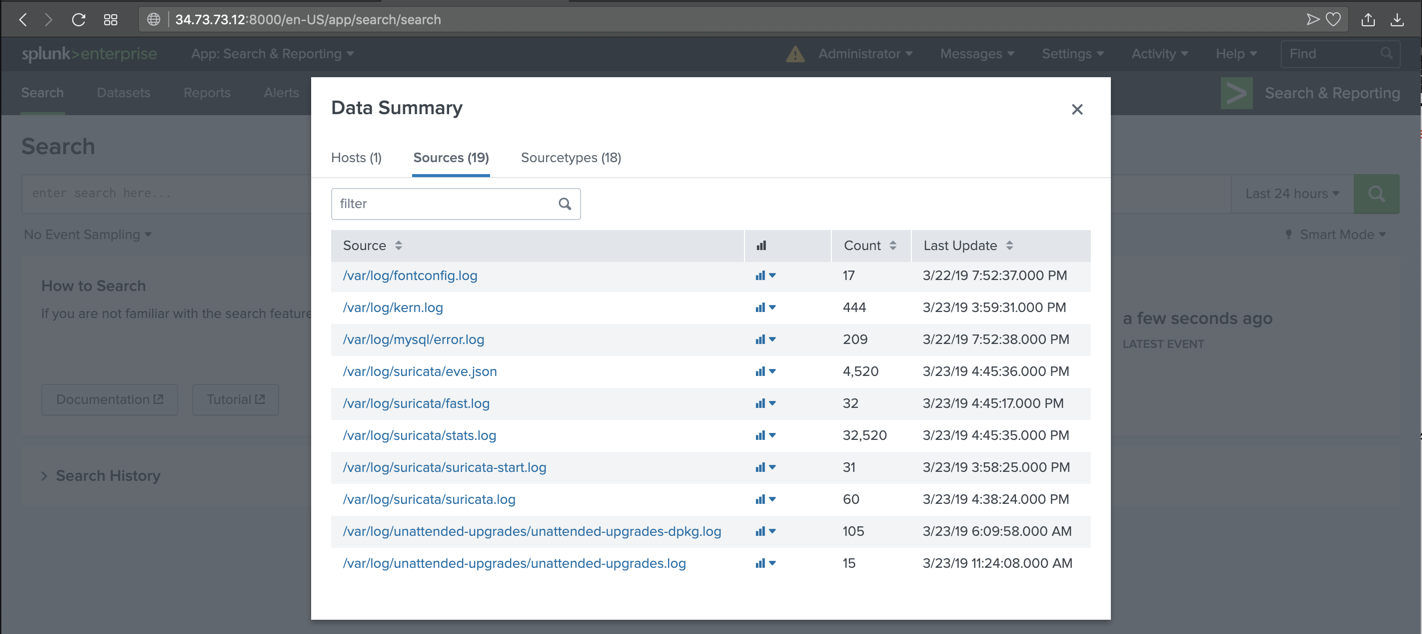
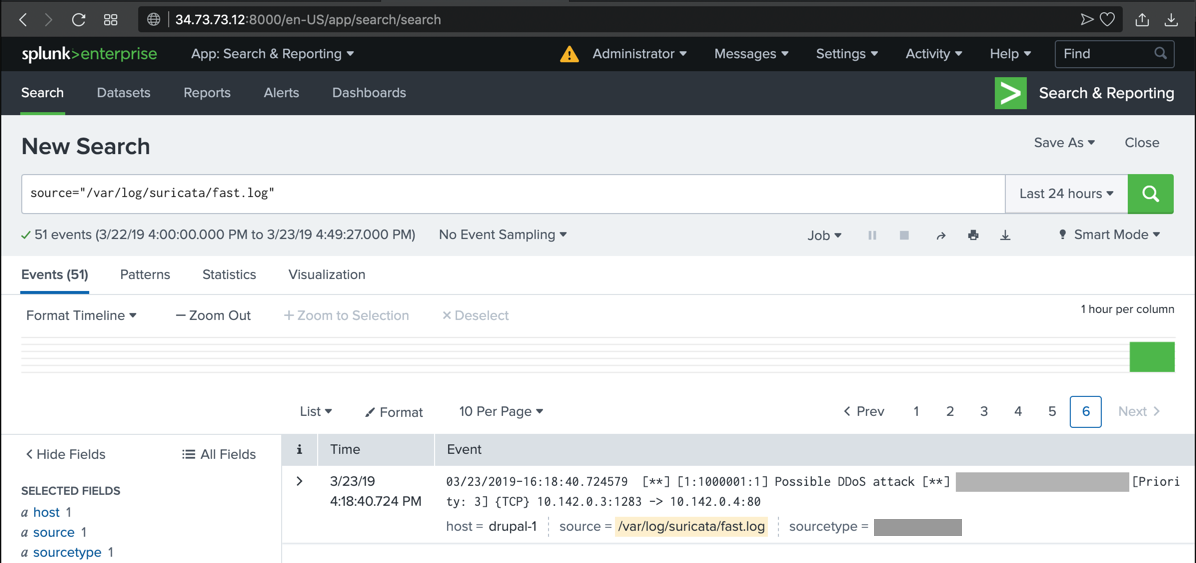
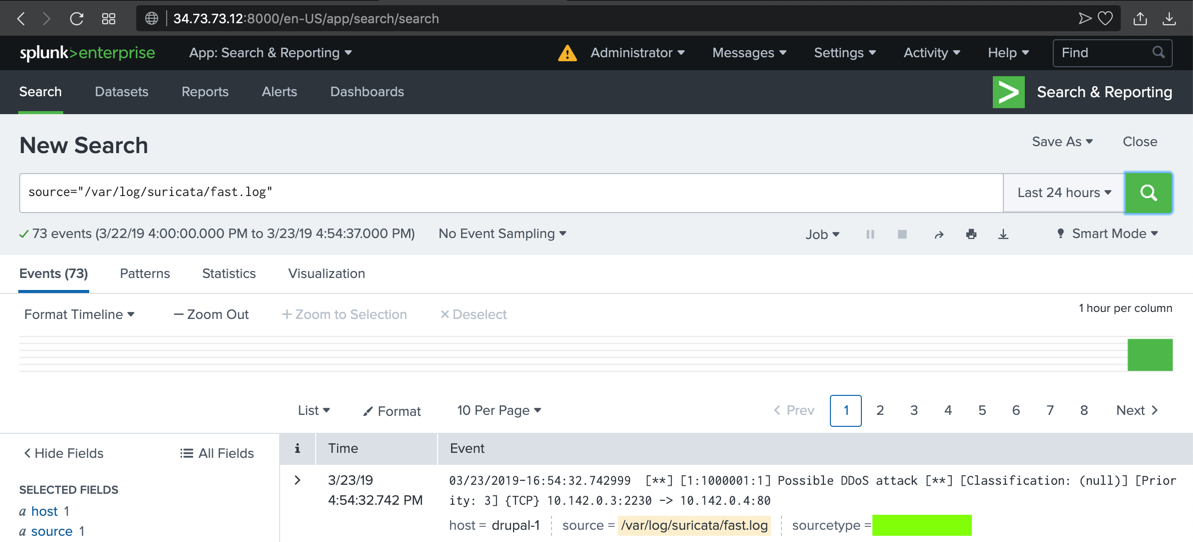
Click /var/log/suricata/fast.log.
The alert you saw previously appears in Splunk, as shown below.
sudo hping3 -c 20 -S -p 80 -i u10000 10.142.0.4
The text covered by the green box in the image below is the flag.
Posted 3-21-19
Install lshw added 5-20-19
Image fixed and software-properties-common added 5-20-19
Point total for 1.1 changed to 10 8-8-19
Update added for Ubuntu 8-8-19
Hint added for missing suricata fast alerts 8-8-19
More PHP extensions added 8-19-19
Note about CCSF blocking the Splunk port 443 traffic added 9-10-19