https://github.com/pralab/secml/blob/master/tutorials/06-MNIST_dataset.ipynb
Jupyter Notebook Server
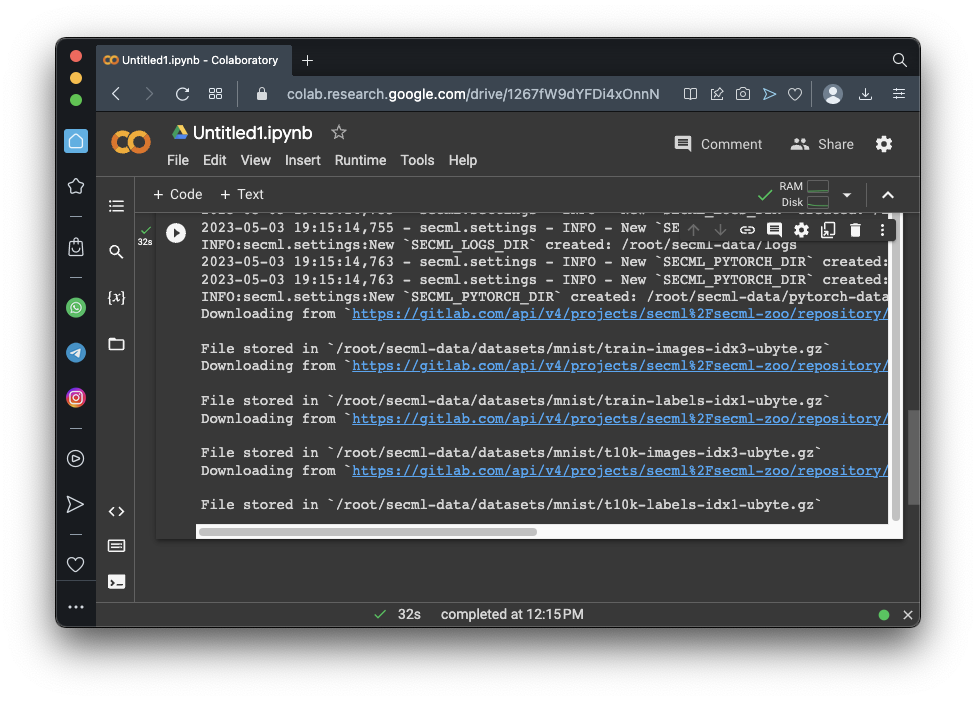
This project uses the SecML library, which hasn't been updated since 2023. It no longer works in Google Colab. Instead, you need to use a local virtual machine running an older Jupyter Notebook.See project ML 107 to see how to download and run that machine.
import secml
from secml.data.loader import CDataLoaderMNIST
loader = CDataLoaderMNIST()
random_state = 999
n_tr = 100 # Number of training set samples
n_val = 500 # Number of validation set samples
n_ts = 500 # Number of test set samples
digits = (5, 9)
tr_val = loader.load('training', digits=digits, num_samples=n_tr + n_val)
ts = loader.load('testing', digits=digits, num_samples=n_ts)
# Split in training and validation set
tr = tr_val[:n_tr, :]
val = tr_val[n_tr:, :]
# Normalize the features in `[0, 1]`
tr.X /= 255
val.X /= 255
ts.X /= 255
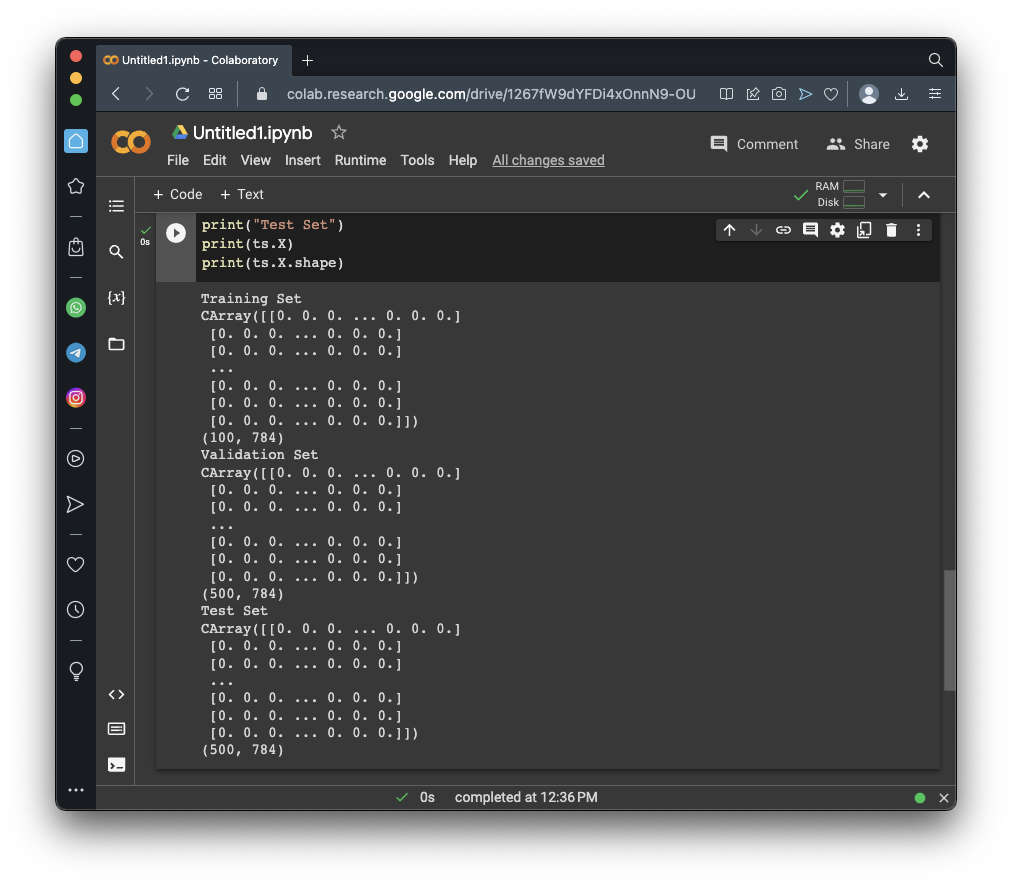
print("Training Set")
print(tr.X)
print(tr.X.shape)
print("Validation Set")
print(val.X)
print(val.X.shape)
print("Test Set")
print(ts.X)
print(ts.X.shape)
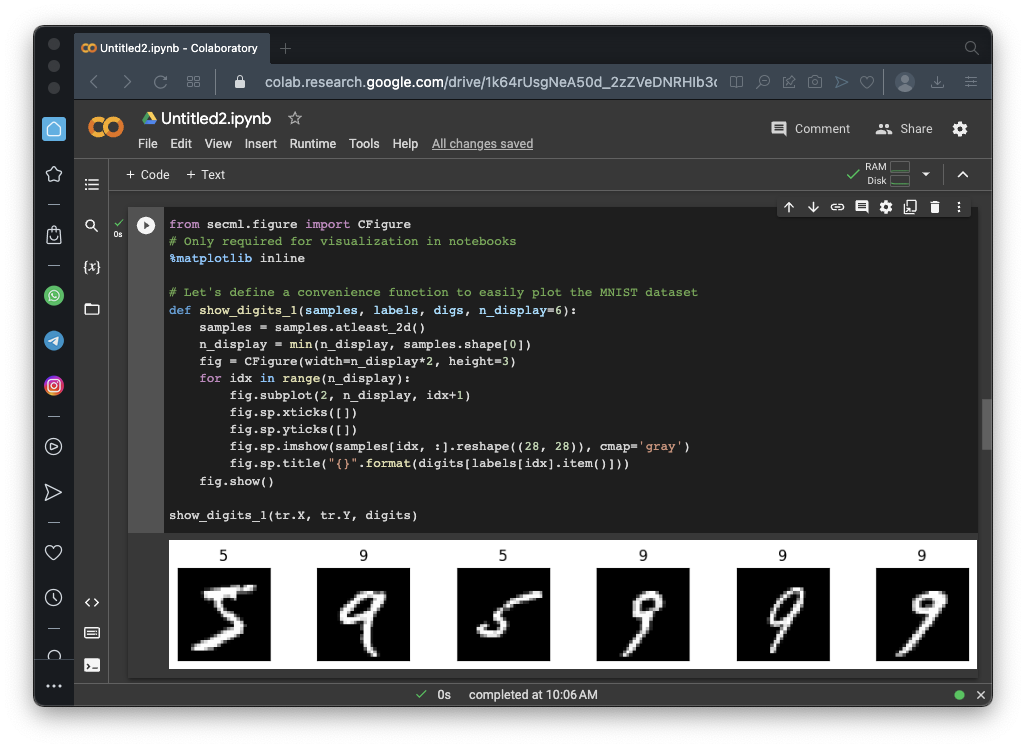
from secml.figure import CFigure
# Only required for visualization in notebooks
%matplotlib inline

# Let's define a convenience function to easily plot the MNIST dataset
def show_digits_1(samples, labels, digs, n_display=6):
    samples = samples.atleast_2d()
    n_display = min(n_display, samples.shape[0])
    fig = CFigure(width=n_display*2, height=3)
    for idx in range(n_display):
        fig.subplot(2, n_display, idx+1)
        fig.sp.xticks([])
        fig.sp.yticks([])
        fig.sp.imshow(samples[idx, :].reshape((28, 28)), cmap='gray')
        fig.sp.title("{}".format(digits[labels[idx].item()]))
    fig.show()

show_digits_1(tr.X, tr.Y, digits)
from secml.ml.classifiers import CClassifierSVM
# train SVM in the dual space, on a linear kernel, as needed for poisoning
clf = CClassifierSVM(C=10, kernel='linear')
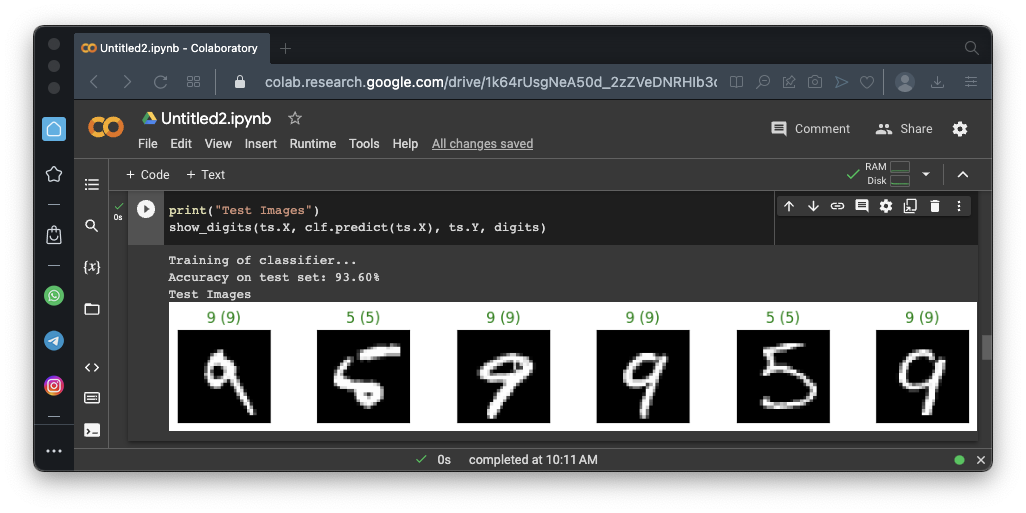
print("Training of classifier...")
clf.fit(tr.X, tr.Y)
# Compute predictions on a test set
y_pred = clf.predict(ts.X)
# Metric to use for performance evaluation
from secml.ml.peval.metrics import CMetricAccuracy
metric = CMetricAccuracy()
# Evaluate the accuracy of the classifier
acc = metric.performance_score(y_true=ts.Y, y_pred=y_pred)
print("Accuracy on test set: {:.2%}".format(acc))
# Let's define a convenience function to easily plot the MNIST dataset
def show_digits(samples, preds, labels, digs, n_display=6):
samples = samples.atleast_2d()
n_display = min(n_display, samples.shape[0])
fig = CFigure(width=n_display*2, height=3)
for idx in range(n_display):
fig.subplot(2, n_display, idx+1)
fig.sp.xticks([])
fig.sp.yticks([])
fig.sp.imshow(samples[idx, :].reshape((28, 28)), cmap='gray')
fig.sp.title("{} ({})".format(digits[labels[idx].item()], digs[preds[idx].item()]),
color=("green" if labels[idx].item()==preds[idx].item() else "red"))
fig.show()
print("Test Images")
show_digits(ts.X, clf.predict(ts.X), ts.Y, digits)
lb, ub = 0., 1. # Bounds of the attack space. Can be set to `None` for unbounded
n_poisoning_points = 1 # Number of poisoning points to generate
# Should be chosen depending on the optimization problem
solver_params = {
'eta': 0.25, # step size of the gradient descent
'eta_min': 2.0,
'eta_max': None,
'max_iter': 100,
'eps': 1e-6 # tolerance of the stop criterion
}
from secml.adv.attacks import CAttackPoisoningSVM
pois_attack = CAttackPoisoningSVM(classifier=clf,
training_data=tr,
val=val,
lb=lb, ub=ub,
solver_params=solver_params,
random_seed=random_state)
pois_attack.n_points = n_poisoning_points
# Run the poisoning attack
print("Attack started...")
pois_y_pred, _, pois_points_ds, _ = pois_attack.run(ts.X, ts.Y)
print("Attack complete!")
# Evaluate the accuracy of the original classifier
acc = metric.performance_score(y_true=ts.Y, y_pred=clf.predict(ts.X))
# Evaluate the accuracy after the poisoning attack
pois_acc = metric.performance_score(y_true=ts.Y, y_pred=pois_y_pred)
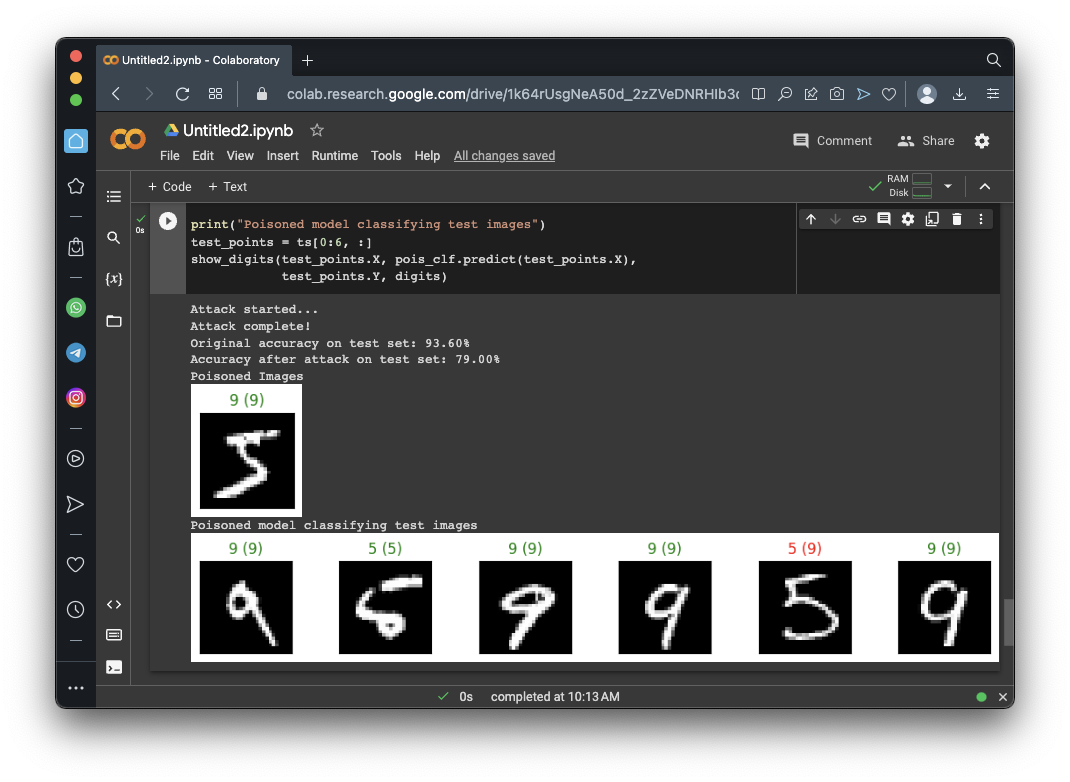
print("Original accuracy on test set: {:.2%}".format(acc))
print("Accuracy after attack on test set: {:.2%}".format(pois_acc))
# Training of the poisoned classifier for visualization purposes
pois_clf = clf.deepcopy()
pois_tr = tr.append(pois_points_ds) # Join the training set with the poisoning points
pois_clf.fit(pois_tr.X, pois_tr.Y)
print("Poisoned Images")
show_digits(pois_points_ds.X, pois_clf.predict(pois_points_ds.X),
pois_points_ds.Y, digits)
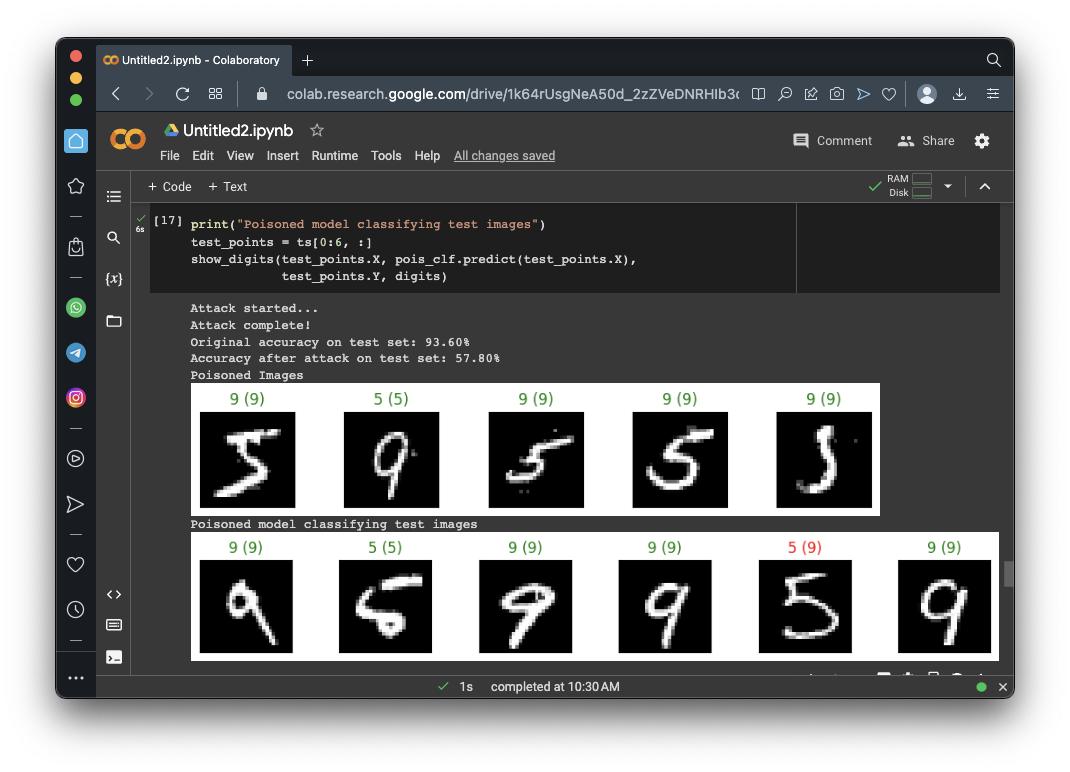
print("Poisoned model classifying test images")
test_points = ts[0:6, :]
show_digits(test_points.X, pois_clf.predict(test_points.X),
test_points.Y, digits)
Flag ML 111.1: Incorrect Predictions (10 pts)
For the poisoned model above, find the results for the first 25 test images. Find all the incorrect predictions (the number in parentheses) and concatenate their values.For example, the image above shows that one of the first six test images was incorrectly predicted to be 9. If there were three such images in the first 25 test images, and no other errors, the result would be 999.
That concatenated number is the flag.
Flag ML 111.2: Poisoning Five Images (10 pts)
Change the attack above to poison five images, as shown below.Construct the flag from the first 25 test images as you did in the previous flag.
Flag ML 111.3: Optimizing eta (10 pts)
Run the poisoning attack with 30 poisoning images. Try these values of eta: 0.02, 0.05, 0.10, 0.15, 0.25, 0.5, 1.0, and 2.0. Record the accuracy of the poisoned model on the test set for each case.Use the most effective value of eta--that is, the one that reduces the accuracy the most. Construct the flag by concatenating the incorrect predictions for the first 15 images in the test set.
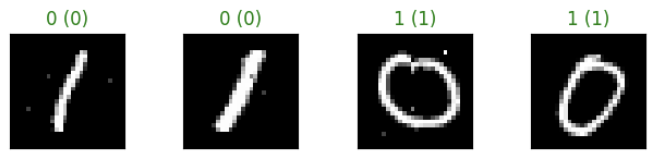
Flag ML 111.4: Different Digits (10 pts)
Make these changes:The accuracy after the attack on the test set should be 59.00%.
- Use 200 training samples
- Use 400 validation and test set samples
- Use the digits 1 and 0
- Use 50 poisoning images
- Use eta 0.25
The first four modified images are shown below.
Construct the flag by concatenating the incorrect predictions for the first 15 images in the test set.
Posted 5-8-23
Flag number fixed 12-13-23
Explanation of flag 1 and flag 4 augmented 7-25-24
Jupyter server note added 5-15-25