Project 8: ExploitMe Mobile Lab 7: Scraping Data from RAM (15 points)
What You Need for This Project
- A computer with Android Studio installed
- An Android device running in VirtualBox, which you prepared in a previous project
- The server which you prepared in a previous project
Purpose
To examine the Android log, and
control logging of sensitive data.
Using the Patched App
For this project, continue using
the patched App you prepared in
the previous project.
You can use either the original
app or the one you changed to
store the Statements in a
more private folder and to
avoid logging sensitive data.
Standard Setup Tasks
These steps duplicate the setup
youi had in the previous lab.
They are repeated here for convenience.
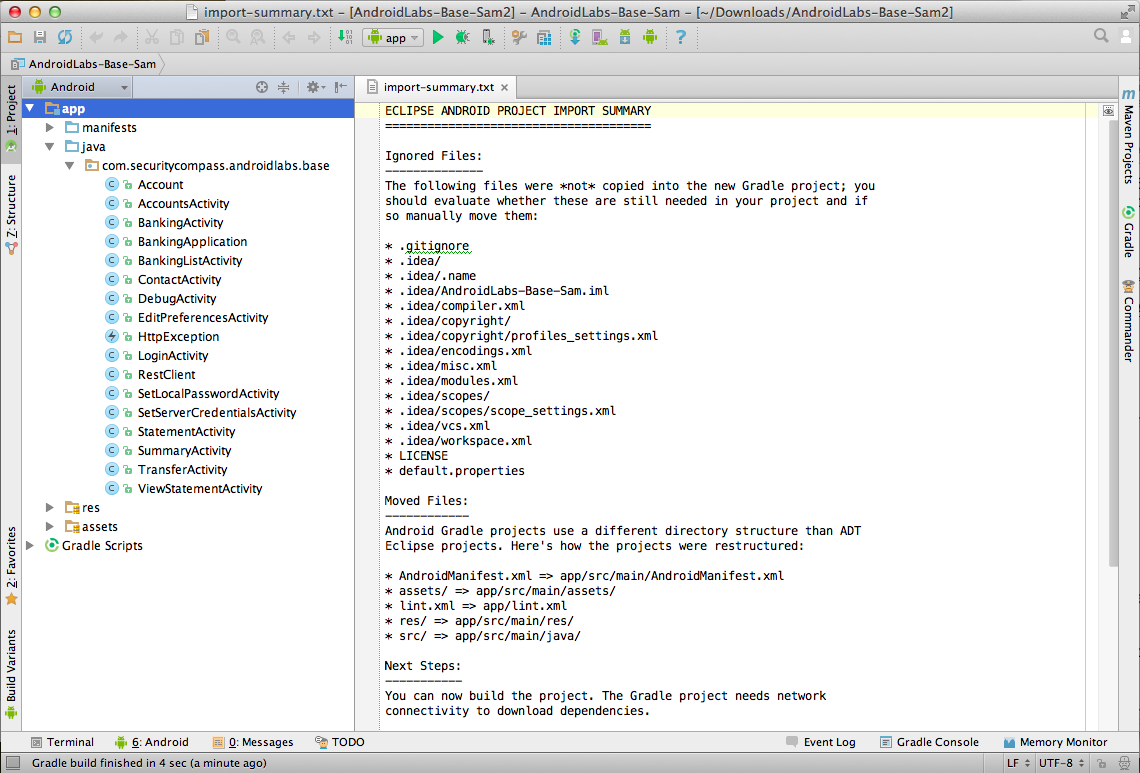
Start Android Studio
Launch Android Studio.
The "AndroidLabs-Base-Sam" project
should be loaded,
as shown below.
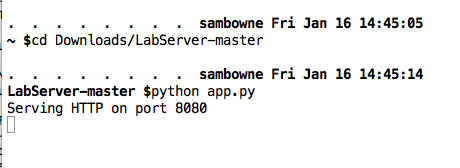
Start the Server
You should have the server app running,
listening on port 8080,
as shown below.
Adjusting Network Settings
You should have your network
set to Bridged mode from
the previous project.
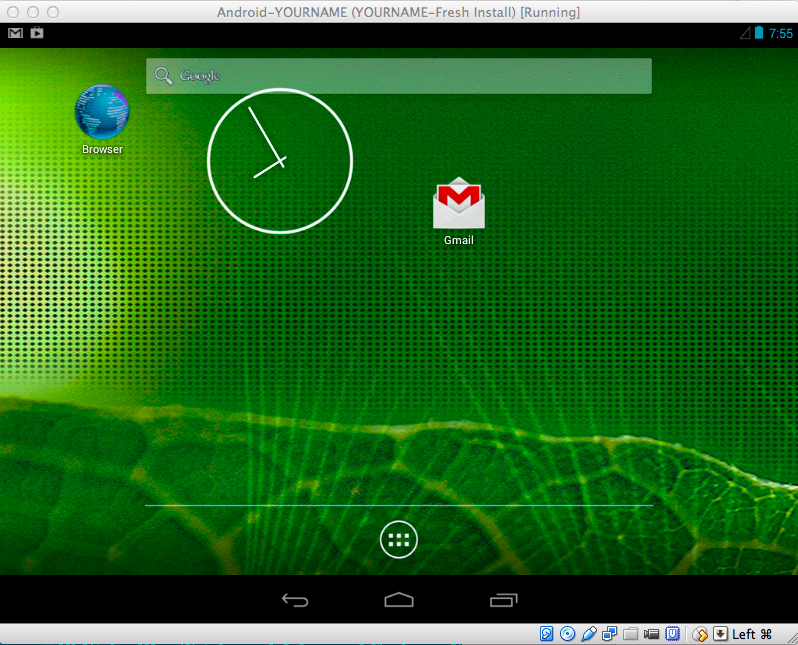
Start the Virtual Device
Start your
Android virtual machine.
Swipe the padlock to the right
to get to the Home screen,
as shown below.
Finding your Android Device's IP Address
Click in the Android virtual machine.
On a PC, press Alt+F1. On a Mac,
press fn+alt+F1.
A Terminal window opens.
Execute this command,
as shown below.
netcfg
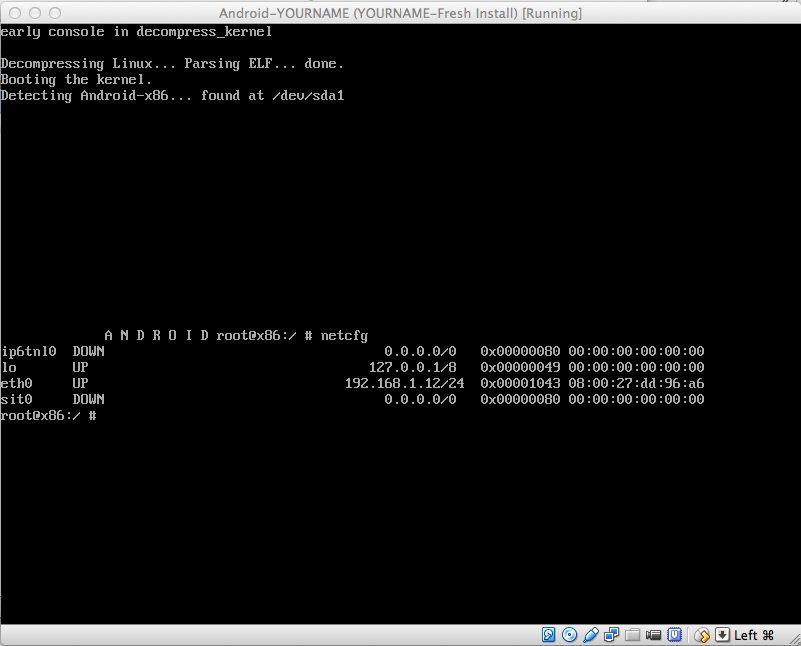
The Android device's IP address
is shown in the "eth0" row. When
I did it, my address was
192.168.1.12. Find your address
and make a note of it.
In the Android device,
on a PC, press Alt+F7. On a Mac,
press fn+alt+F7.
The Terminal window vanishes and you
are back to the Android home page.
Finding your SDK Path
In Android Studio,
click Tools,
Android, "SDK Manager.
Android SDK Manager opens,
as shown below.
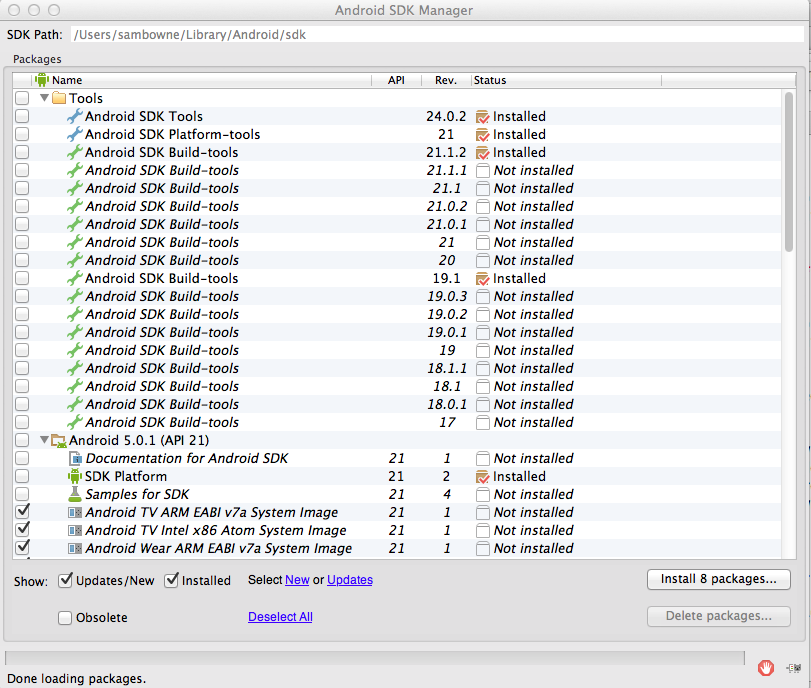
At the top of this window,
the SDK Path is shown. On my
machine, the path is
/Users/sambowne/Library/Android/sdk
Find your SDK path and make a note
of it.
Connecting with Android Debug Bridge
On your host machine, open a Terminal
or Command Prompt window.
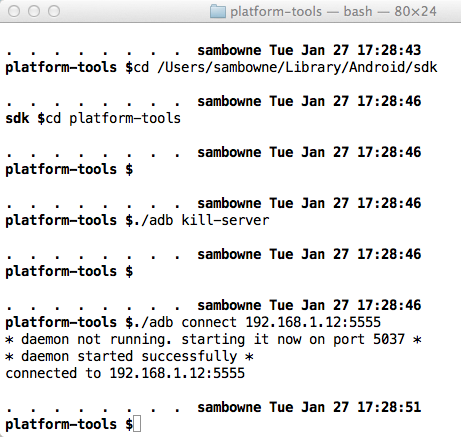
Execute these commands, changing
the path in the first command to your
correct SDK path, and the IP address in
the last command to the IP address
of your Android device:
cd /Users/sambowne/Library/Android/sdk

cd platform-tools

./adb kill-server

./adb connect 192.168.1.12:5555
You should see the message
"connected to..",
as shown below.
Running the Vulnerable App
In your Android device,
click the circle icon. In APPS,
click EMM - Vulnerable.
The "EMM - Vulnerable" app appears
in the emulator, as shown below.
Resetting the App
At the lower right, click the
three-dot icon.
Two options appear:
"Reset" and "Preferences",
as shown below.
Click Reset.
Logging In
Now you see the "Enter the
LabServer bank credentials"
screen,
as shown below.
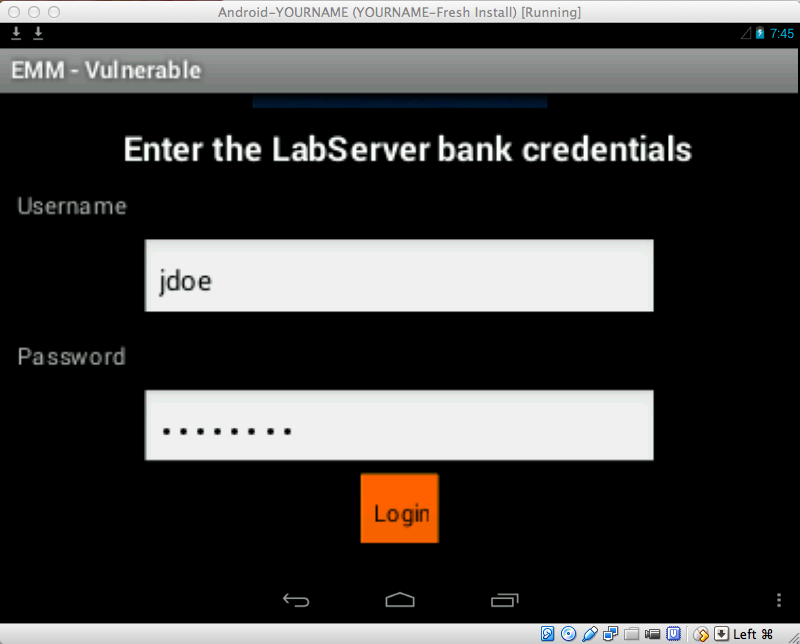
Log in with the credentials
jdoe and password
To scroll the screen down, you can
use the Tab key on the keyboard,
or use the mouse to drag the app
up.
Troubleshooting
If you can't log in, click the
three-dot icon and enter Preferences.
Change the Bank Service Address to the
IP address of your host machine.
|
When you have logged in,
you see the "Setup your
keylock..." screen,
as shown below.
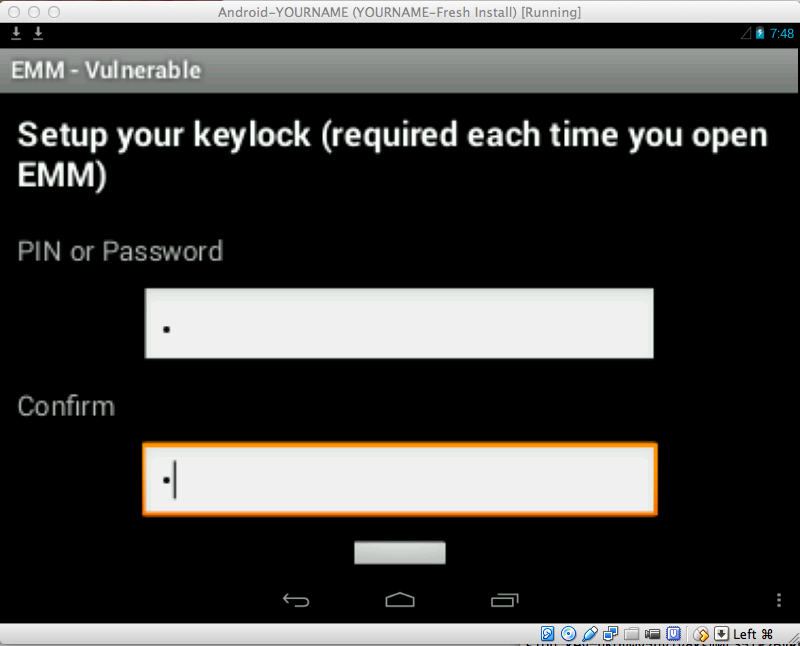
Enter a single-digit code, such as
1 in both fields and press
Enter twice.
|
New Tasks
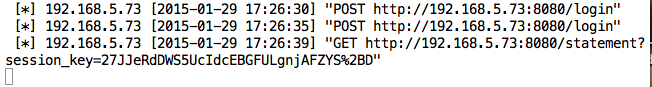
View the Session Key
In the Android device, click
Statements.
Look at the Terminal window running
the server. You can see your
Session Key,
as shown below.
Locking the App
In your Android device,
in the "EMM - Vulnerable" app,
click the envelope-shaped icon
at the bottom center.
The Home page opens.
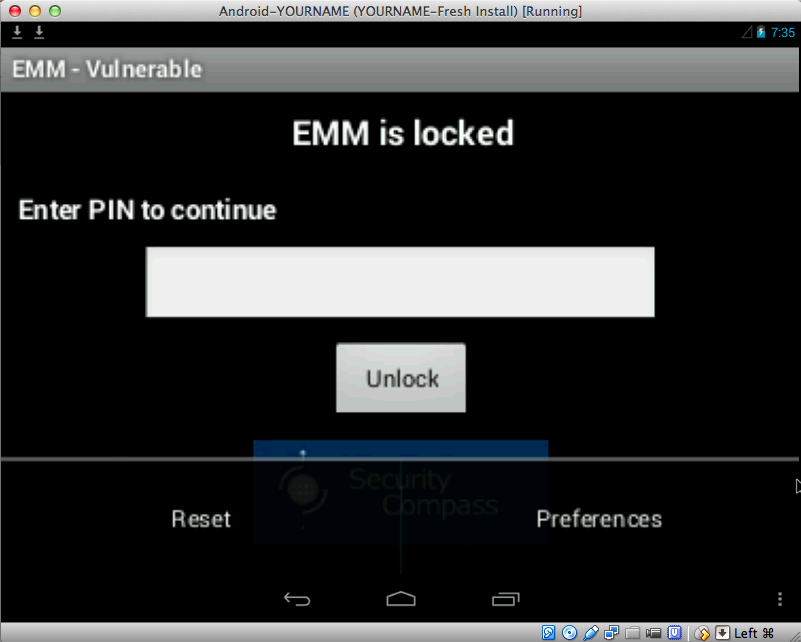
Click the circle. In APPS,
click "EMM - Vulnerable".
The lock screen appears,
as shown below.
As we will see, by scraping RAM, we can
bypass that lock screen.
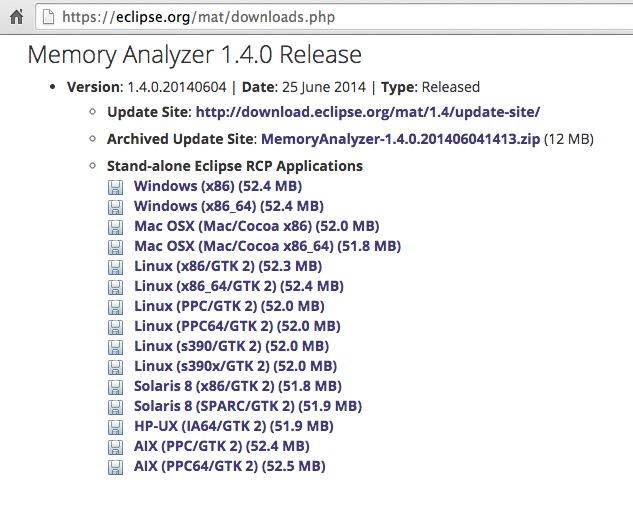
Install Eclipse Memory Analyzer
Go here:
https://eclipse.org/mat/downloads.php
Download "Memory Analyzer",
as shown below. The Mac OS X version was
56 MB when I did it.
Run the downloaded file.
The Mac version unzips to a folder
with an MemoryAnalyzer.app file,
and double-clicking that file launches
the app.
I suppose the Windows version requires a
standard installation process, but I
haven't tried it yet.
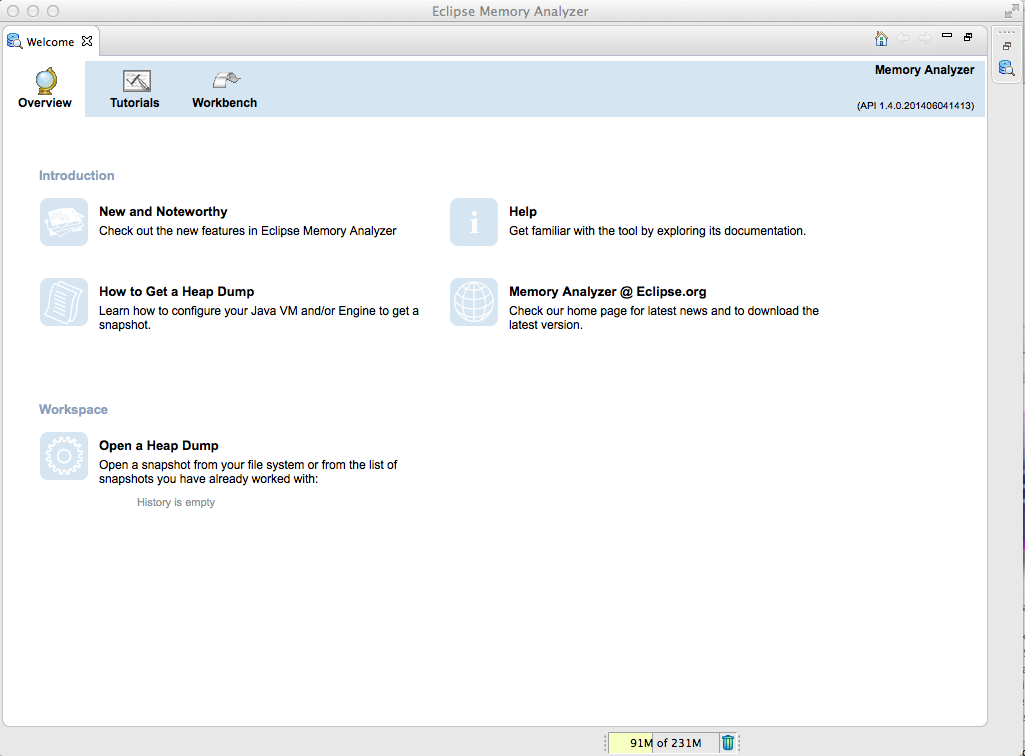
When Memory Analyzer starts, it looks
like this:
Capturing Heap Memory
In Android Studio, click Tools,
Android, "Android Device
Monitor".
In the top left pane, click
com.securitycompass.androidlabs.base
Click the third icon on the toolbar,
outlined in green in the image below.
This dumps the heap memory for the
selected process.
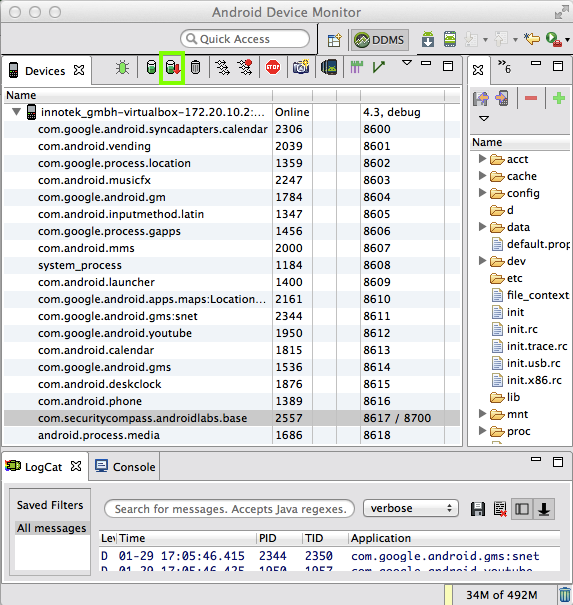
Save the "com.securitycompass.androidlabs.base.hprof" file on your desktop.
Rename it to YOURNAME.hprof (using your own name without
spaces instead of "YOURNAME").
Converting the File Format
This is not a JAVA formatted file,
so it must be converted first.
On your host machine, open a Terminal
or Command Prompt window.
Execute these commands, changing
the path in the first command to your
correct SDK path, and the paths in the third
commands to the correct path to your
desktop.
Note: in Windows, the desktop path is
like "C:\Users\student\Desktop"
cd /Users/sambowne/Library/Android/sdk

cd platform-tools

./hprof-conv ~/Desktop/YOURNAME.hprof ~/Desktop/YOURNAME-fixed.hprof
A YOURNAME-fixed.hprof file appears
on your desktop.
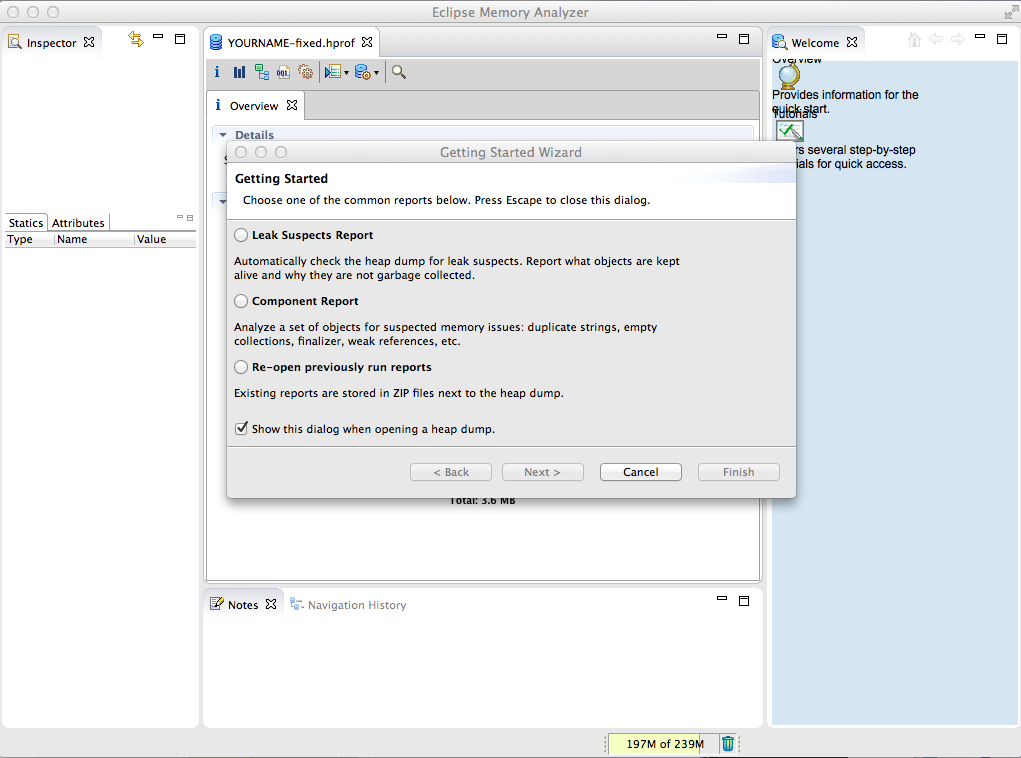
Analyzing the Memory Dump
In Eclipse Memory Analyzer, click
"Open a Heap Dump".
Navigate to the b>YOURNAME-fixed.hprof file
on your desktop and double-click it.
After the file finishes parsing, the
"Getting Started" box opens,
as shown below.
Click Cancel.
Troubleshooting
Sometimes Eclipse Memory Analyzer
seemed to freeze up, changing the
mouse to a four-part black and white
pie icon.
I found that closing applications
I no longer needed,
like the virtual Android device and
Android Studio,
made Memory Analyzer move again.
|
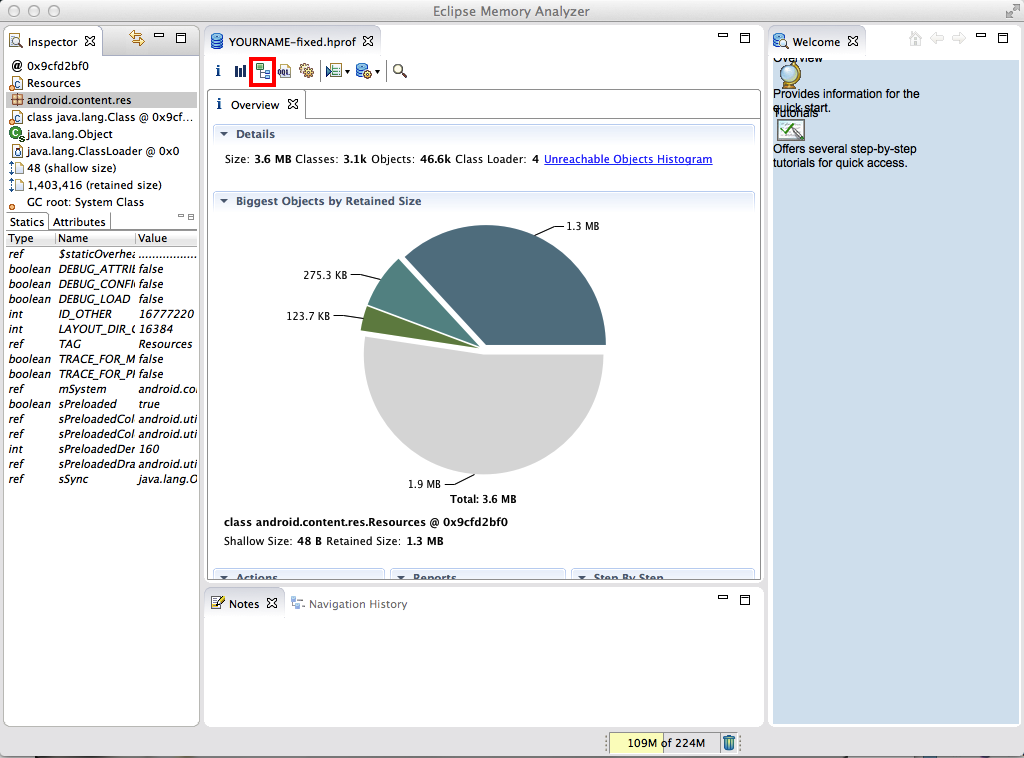
On the toolbar, click the third icon,
as outlined in red in the image below.
This is the "Denominator Tree" button.
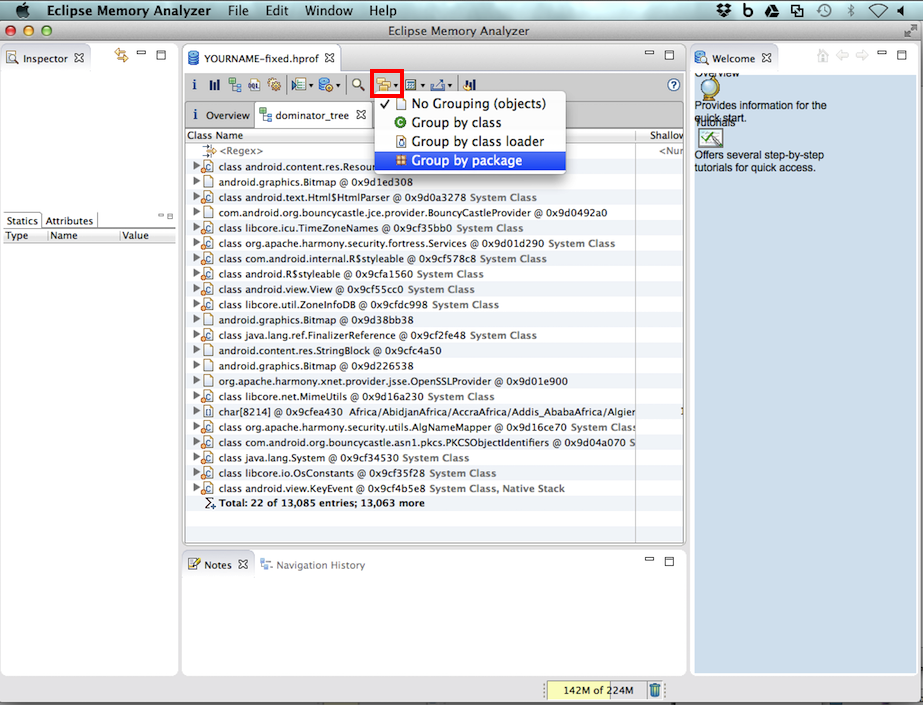
On the toolbar, click the icon showing three yellow
folders,
as outlined in red in the image below.
This is the "Group By" button.
Click "Group by package".
Expand com,
securitycompass,
androidlabds,
and base,
as shown below.
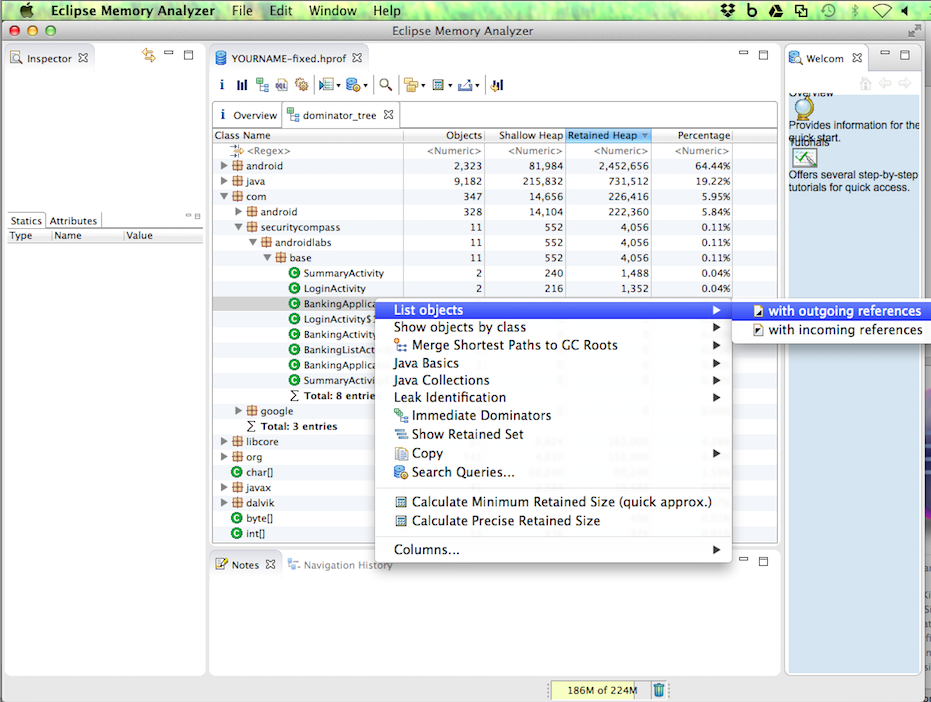
Right-click BankingApplication
and click
"List objects",
"With outgoing references",
as shown below.
In the top right, click the item
starting with
com.securitycompass.
On the left, the Session Key is visible,
as shown below.
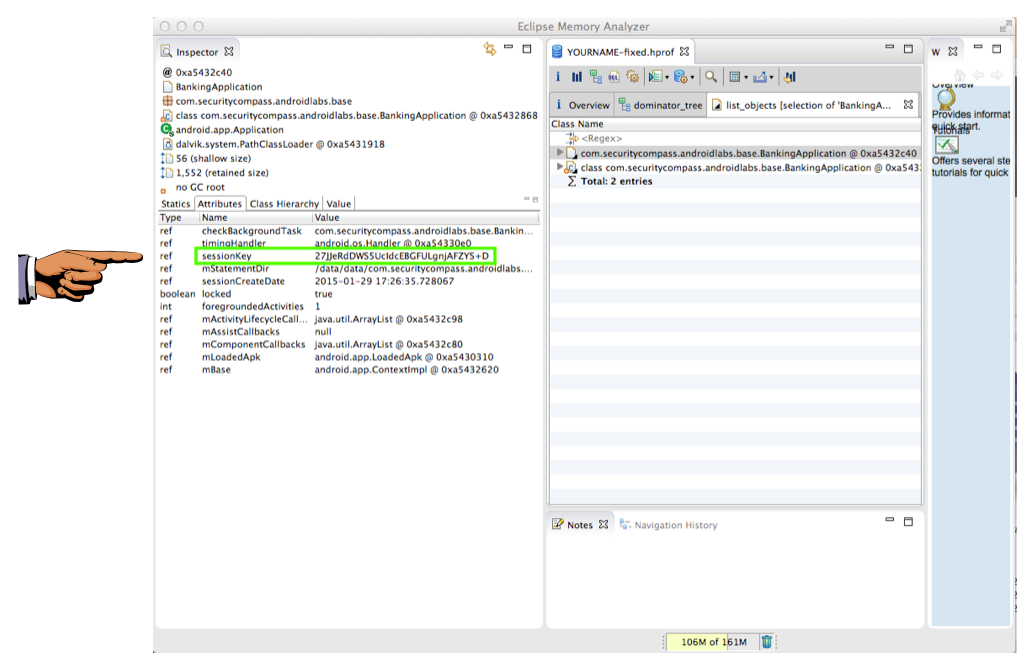
Saving a Screen Image
Make sure the sessionKey is visible, with a long value containing random letters and numbers,
as shown above.
Save a full-desktop image. On a Mac, press Commmand+3. On a PC, press Shift+PrntScrn and paste into Paint.
YOU MUST SUBMIT A FULL-SCREEN IMAGE FOR FULL CREDIT!
Save the image with the filename "YOUR NAME Proj 8", replacing "YOUR NAME" with your real name.
How Large is the Risk?
This attack requires physical access to
the device, at least the way we did it.
In principle, RAM scraper malware such
as used in the Target breach could harvest
such data.
We got a session key, which could be used
in cross-site request forgery attacks.
There are ways to lessen this risk, such as
using keys that include anti-CSRF tokens
so they cannot be re-used from another
device.
But it also makes sense to consider what your
app is storing in RAM, and minimize the
exposure of critical data like passwords
and credit card numbers.
This technique would be handy in a pen-test
to hijack sessions.
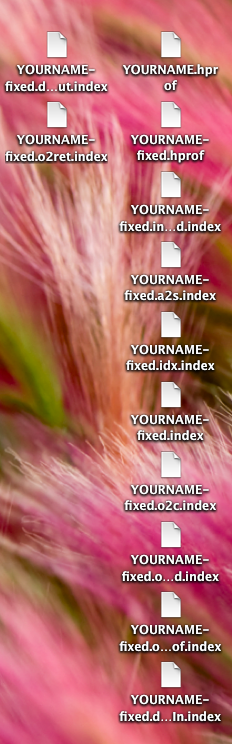
Cleaning Up your Desktop
Memory Analyzer makes a lot of files with your
name on them, as shown below.
Drag them into the trash.
Turning in your Project
Email the image to
to cnit.128sam@gmail.com with the subject line:
Proj 8 from YOUR NAME
Sources
ExploitMe Mobile Android Labs
Investigating Your RAM Usage
Last modified 3-25-15