Ubuntu 14.04.03 with Hopper
Size: 2,198,435,208 bytes
SHA256( Ubuntux64-14.04.3-Hopper.7z)= 11d4cf7d54aca0b2c9d559f0ce16cdcfc2be4996491a2ddaab845d272fb2458e
Installing Hopper
If you use the VM I put on Mega, hopper is already installed. If you prefer to install it yourself, I did it this way. Note: the official Hopper repository for Ubuntu does not work (as of 11-23-15) due to an invalid signature.I installed Ubuntu 14.04.03 x64 Desktop into a fresh VM. Then, in a Terminal window, I executed these commands:
sudo apt-get updatesudo apt-get upgrade -y
sudo apt-get dist-upgrade -y
sudo apt-get install build-essential -y
sudo apt-get install git subversion autoconf automake cmake libffi-dev libxml2-dev libgnutls-dev libicu-dev libblocksruntime-dev libkqueue-dev libpthread-workqueue-dev autoconf libtool clang -y
cd /tmp
curl http://www.hopperapp.com/HopperWeb/downloads/hopperv3-3.11.2.deb > hopperv3-3.11.2.deb
sudo dpkg -i hopperv3-3.11.2.deb
Log in with these credentials:
In a Terminal window, execute these commands:
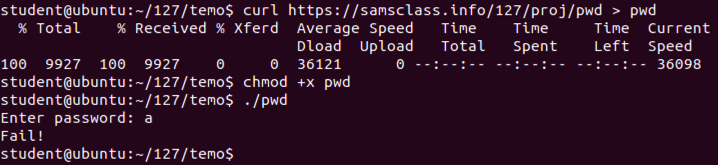
Enter a password of a and press Enter.curl https://samsclass.info/127/proj/pwd > pwd chmod +x pwd ./pwd
The program exits normally, wth the "Fail!" message, as shown below.
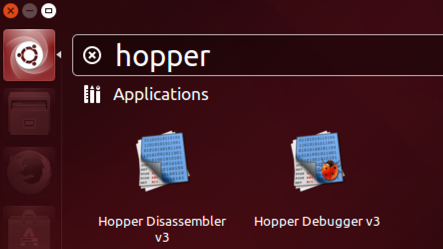
In the search field, type
In the search results, click "Hopper Disassembler v3", as shown below.hopper
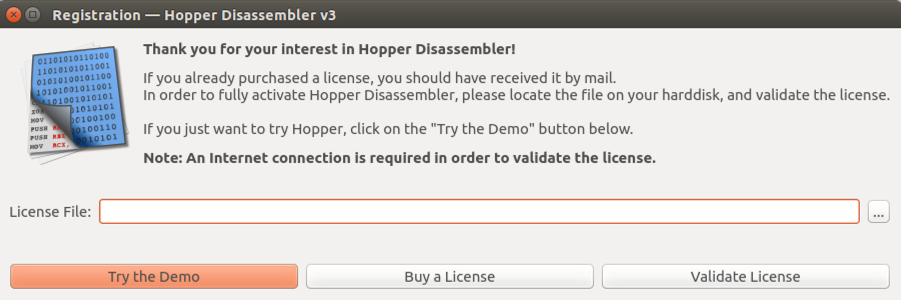
In the "Registration" box, click "Try the Demo", as shown below.
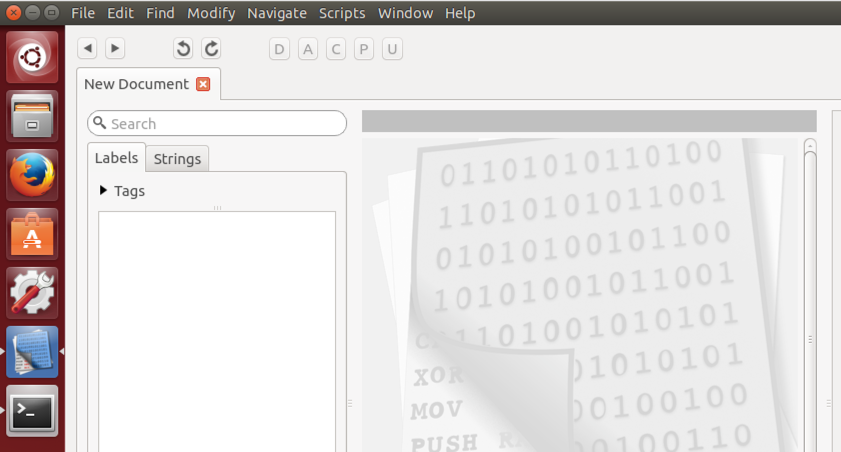
Hopper opens. Move the mouse into the dark gray bar at the top, and the menu items will appear, starting with "File", "Edit", and "Find", as shown below.
From the Hopper menu bar, click File, "Read Executable to Disassemble...".
Navigate to the pwd file you created above and double-click it.
In the "Read Executable" box, click OK.
You see the Hopper main window, as shown below.
Restarting Hopper
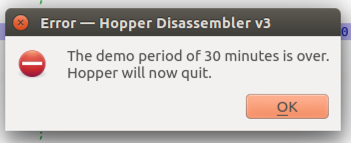
Every 30 minuntes, Hopper will die, just to irritate you into paying $90, with the message shown below.
When this happens, do these things:
Click OK.
From the Ubuntu desktop, at the top left, click the square reddish Search button.
Click "Hopper Disassembler v3".
In the "Registration" box, click "Try the Demo".
From the Hopper menu bar, click File, "Read Executable to Disassemble...".
Navigate to the pwd file you created above and double-click it.
In the "Read Executable" box, click OK.
The first pass looks at the code as a series of Assembly Language instructions. This is the most basic function of a disassembler.
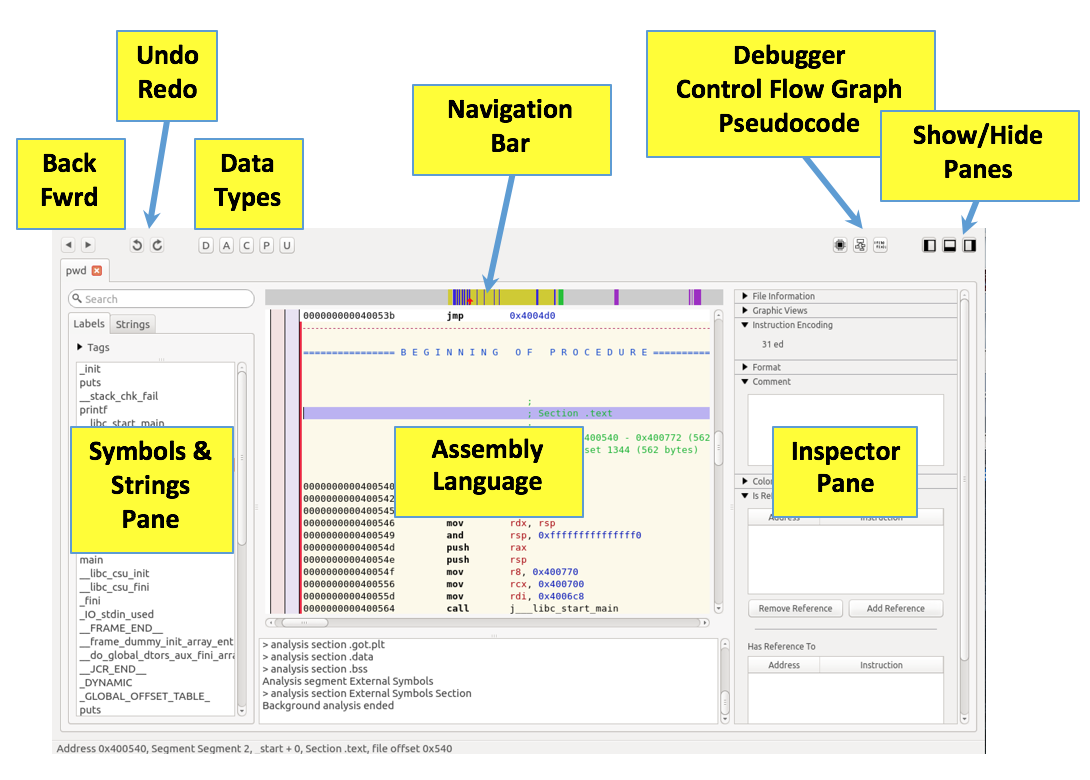
Now, finally, the whole window is available for assembly code, as shown below.
On the right edge, drag the scroll bar to the top. Click the very first line to select it.
The red arrow in the Navigation Bar is now at the left edge, as shown below.
In the Navigation bar, drag the little red arrow to the first yellow stripe.
Code appears, with a yellow-shaded background behind it, as shown below.
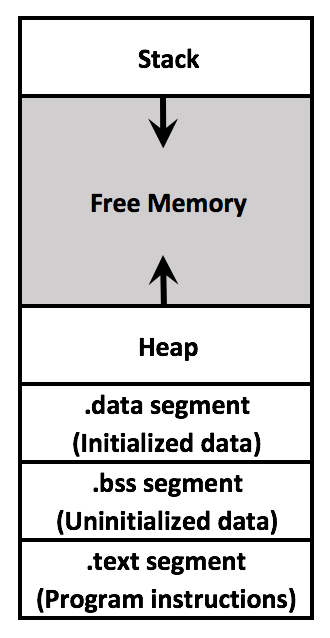
Notice these sections:
In the Preferences box, On the General tab, click "Show the hex column", as shown below.
Click OK.
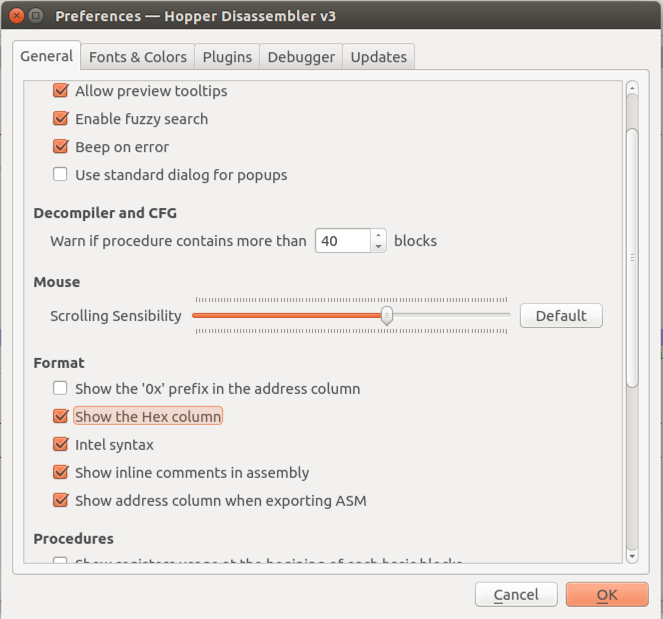
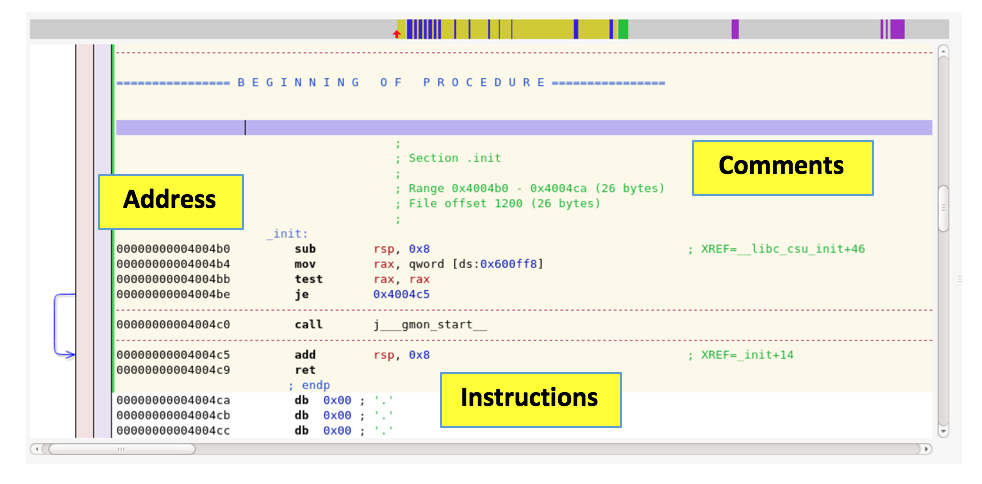
Now the hexadecimal version of each assembly instruction is visible, as shown below.
The regions with a white background above and below the yellow-shaded region are "Code" regions--they appear to be assembly instructions, but Hopper isn't sure what they are for.
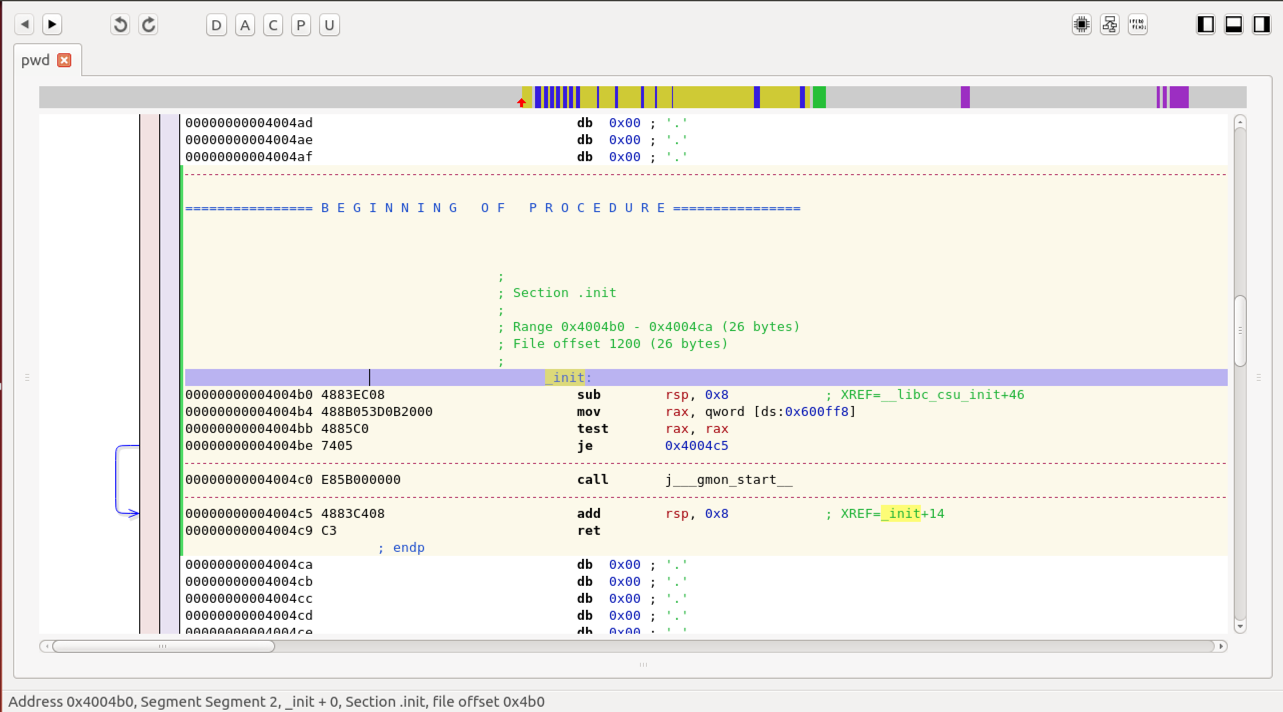
This section contains string constants, such as "Enter password" and "Fail!", as shown below.
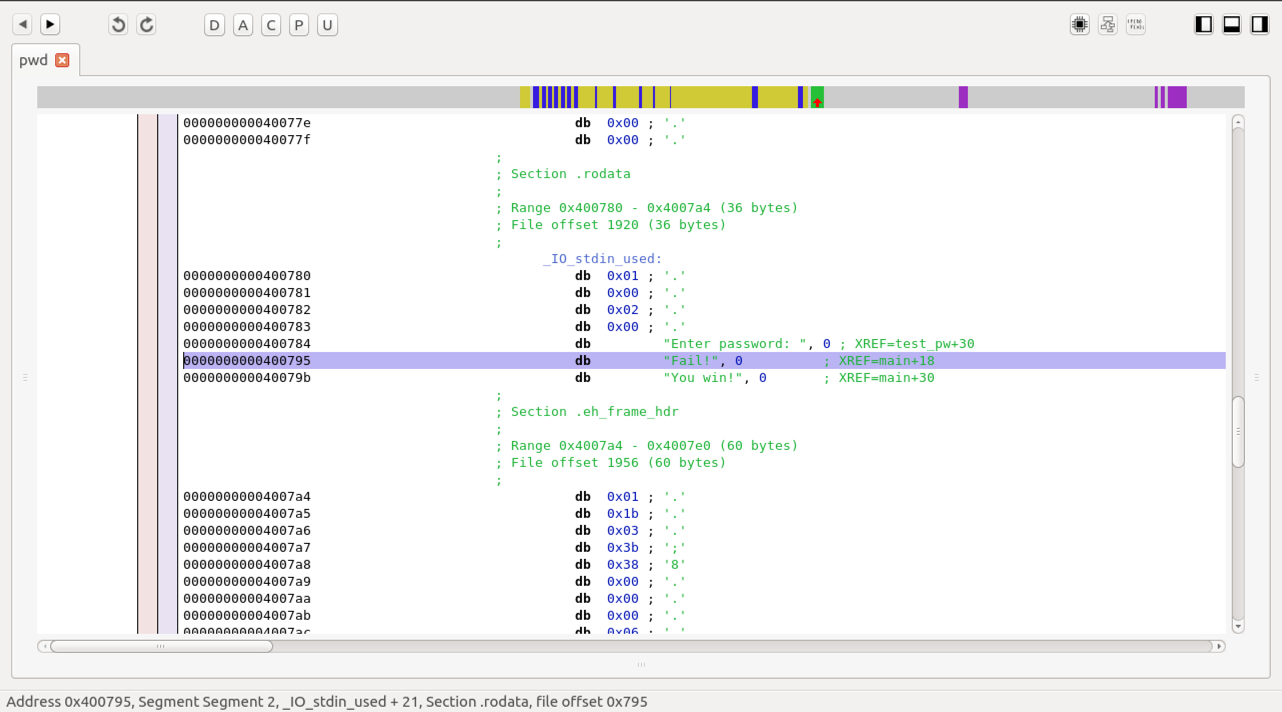
This section contains the Global Offset Table, which we have used before in exploitation, as shown below.
Press the PrintScrn key to copy the whole desktop to the clipboard.
YOU MUST SUBMIT A FULL-SCREEN IMAGE FOR FULL CREDIT!
Paste the image into Paint.
Save the document with the filename "YOUR NAME Proj 7xa", replacing "YOUR NAME" with your real name.
A "Segments" window appears, as shown below.
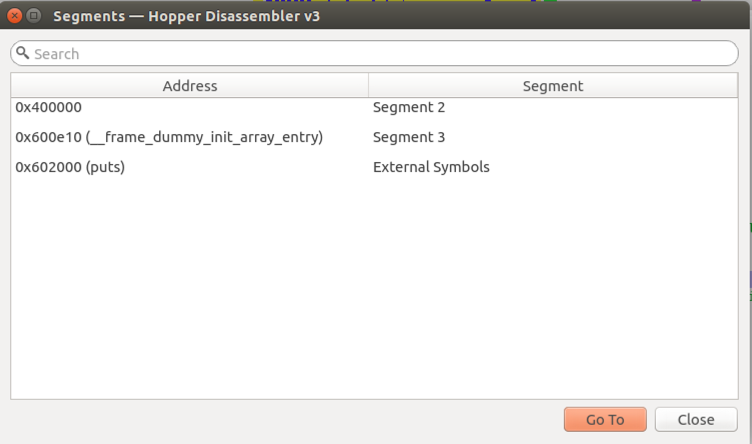
This isn't much use for understanding program flow, but you can see the start of the program in memory.
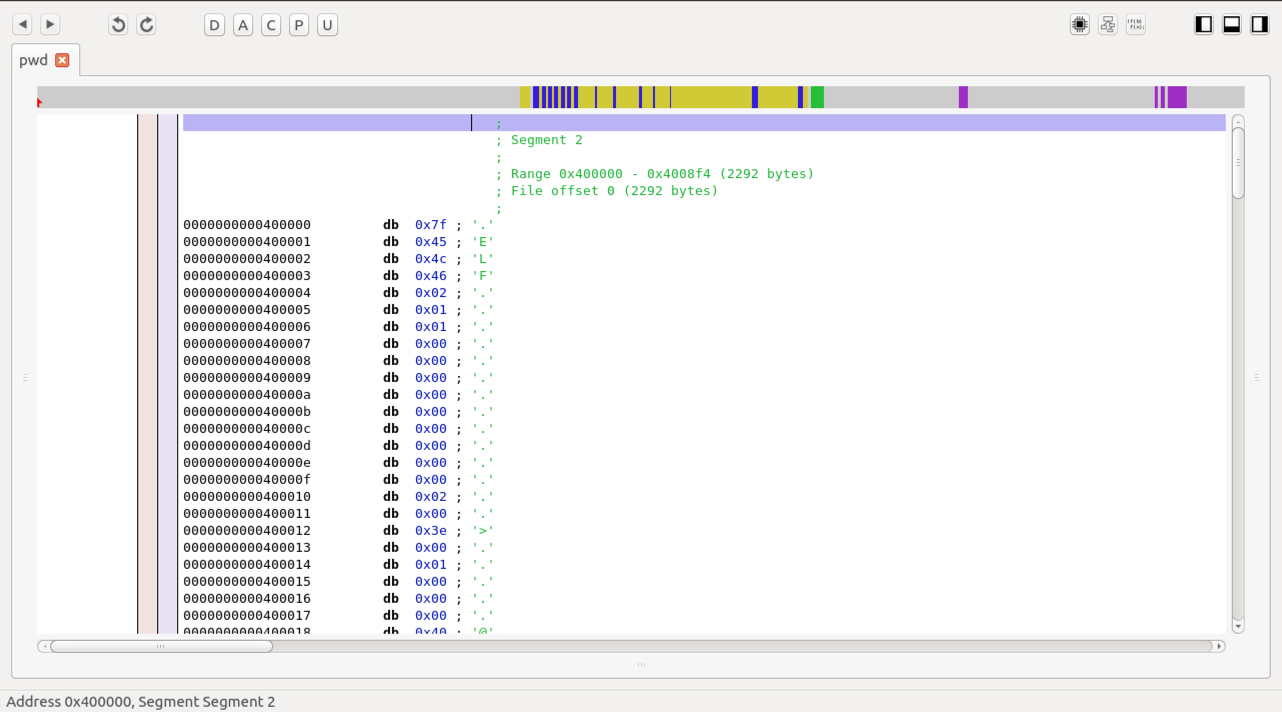
In the Segments box, click 0x400000 and click the "Go To" button.
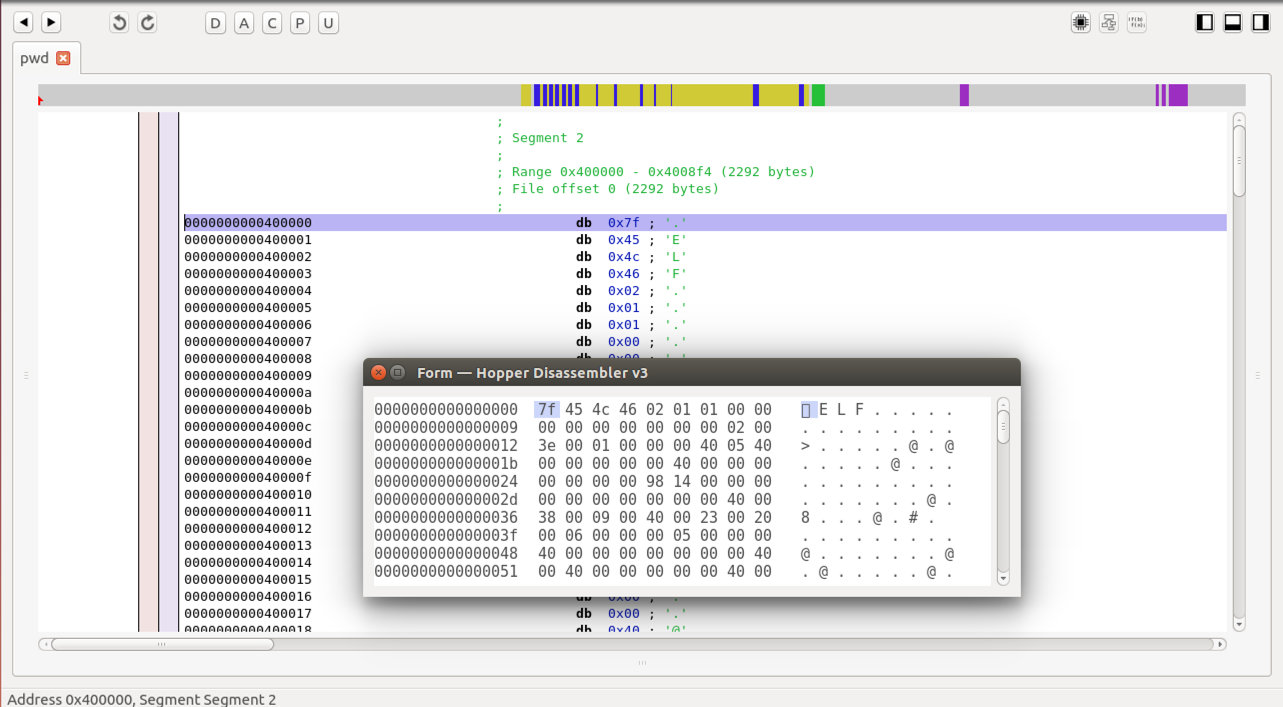
A series of bytes appears, beginning with ".ELF", as shown below.
To see the code in a more readable view, click Windows, "Show Hexadecimal Editor".
Close the "Form" window (the Hexadecimal Editor).
A "Sections" window appears, as shown below.
This has several familiar items in it:
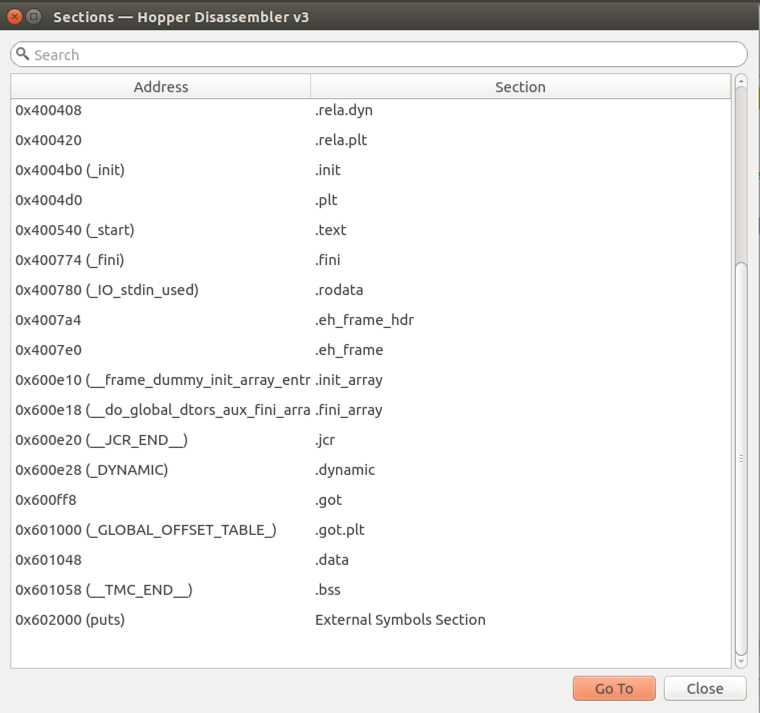
Close the "Sections" window.
On the left side, a list of friendly Labels appears.
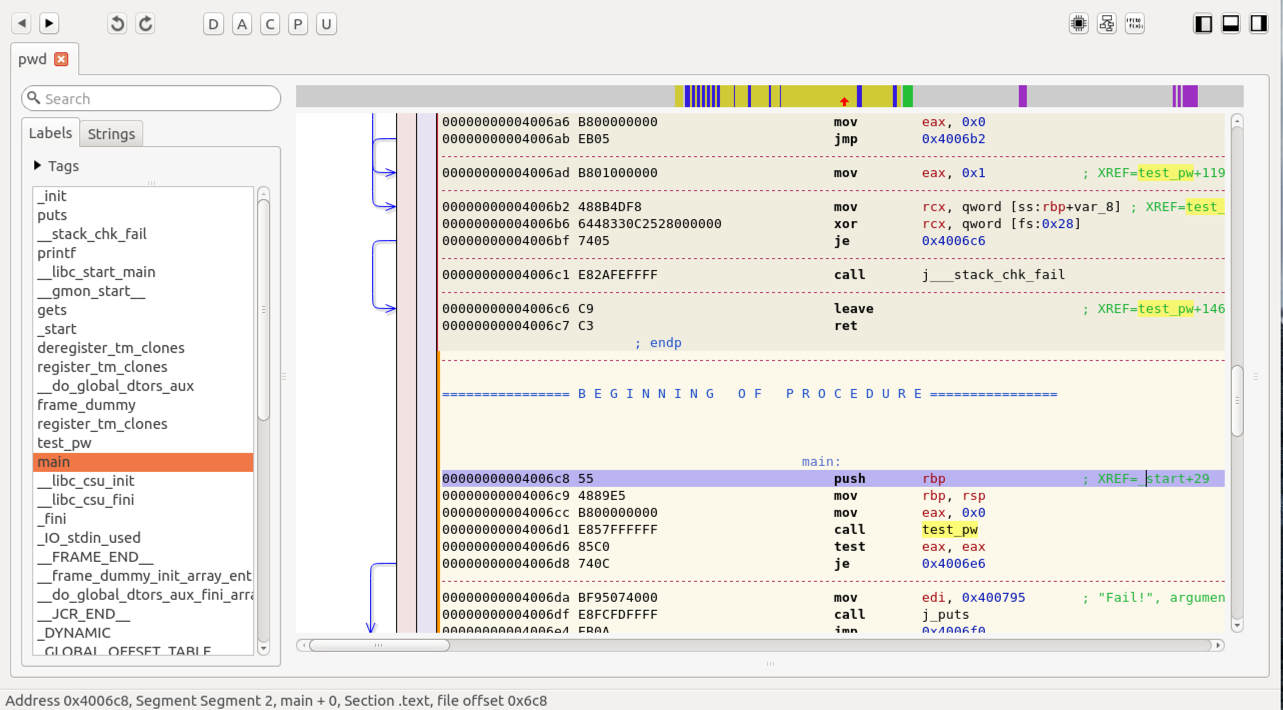
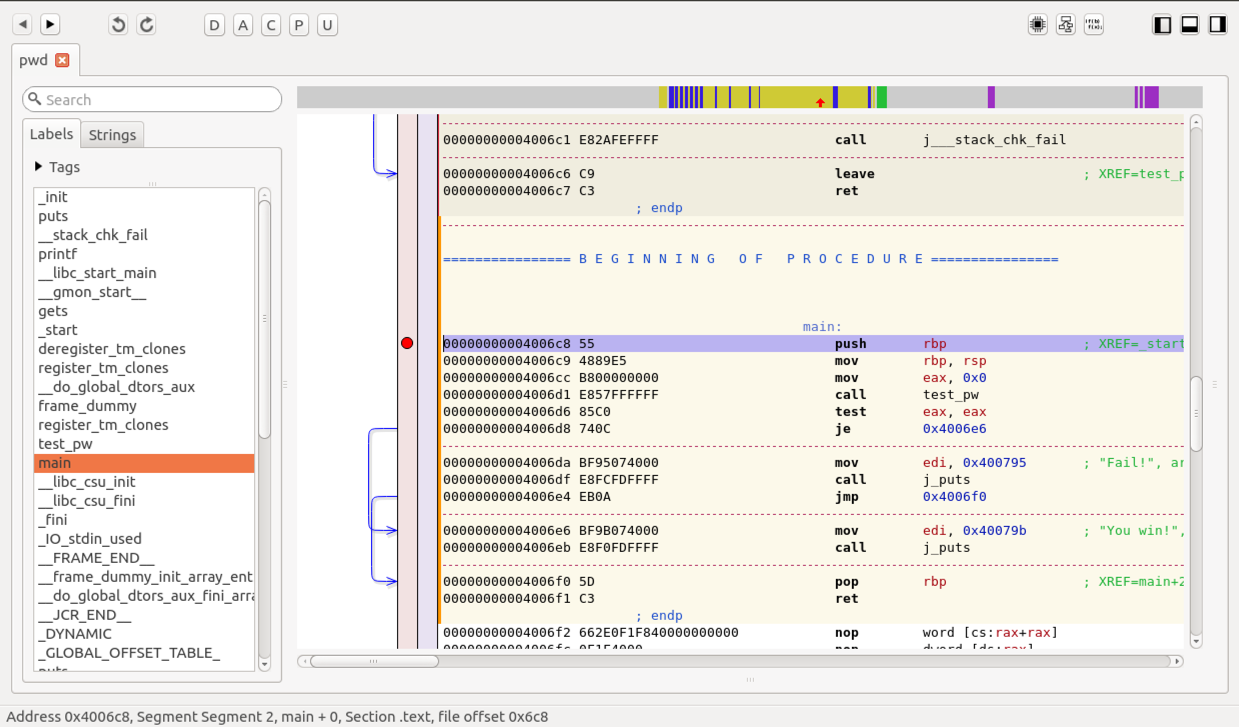
In the left pane, click main. The assembly code for the main() routine appears, as shown below.
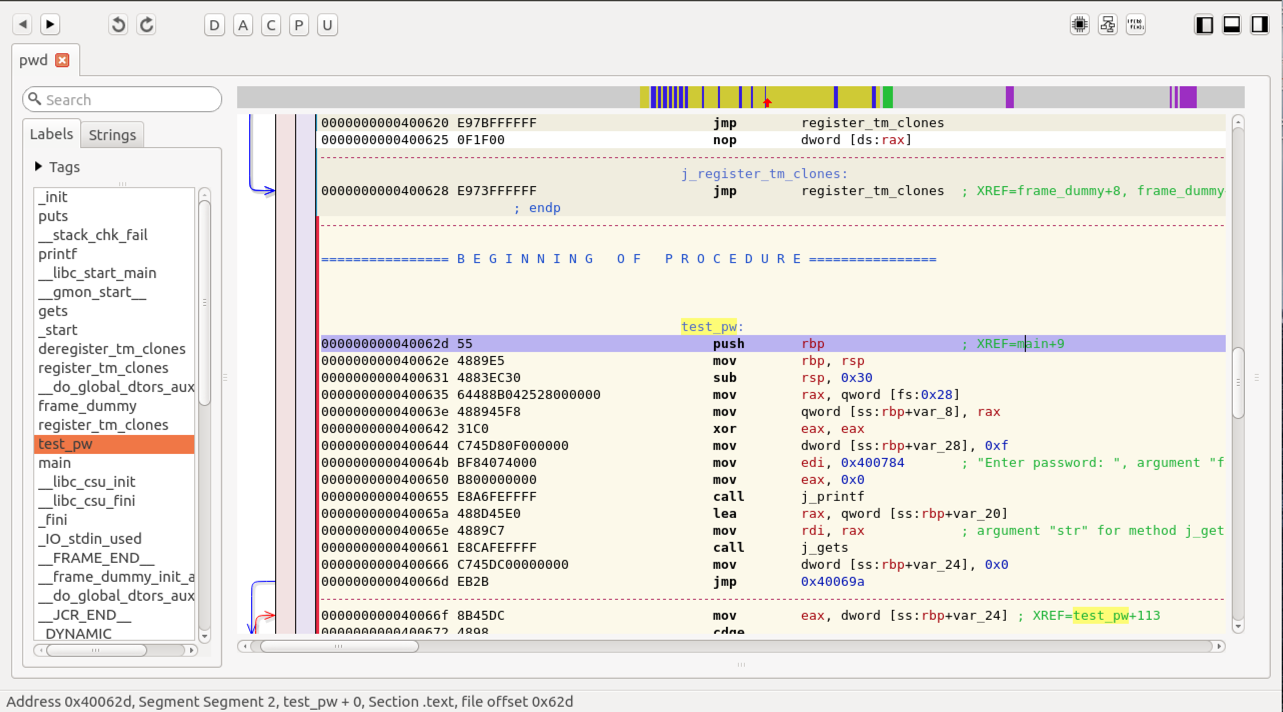
In the left pane, click test_pw. The assembly code for the test_pw() routine appears, as shown below.
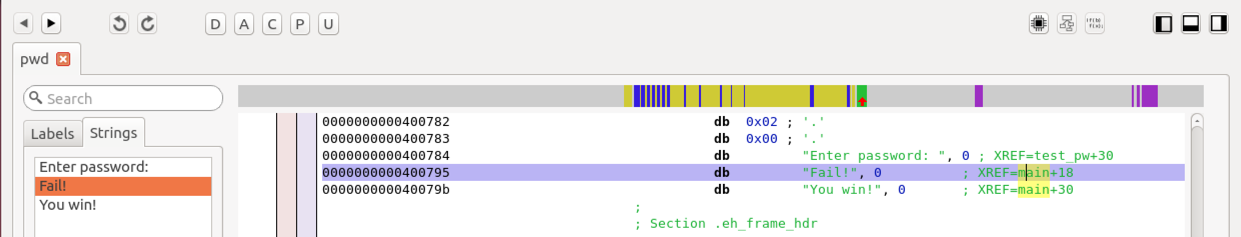
Click Fail!.
The right pane shows the ASCII string "Fail!", as shown below.
Suppose we want to trick the code into accepting any password, and not printing "Fail!". We'd like to see the code that uses the string "Fail!".
In the right pane, to the right of the word "Fail!", there is a comment beginning with XREF=. Double-click the "main+18 text. The code appear in main() that prints "Fail!", as shown below.
At the top right of Hopper, click the "Control Flow Graph" button, as outlined in red in the image below.
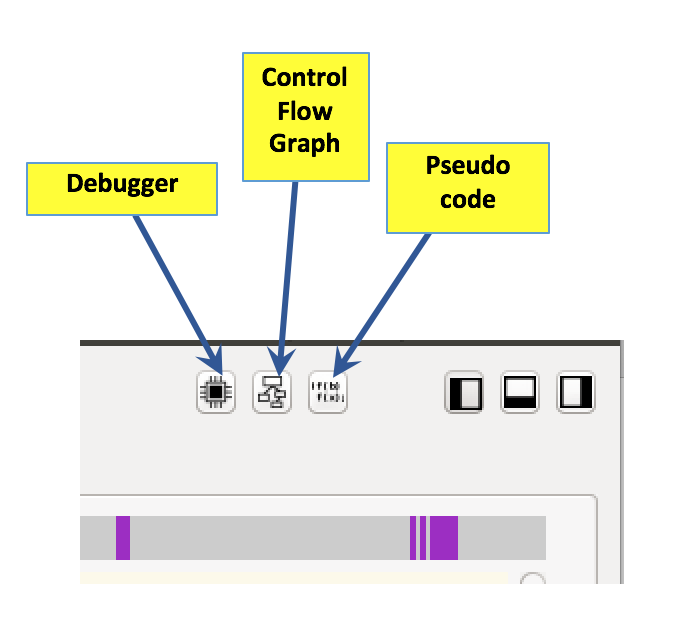
The Control Flow Graph appears, as shown below.
It shows that main calls a subroutine named test_pw, then tests the return value, and jumps to one of two puts calls to print messages.
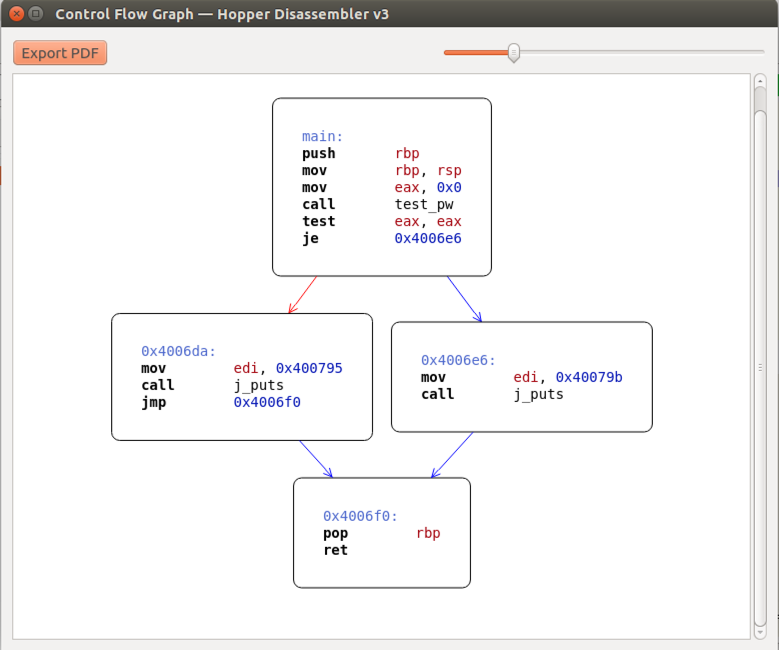
The Control Flow Graph is pretty, but it doesn't show which choice prints "Win!" and which prints "Fail!".
Close the Control Flow Graph.
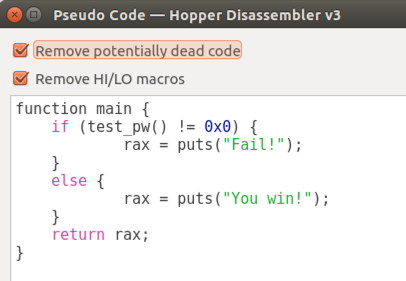
The Pseudocode window appears, containing code written in a C-like language, as shown below.
This is much easier to read! It shows that the program prints "You win!" when test_pw returns zero.
Close the Pseudocode window.
On the right side, in the line containing "Fail!", in the "XREF" note, as outlined in red in the image below, double-click the green main+18 address.
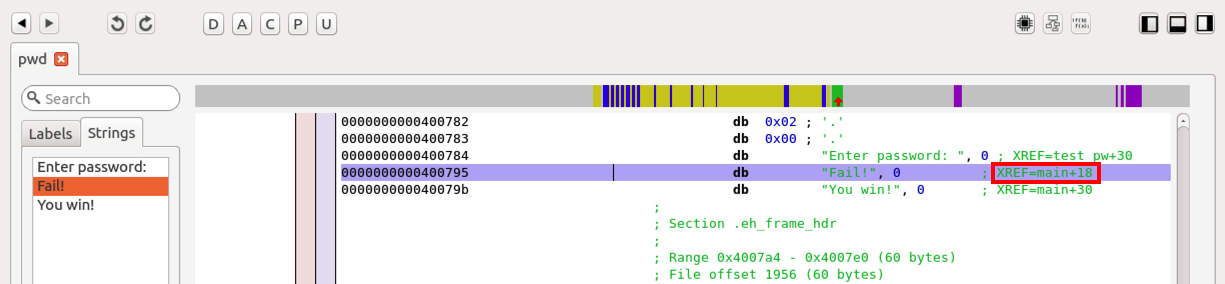
The assembly code that uses that string appears, as shown below.
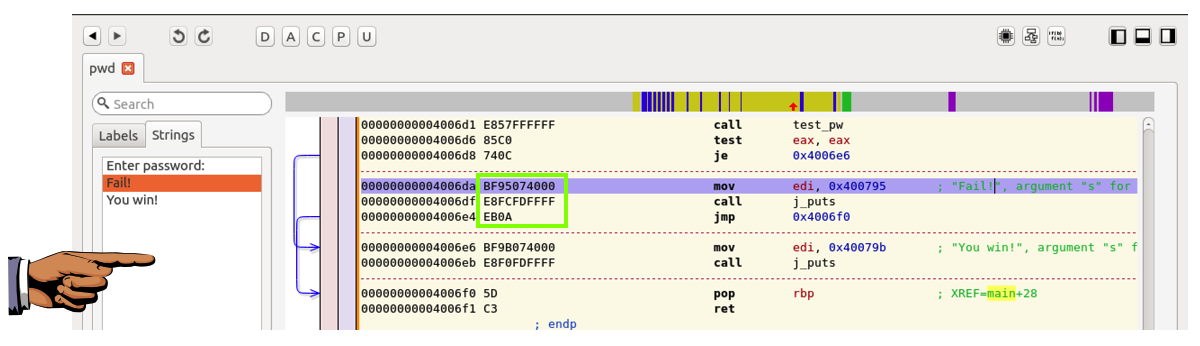
\ Now the assembly code is easier to understand. Starting at address 4006d1, the code calls test_pw. It then uses test to see if the return value is zero. If it is, it jumps to location 4006e6 and prints "You Win!". Otherwise it doesn't jump, and prints "Fail!".
So a simple way to make the program accept any password is to fill the bytes outlined in green below with NOPs.
Press the PrintScrn key to copy the whole desktop to the clipboard.
YOU MUST SUBMIT A FULL-SCREEN IMAGE FOR FULL CREDIT!
Paste the image into Paint.
Save the document with the filename "YOUR NAME Proj 7xb", replacing "YOUR NAME" with your real name.
Close Hopper.
Enter the password student when you are prompted to.apt-get install hexedit -y
In a Terminal window, execute these commands to copy the pwd executable to a new file named pwd2, and open it in the hexedit hex editor:
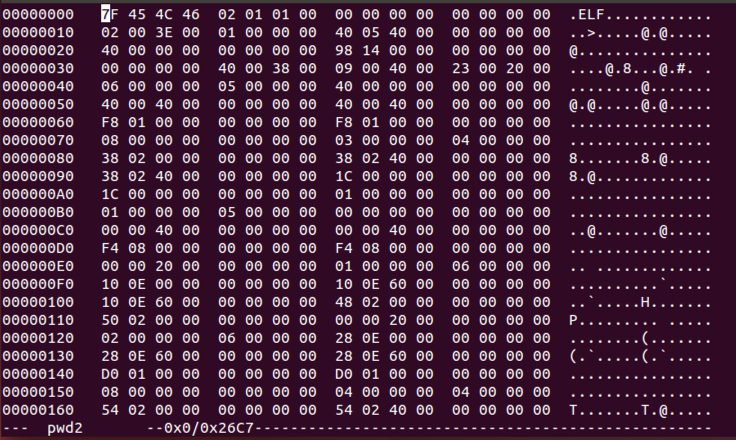
The binary opens in hexedit, as shown below.cp pwd pwd2 hexedit pwd2
The first four characters are .ELF, shown on the right side in ASCII.
In hexedit, press Ctrl+S.
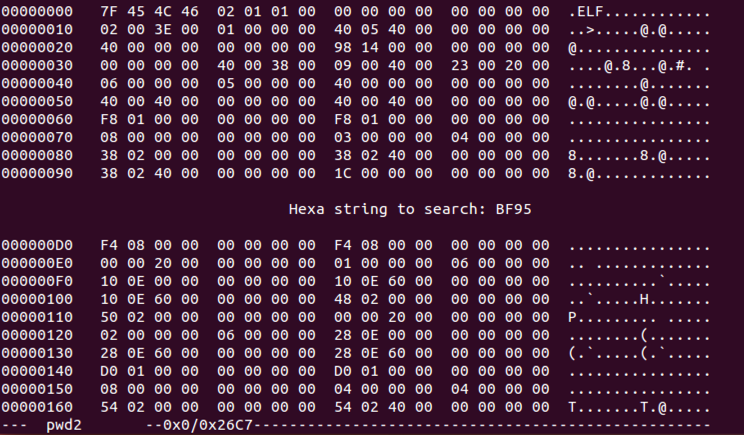
Enter this "hexa string":
Press Enter.BF95
The cursor moves to location 6DA, as shown below.
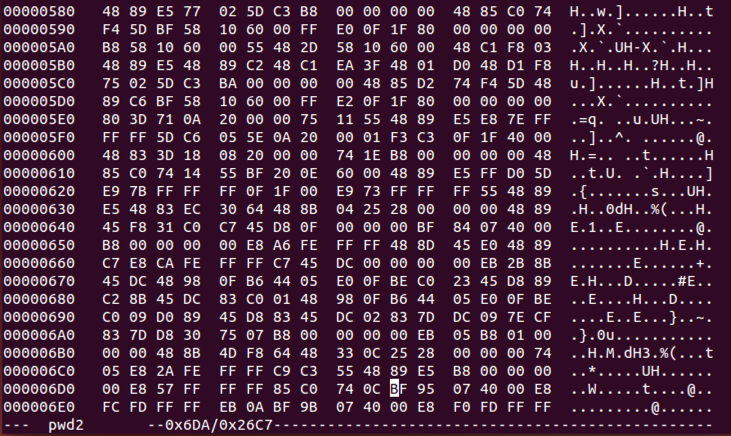
Carefully type 90 over twelve bytes, as shown below.
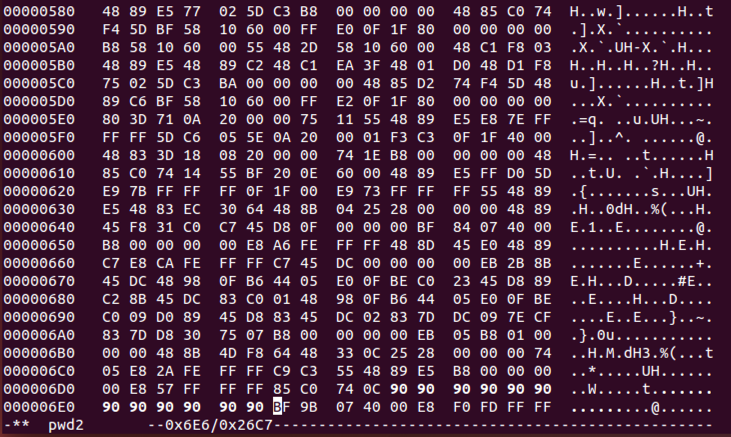
To save the file, press Ctrl+X, Y, Enter.
In a Terminal window, execute this command to run the file:
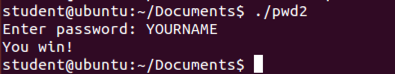
Enter any password, such as YOURNAME. You win, as shown below../pwd2
In the search field, type
In the search results, click "Hopper Debugger v3", as shown below.hopper
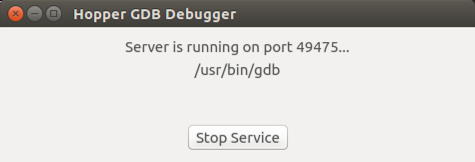
A box appears, saying "Server is running..." as shown below.
Leave this box open.
In the "Registration" box, click "Try the Demo".
Hopper opens. From the Hopper menu bar, click File, "Read Executable to Disassemble...".
Navigate to the pwd file you created above and double-click it.
In the "Read Executable" box, click OK.
In the "Symbols & Strings" pane, on the Tags tab, click main.
In the right pane, in the reddish vertical stripe, next to the first instruction in main, click the mouse. A red dot appears, showing that this is now a breakpoint, as shown below.
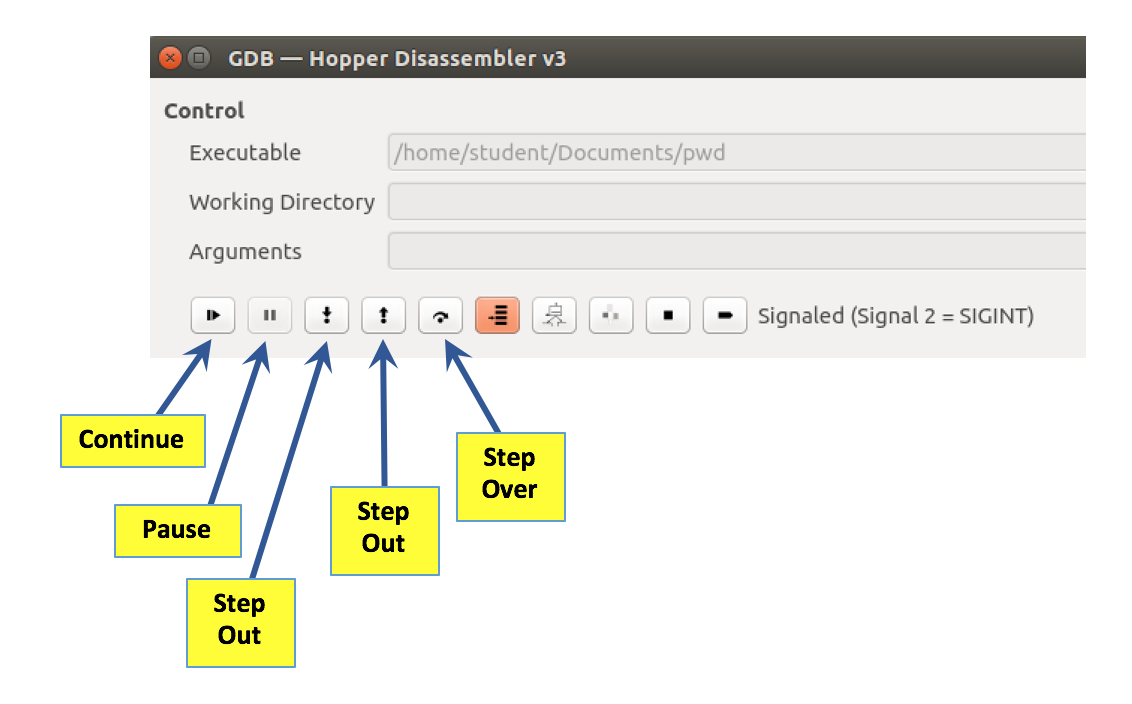
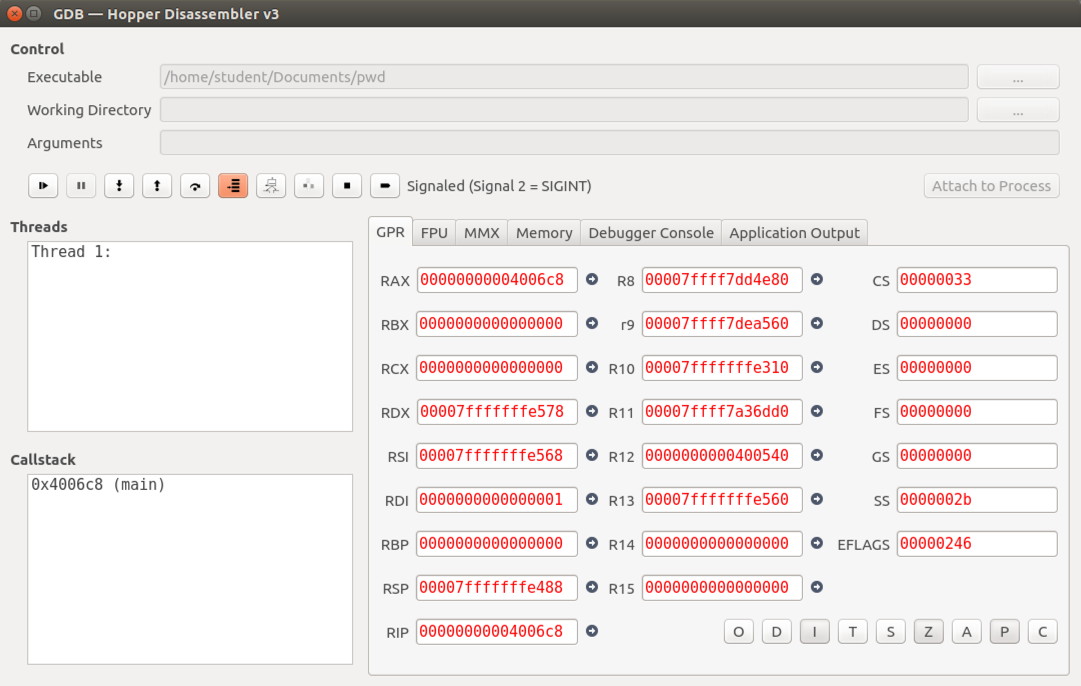
A GDB window appears, as shown below.
The most useful buttons are labelled below.
The program launches, and stops at your breakpoint.
The disassembler window labels the breakpoint with a red RIP marker, indicating that the Instruction Pointer is here, as shown below.
It also labels this line with a red RAX.
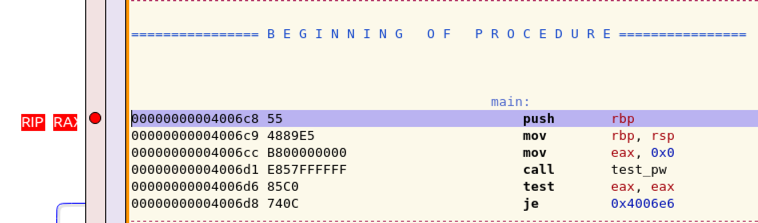
The GDB window shows the current contents of the processor's registers.
As shown below, both RIP and RAX have the same value--the address of the breakpoint.
Troubleshooting
If you make any sort of mistake using the debugger, you cannot easily close it and restart it.Instead, you must use command-line utilities to kill all hopper processes, as explained in the "Exiting the Debugger" section at the end of these instructions.
In the lower left of the window, the "Callstack" pane now shows a location of }main + 0x1", as shown below.
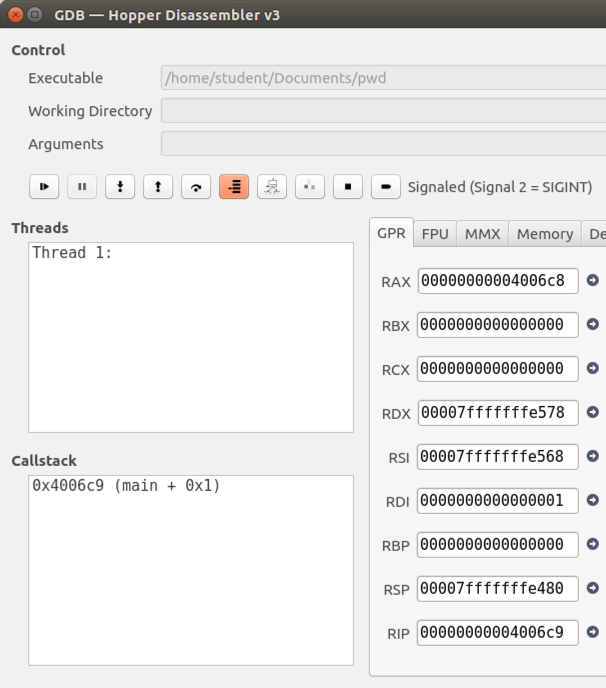
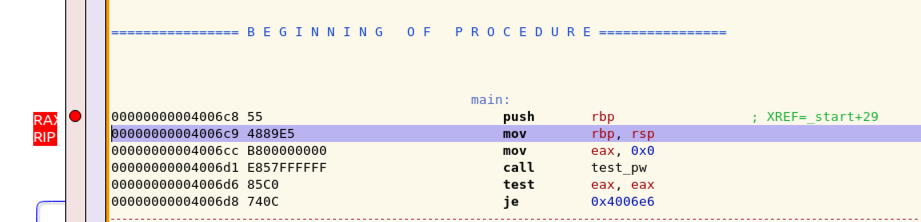
The Disassembler window also shows that the program has moved forward one instruction, as shown below.
The red RIP has moved down one line, and the red RAX still points to the first command in main(), as shown below.
In the GDB window, click the "Step into" button twice more.
In the lower left of the window, the "Callstack" pane now shows a location of }main + 0x9", as shown below.
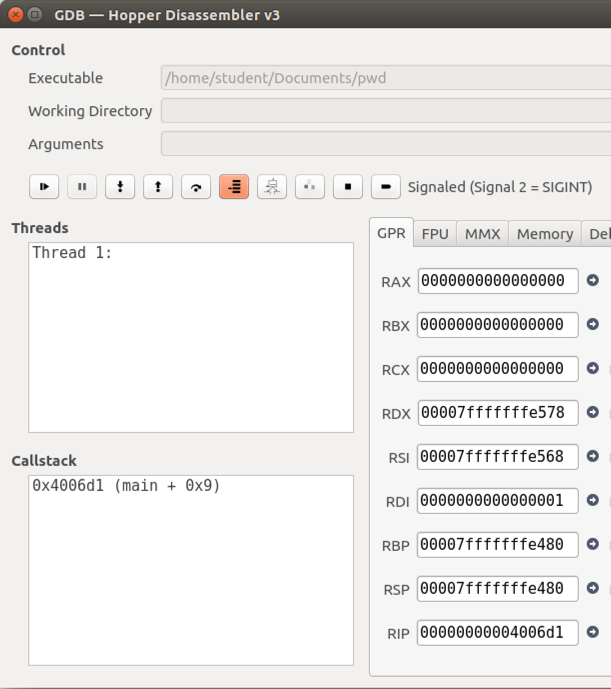
The Disassembler window now shows that we are at the "call test_pw" instruction, as shown below.
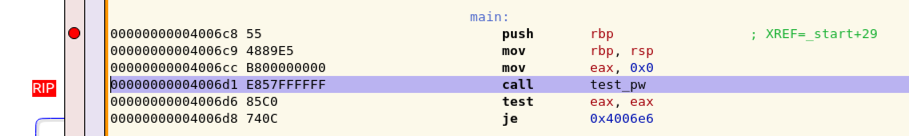
In the GDB window, click the "Step into" button once more.
In the lower left of the window, the "Callstack" pane now shows two lines: we are still in main, but also in the subroutine test_pw, called by main, as shown below.
This is the meaning of "Step into" -- it executes only a single instruction, even if that instruction is a call and enters a new subroutine.
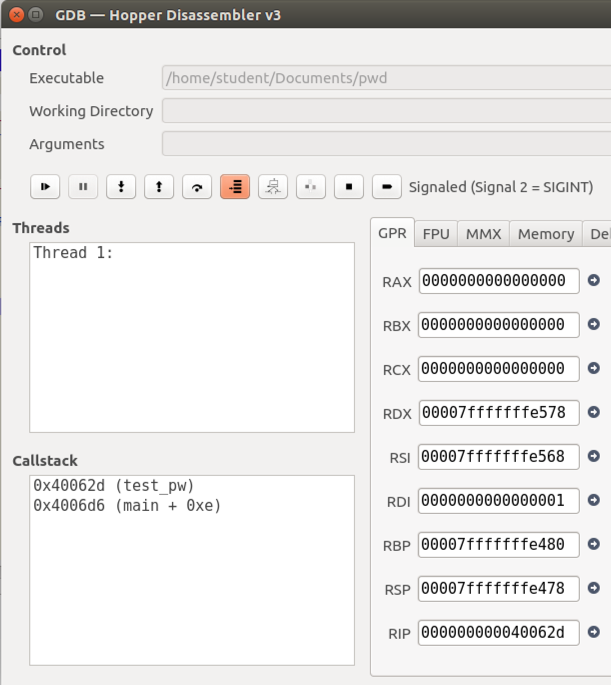
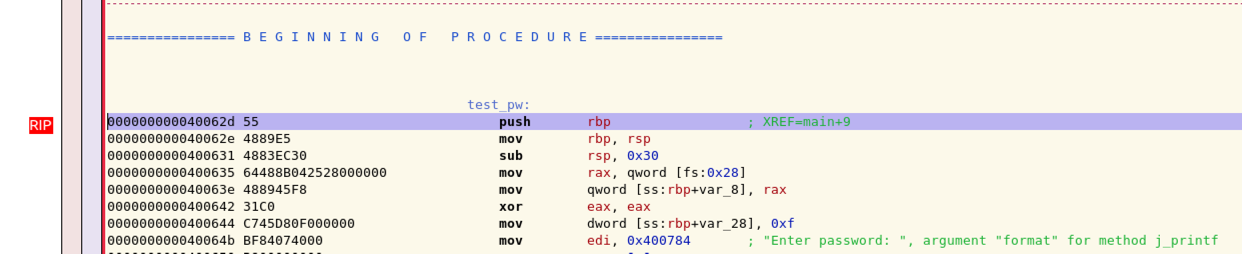
The Disassembler window now shows that we are inside the "call test_pw" function, as shown below.
In the GDB window, click the "Step into" button nine more times.
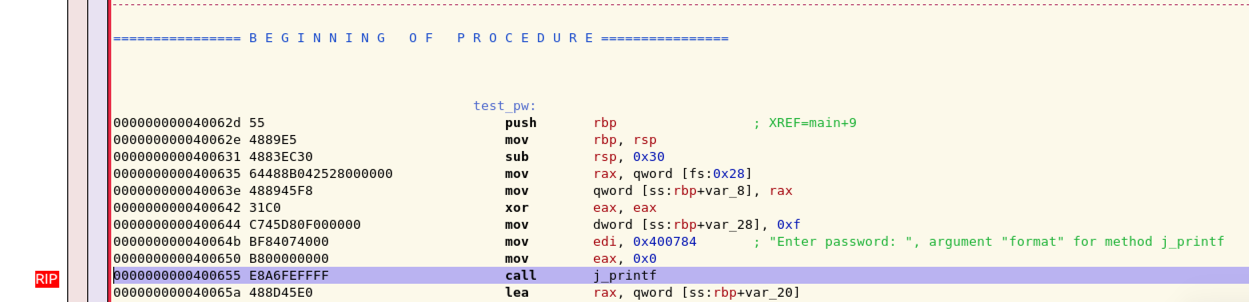
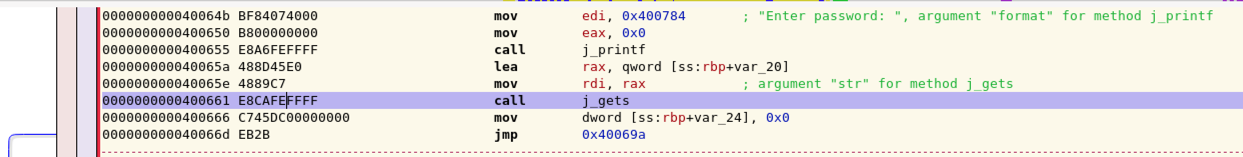
The Disassembler window shows that we about to call the j_printf function, as shown below.
In the GDB window, click the "Step into" button once more.
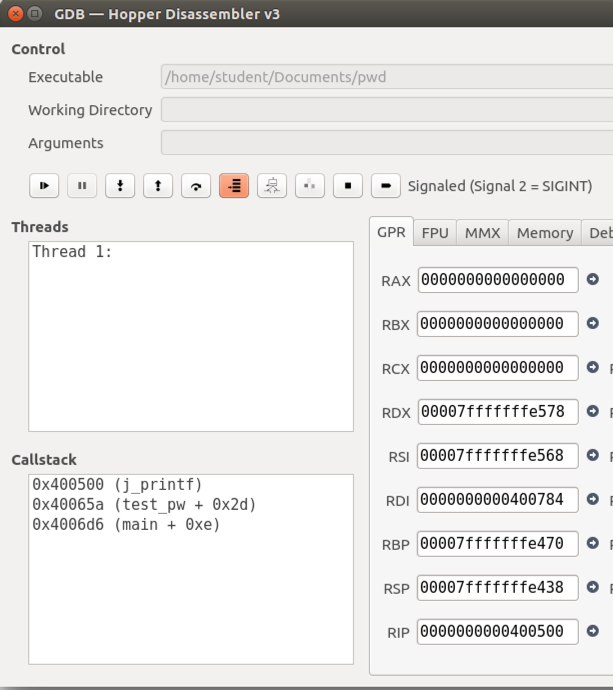
In the lower left of the window, the "Callstack" pane now shows three lines: we are still in main, and in the subroutine test_pw, but we are also in the subroutine j_printf, as shown below.
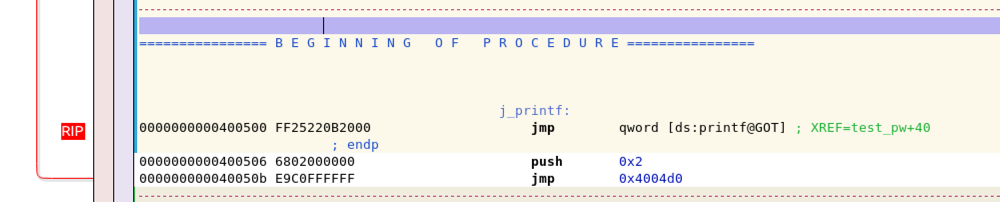
The Disassembler window now shows that we are inside the "j_printf" function, as shown below.
We aren't interested in debugging the C library--we want to debug the C code we wrote. So it doesn't make sense to keep on using "Step in".
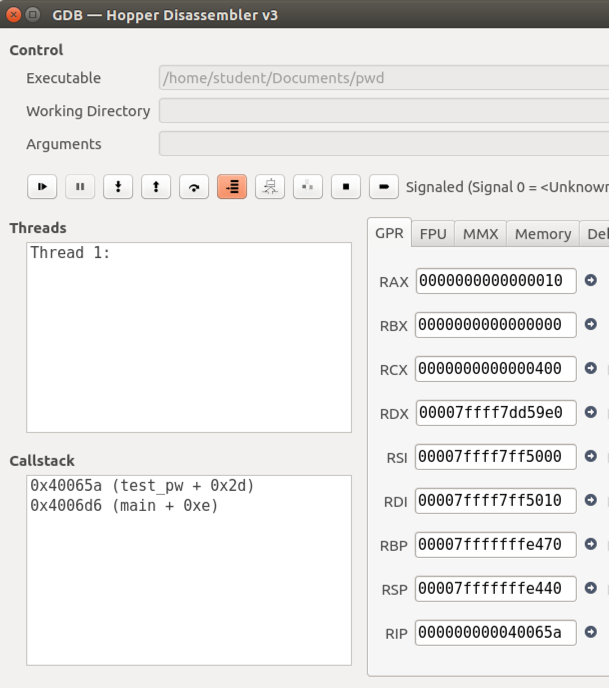
What we really want to do is "Step out", to get back to test_pw. In the GDB window, click the "Step out" button once.
In the lower left of the window, the "Callstack" pane now shows only two lines again: main, and test_pw, as shown below.
To stay at this level, we use the "Step over" button.
In the GDB window, click the "Step over" button three times.
In the lower left of the window, the "Callstack" pane now shows two lines, but they are grayed out, as shown below.
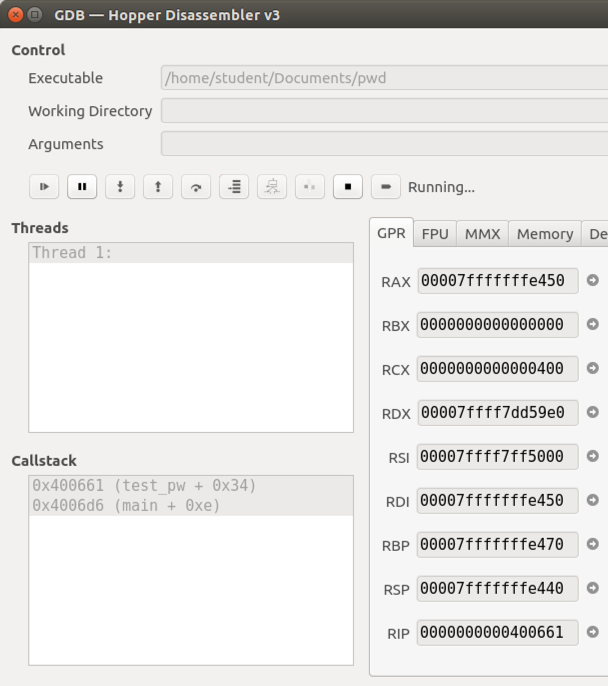
The Disassembler window no longer shows which instruction we are on, as shown below.
What has happened? We have stepped over the j_gets function, and the program is waiting for user input from inside that function.
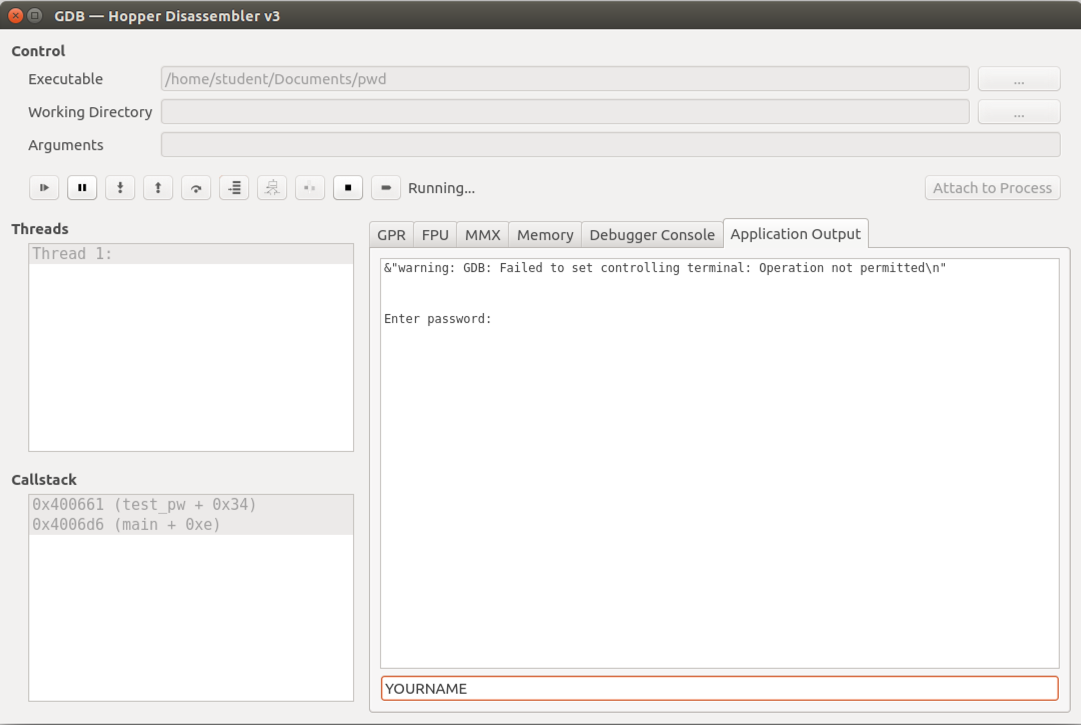
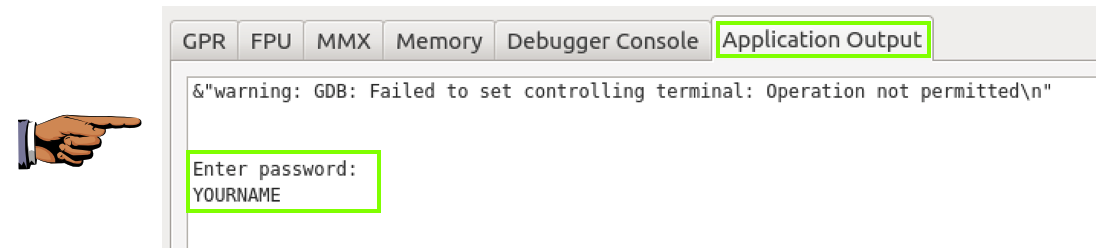
Here you see a warning message, followed by the "Enter password:", prompt, as shown below.
In the bar at the bottom, type in your name (not the literal text "YOURNAME", as shown below) and press Enter.
Your name appears inside the window, as shown below.
Press the PrintScrn key to copy the whole desktop to the clipboard.
YOU MUST SUBMIT A FULL-SCREEN IMAGE FOR FULL CREDIT!
Paste the image into Paint.
Save the document with the filename "YOUR NAME Proj 7xc", replacing "YOUR NAME" with your real name.
If that process fails (and it often does), do this:
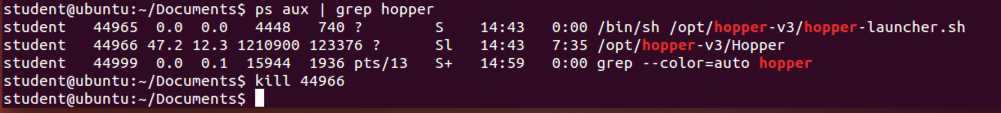
In a Terminal window, execute this command:
Now use the kill command to kill each process, one by one, by process ID number, as shown below.ps aux | grep hopper
Binary Patching. The Brute Force of Reverse Engineering with IDA and Hopper (And a Hex Editor).