
Notice the status bar at the bottom of the WinDbg window, saying "Debugee not connected".
That means that even though the serial connection is working, the kernel on the target machine has not been interrupted by WinDbg yet.
To start executing WinDbg commands, you need to break in to the kernel.
A message appears, saying you have broken in, ending with an "int 3" instruction, showing that you have hit a breakpoint, as shown below:
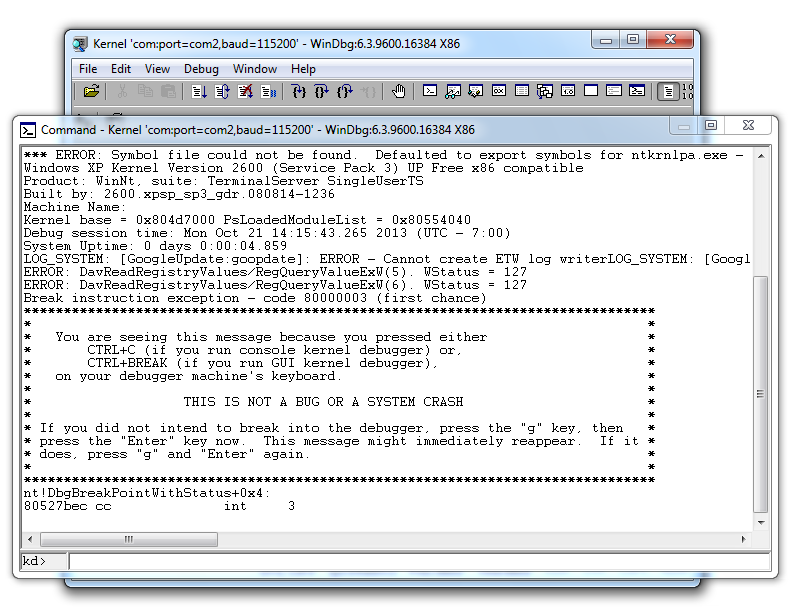
Press Enter to get a kd> prompt, as shown above.
lm
and then press the Enter key.
The characters you type appear in the status bar, at the bottom of the window, but when you press Enter they move into the main window and show the output, as shown below:
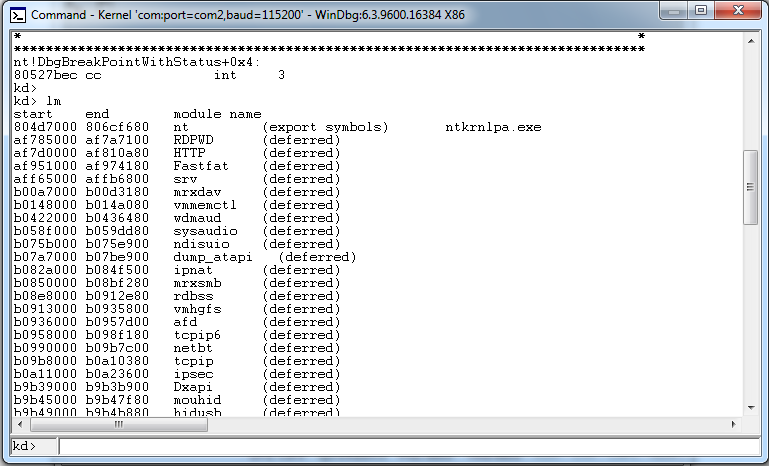
Scroll back to see the lm command you entered, and the first few loaded kernel modules.
You should see the module named nt at the top, as shown above.
This is Ntoskrnl, the main kernel module.
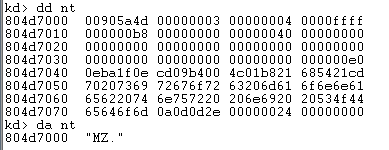
dd nt
You see the first several bytes of Ntoskrnl.exe, as shown below.
This may be more familiar in ASCII.
In WinDbg, execute this command:
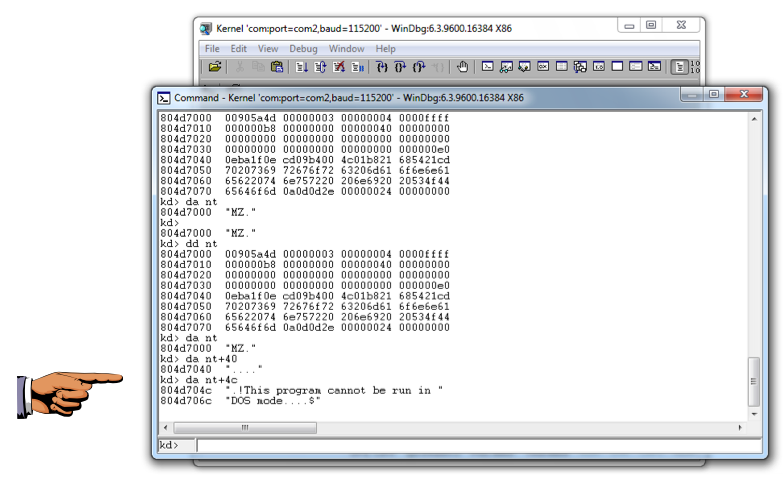
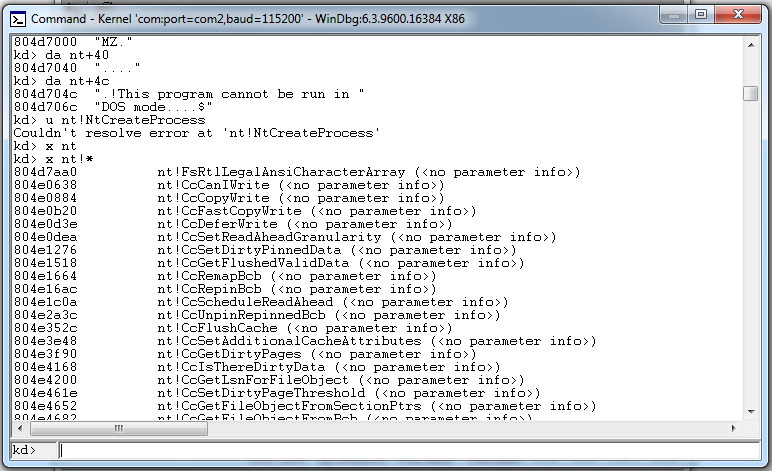
da nt
You see the characters "MZ" --they are at the start of every EXE file.
In WinDbg, execute this command:
da nt+4c
You see the message "This program cannot be run in DOS mode", as shown below:
On your keyboard, press the PrntScrn key.
Click Start, type in PAINT, and open Paint.
Press Ctrl+V to paste in the image of your desktop.
YOU MUST SUBMIT WHOLE-DESKTOP IMAGES TO GET FULL CREDIT.
Save the image with a filename of "Proj 13a from YOUR NAME".
x nt!*
This finds all the functions in Ntoskrnl.
There are a lot of them, as shown below:
In WinDbg, execute this command:
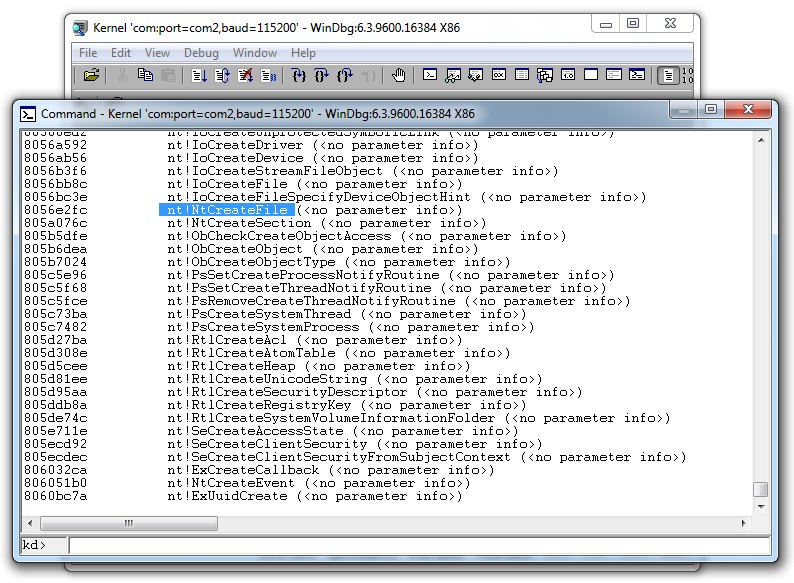
x nt!*Create*
This finds all the functions in Ntoskrnl that contain the word "Create".
There are a lot of them, including "nt!NtCreateFile", as highlighted below:
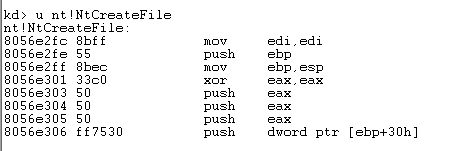
u nt!NtCreateFile
This shows the first few bytes of the function, disassembled, as shown below:
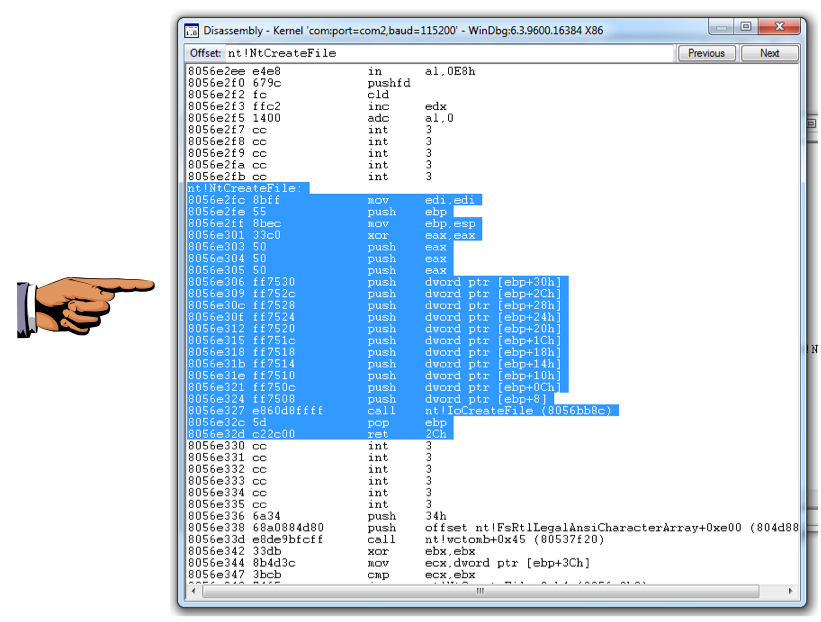
To see more of this function, it helps to use the WinDbg Disassembly window.
From the WinDbg menu bar, click View, Disassembly.
In the Offset bar at the top, enter
nt!NtCreateFile
Resize this window to make the entire function visible, as highlighted below:
On your keyboard, press the PrntScrn key.
Click Start, type in PAINT, and open Paint.
Press Ctrl+V to paste in the image of your desktop.
YOU MUST SUBMIT WHOLE-DESKTOP IMAGES TO GET FULL CREDIT.
Save the image with a filename of "Proj 13b from YOUR NAME".
?
You see the first page of the online help, as shown below:
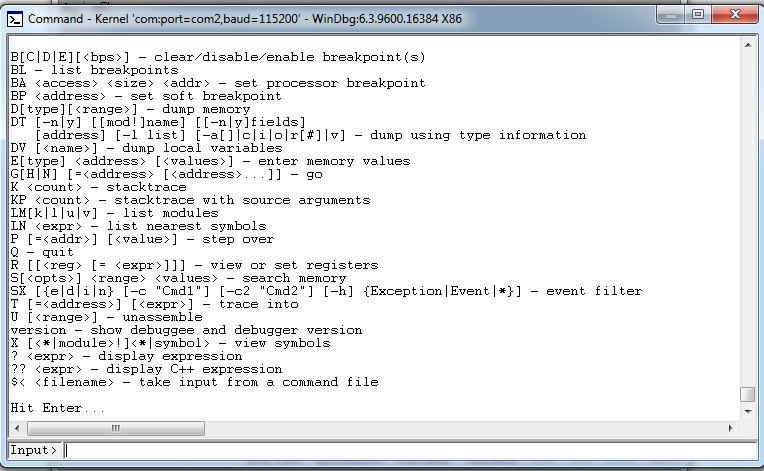
Press Enter to see the other page.
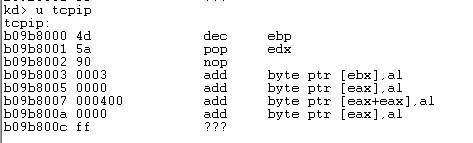
u tcpip
This shows the first few bytes of the tcpip module, disassembled, as shown below:
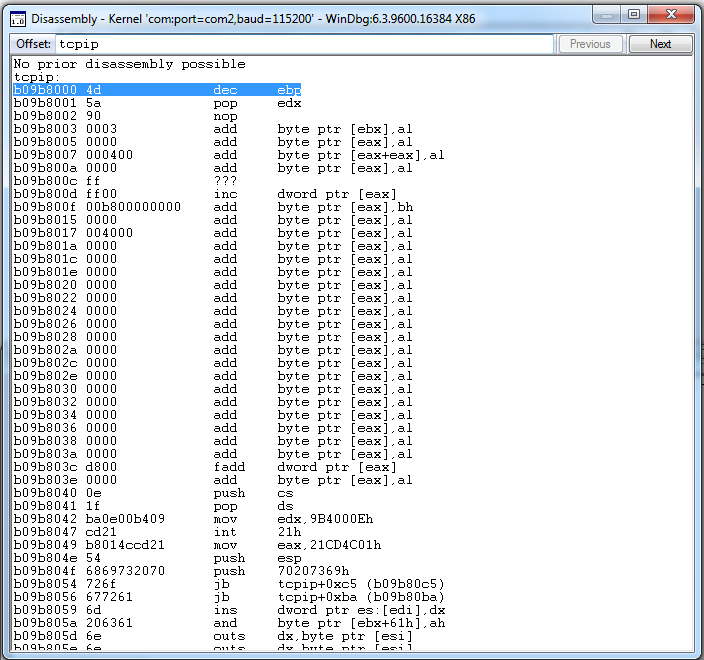
From the WinDbg menu bar, click View, Disassembly.
In the Offset bar, enter
tcpip
You should see the first portion of the tcpip module, as shown below (you may have to wait a few seconds for it to appear, or even close and re-open the Disassembly window):
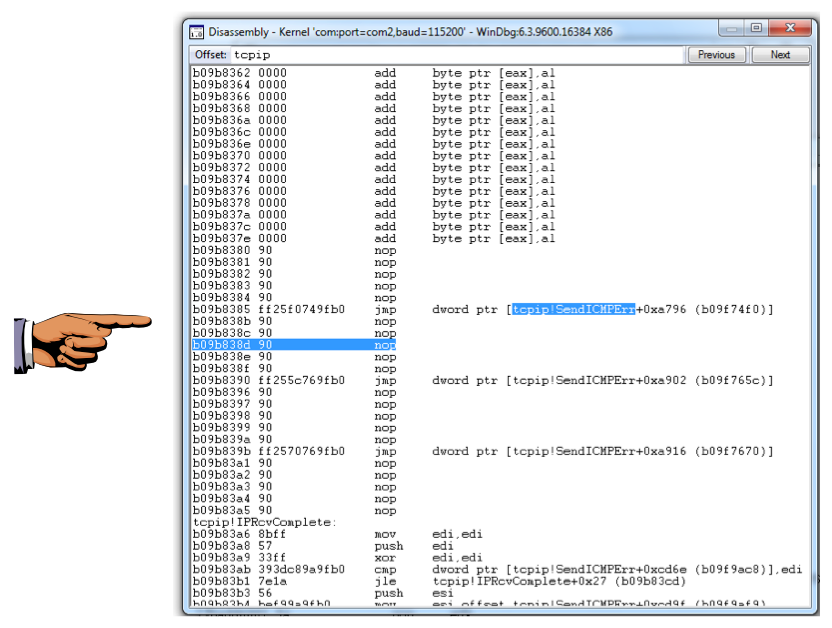
Press the PageDown key about 14 times, depending on the size of your window, until you find a reference to tcpip!SendICMPErr, as highlighted below:
On your keyboard, press the PrntScrn key.
Click Start, type in PAINT, and open Paint.
Press Ctrl+V to paste in the image of your desktop.
YOU MUST SUBMIT WHOLE-DESKTOP IMAGES TO GET FULL CREDIT.
Save the image with a filename of "Proj 13c from YOUR NAME".
Last Modified: 10-21-13 9:47 am