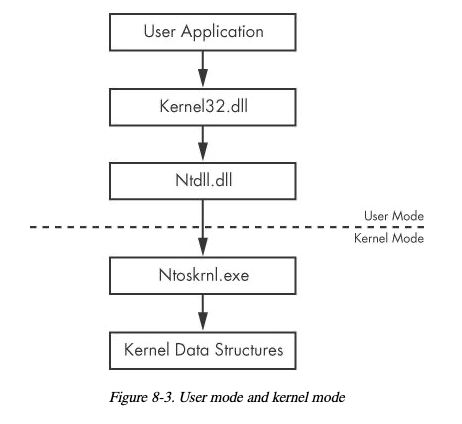
The kernel is the heart of the operating system, and it resides in the file ntoskrnl.exe, as shown in the figure below, from the "Practical Malware Analysis" book.
https://ntcore.com/?page_id=388
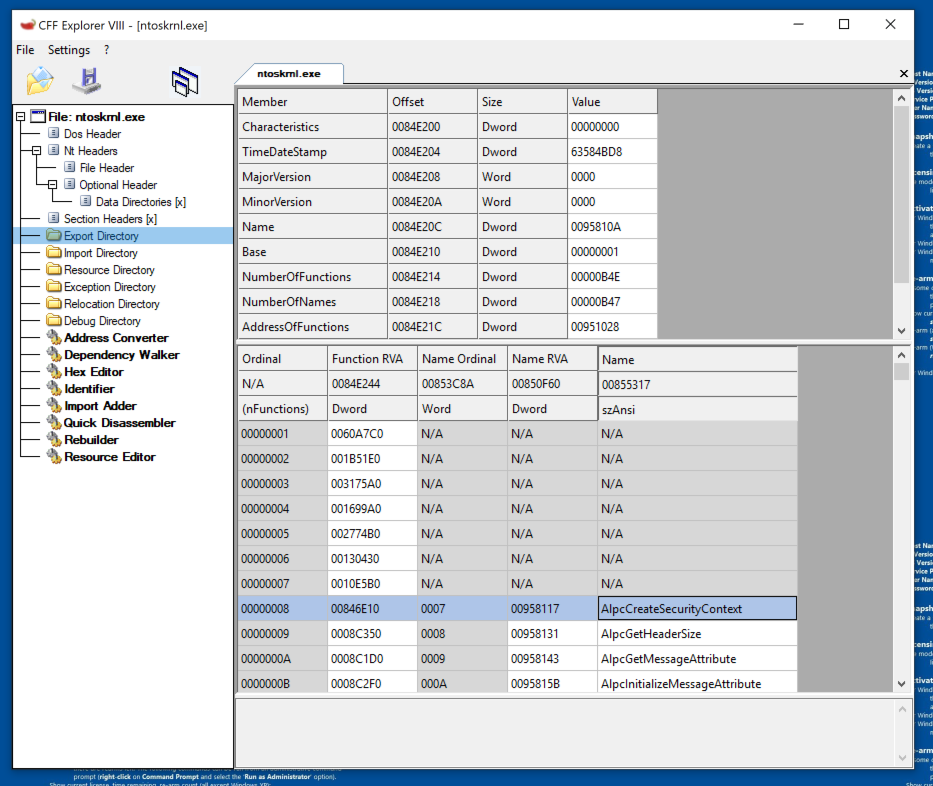
Right-click ntoskrnl.exe and click "Open with CFF Explorer".
In CFF Explorer, in the left pane, click "Export Directory".
As shown below, there are a lot of functions exported by ntoskrnl.exe, including AlpcCreateSecurityContext.
If you don't already have it, install WinDbg from:
Install the Windows debugger
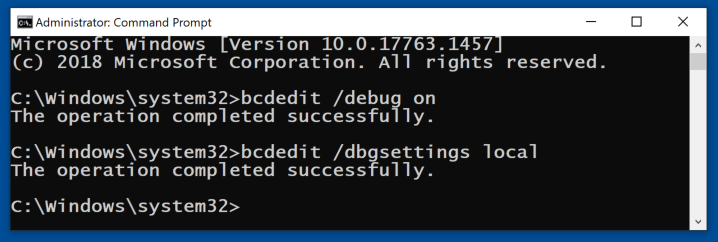
Click the Start button and type CMD. Right-click "Command Prompt" and click "Run as administrator". Click Yes.
Execute these commands:
bcdedit /debug on
bcdedit /dbgsettings local
Restart your Windows machine.
If you are using an old Windows 10 machine, it may launch the old WinDbg. In that case, open an Administrator Command Prompt and execute this command:
windbgx
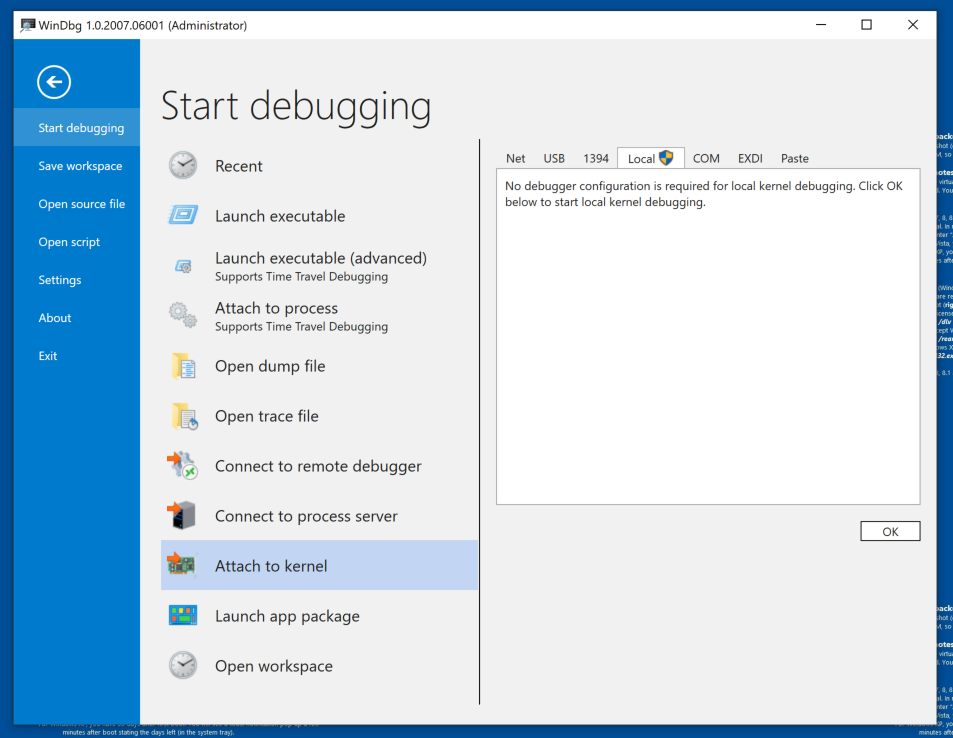
In the right pane, click the Local tab, as shown below.
At the lower right, click the OK button.
Then execute this command:
lm
nt is the kernel, a short name for "ntoskrnl.exe".
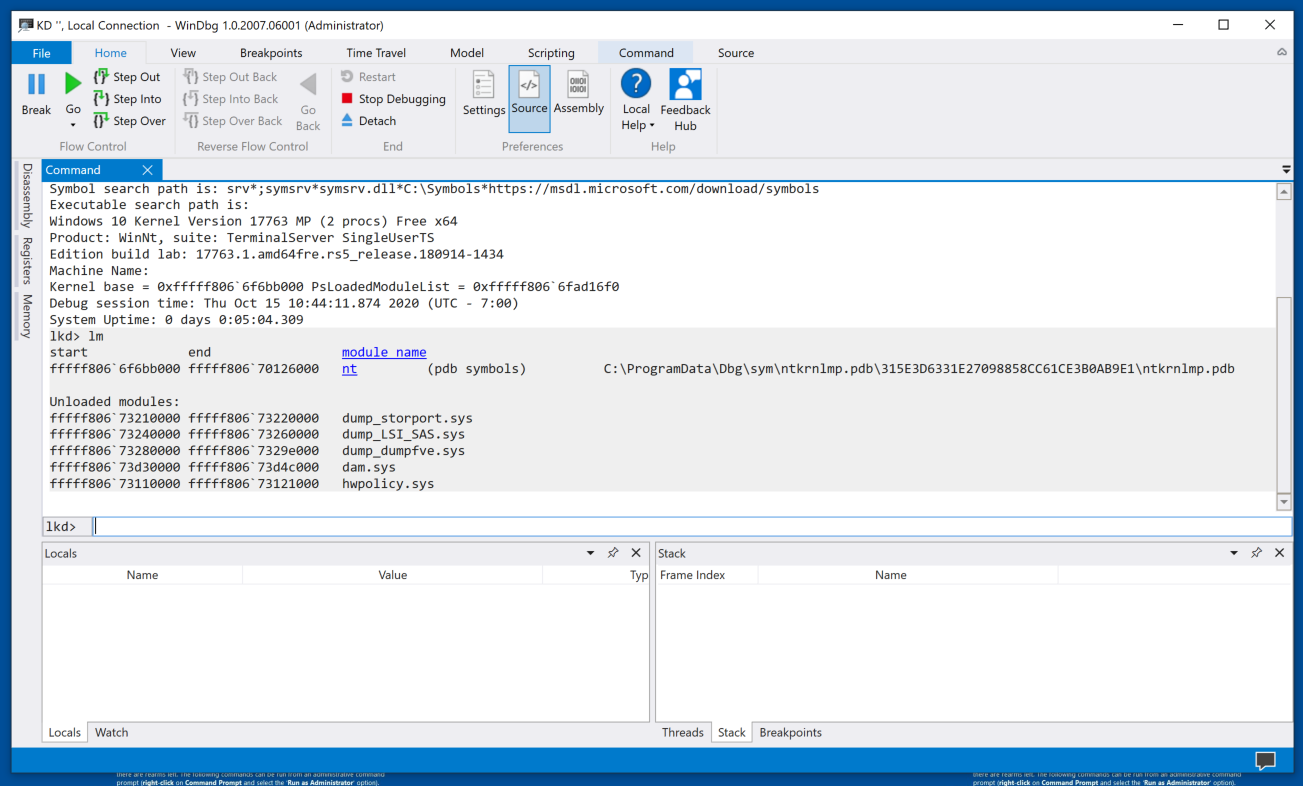
Click the blue nt link.
Now several more blue links appear, as shown below.
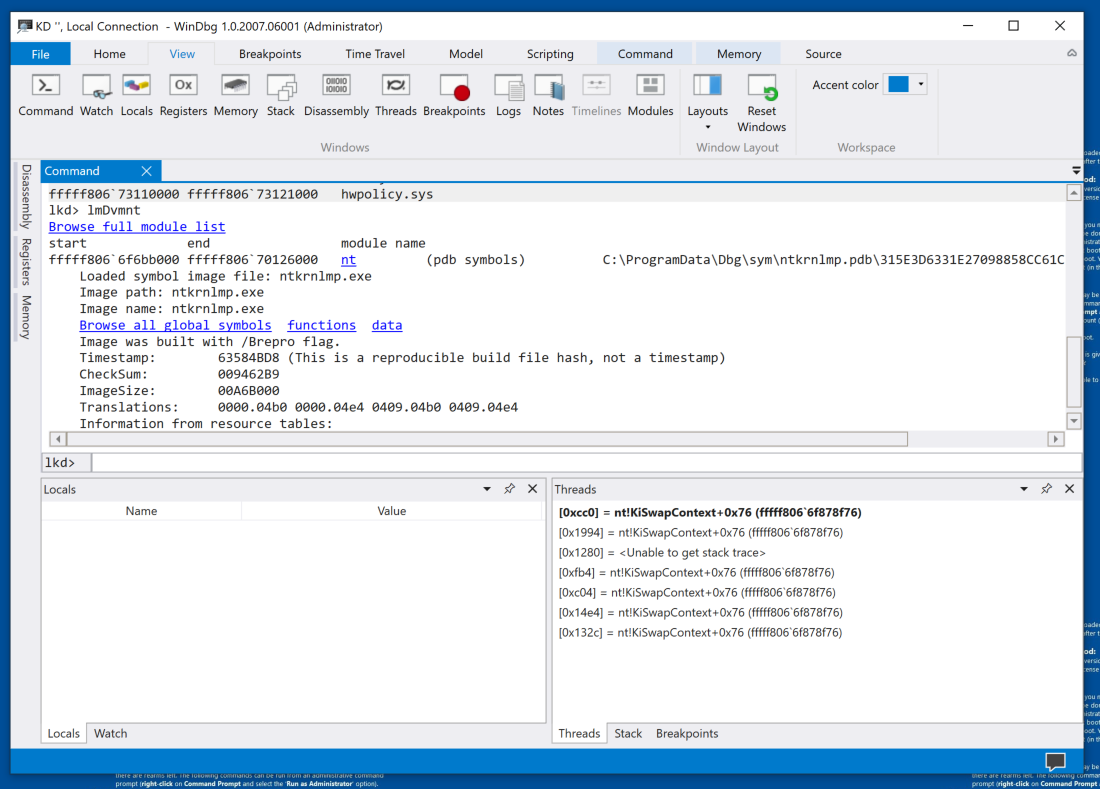
Click functions.
If the command bar in the lower center of WinDbg shows "BUSY", wait for it to finish. When I did it using Windows 11 on April 22, 2024, it took about five minutes to respond.
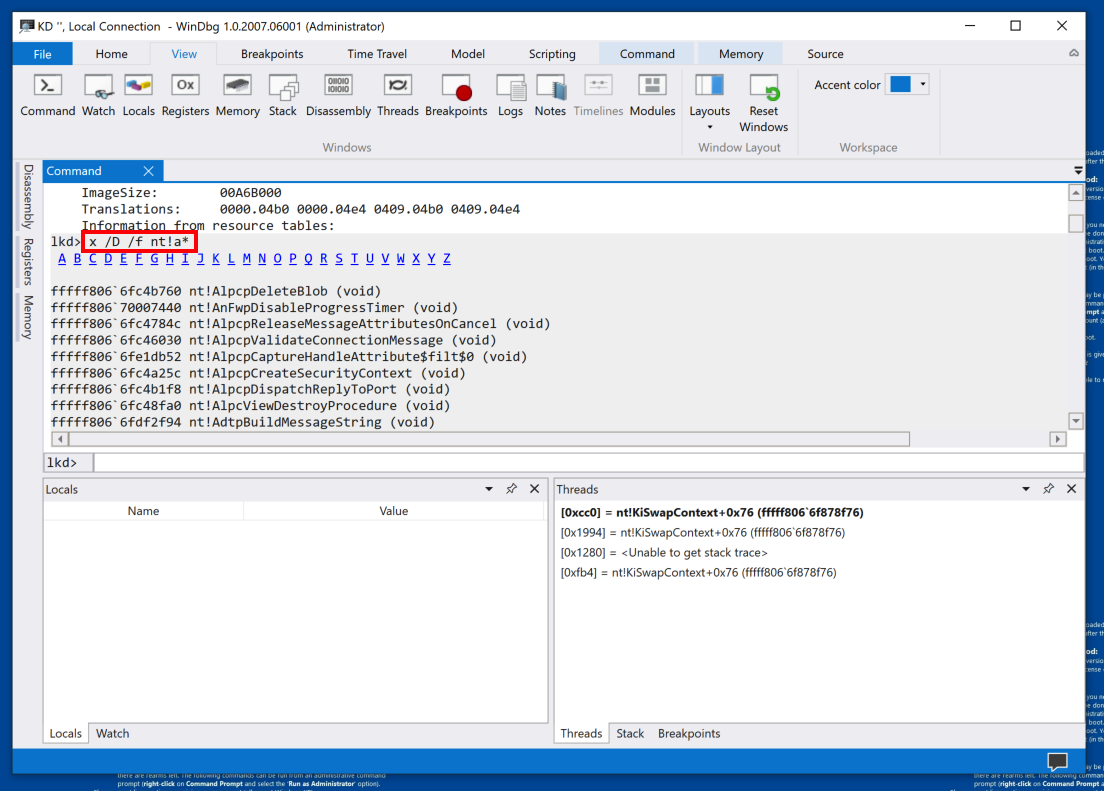
Scroll back to the start of the list, as shown below.
There are links for each letter of the alphabet, to make it somewhat less clumsy to sort through the vast number of functions in the kernel.
You see the functions starting with "A", including AlpcCreateSecurityContext. Notice the command executed to produce these list of functions in the nt module starting with "A", as shown below.
x /D /f nt!a*
The graphical elements in WinDbg are still pretty clumsy. To get work done efficiently, you still need to use command-line commands.
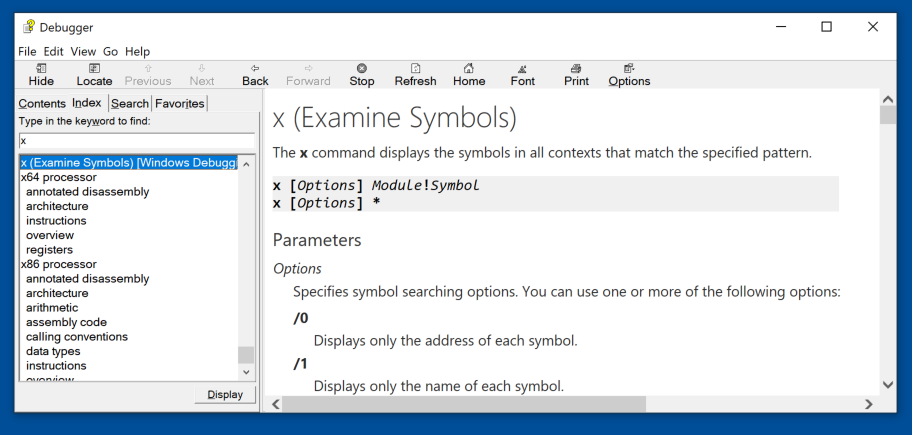
In the Debugger window, enter a keyword of x.
Double-click the first result: "x (Examine Symbols), as shown below.
This is a good place to learn how to use the command-line commands.
PMA 432.1 WarBird (5 pts)
This flag only works on ARM processors, as of 4-23-26.If you have an AMD or Intel processor, do flag 432.5 below instead.
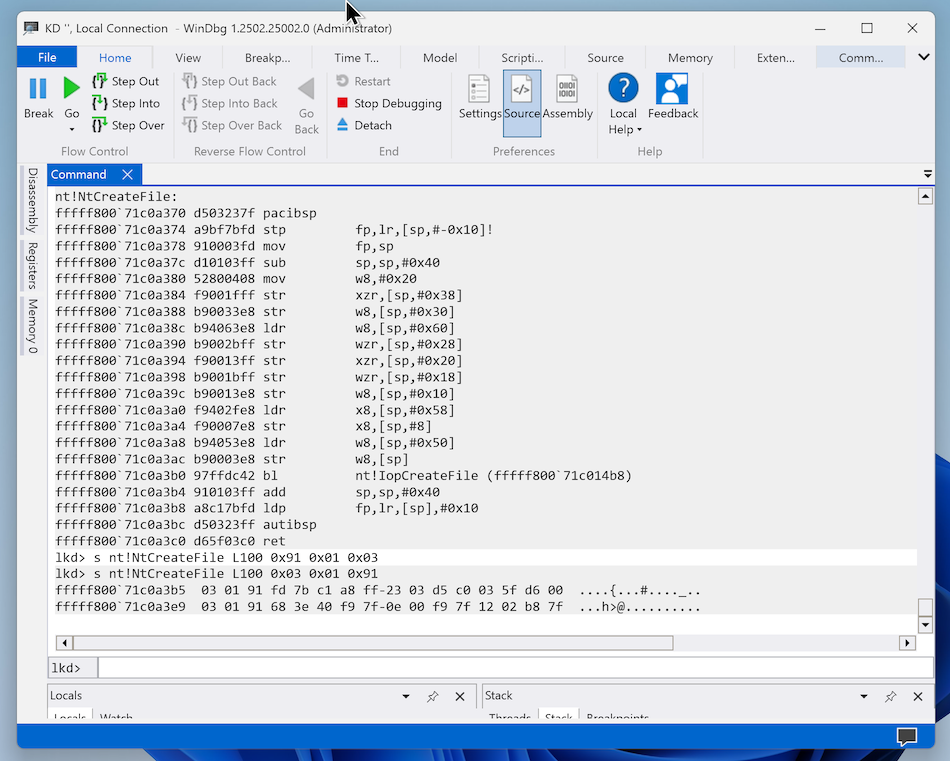
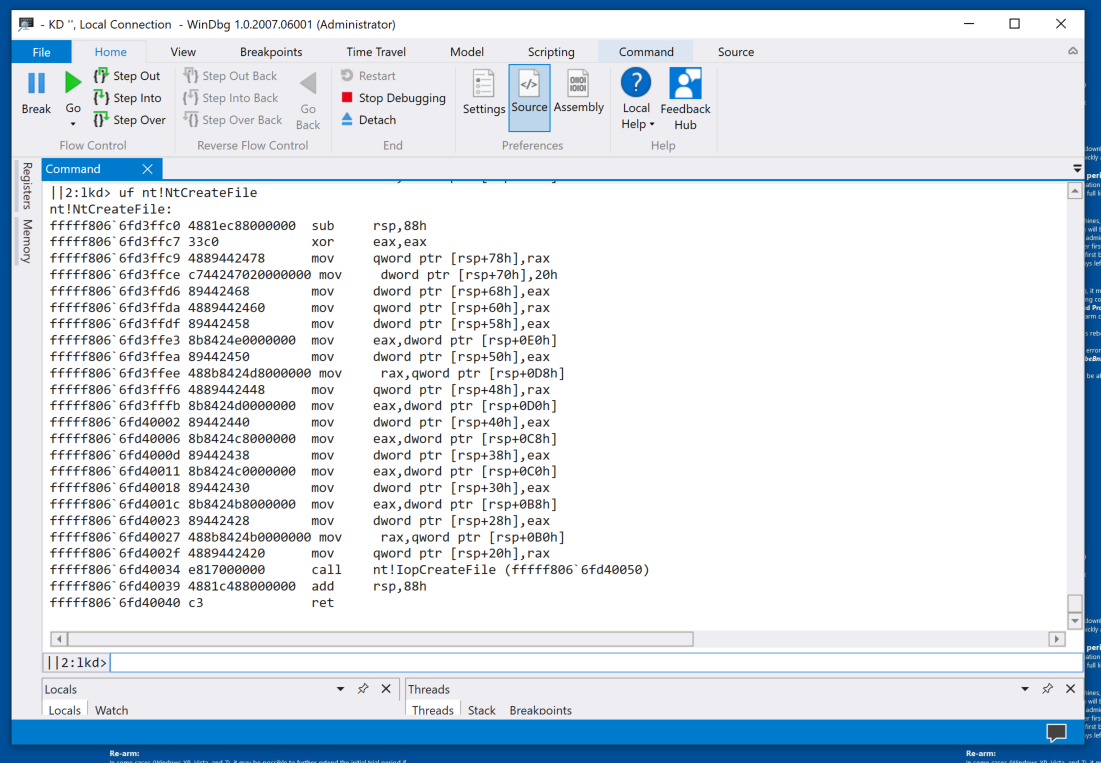
Read the instructions explaining how to use the x function. Figure out how to find the function shown in the image below.
The flag is covered by a green box in the image below.
PMA 432.5 WarBird (5 pts)
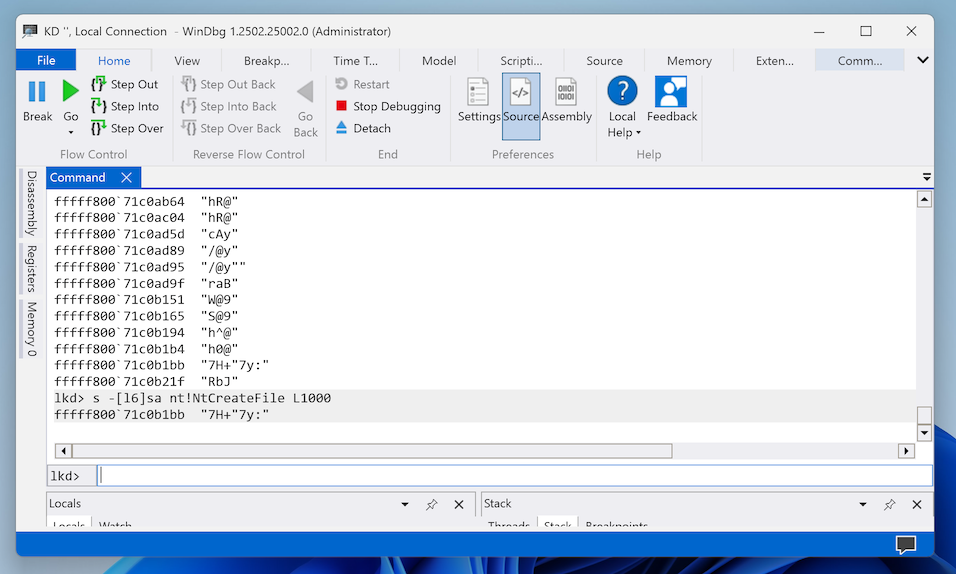
If you have an AMD or Intel processor, do this:Read the instructions explaining how to use the x function. Figure out how to find the function shown in the image below.
The flag is covered by a green box in the image below.
uf nt!NtCreateFile
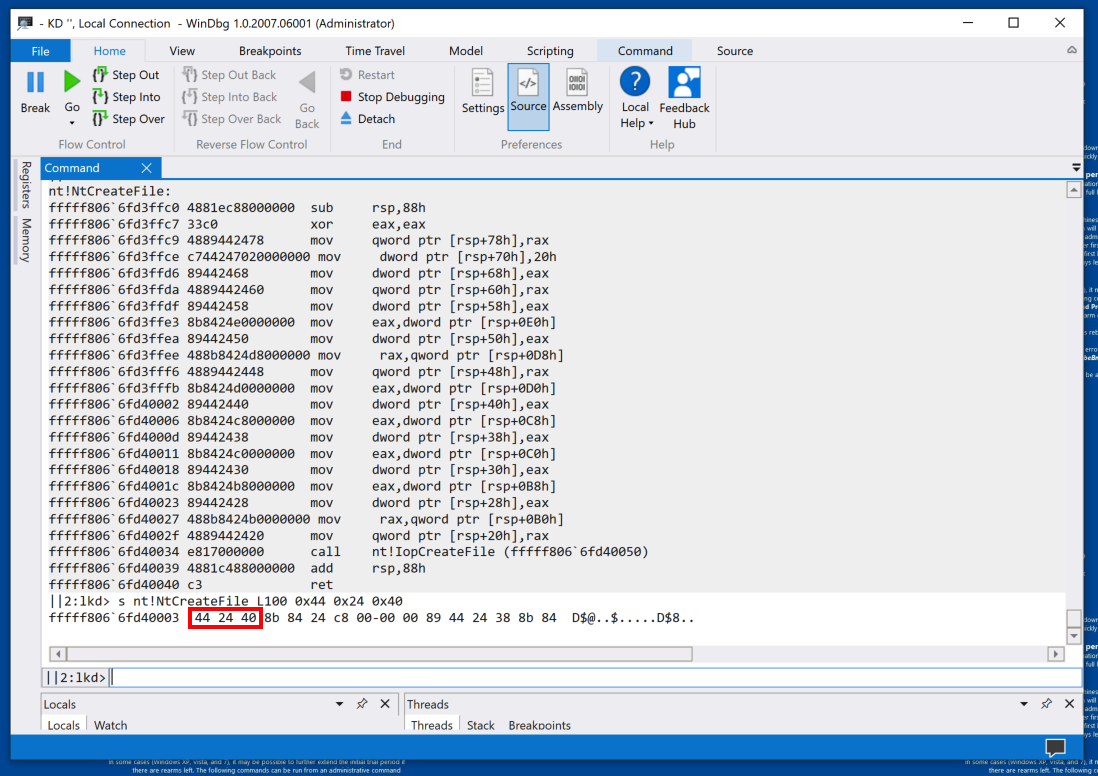
s nt!NtCreateFile L100 0x44 0x24 0x40
Windows 11 on ARM
If you are using Windows 11 on ARM, the machine code is different, as shown below.To search memory, execute this command:
The pattern is found, as shown below.Note: the order of the bytes within a command must be reversed to search for them.
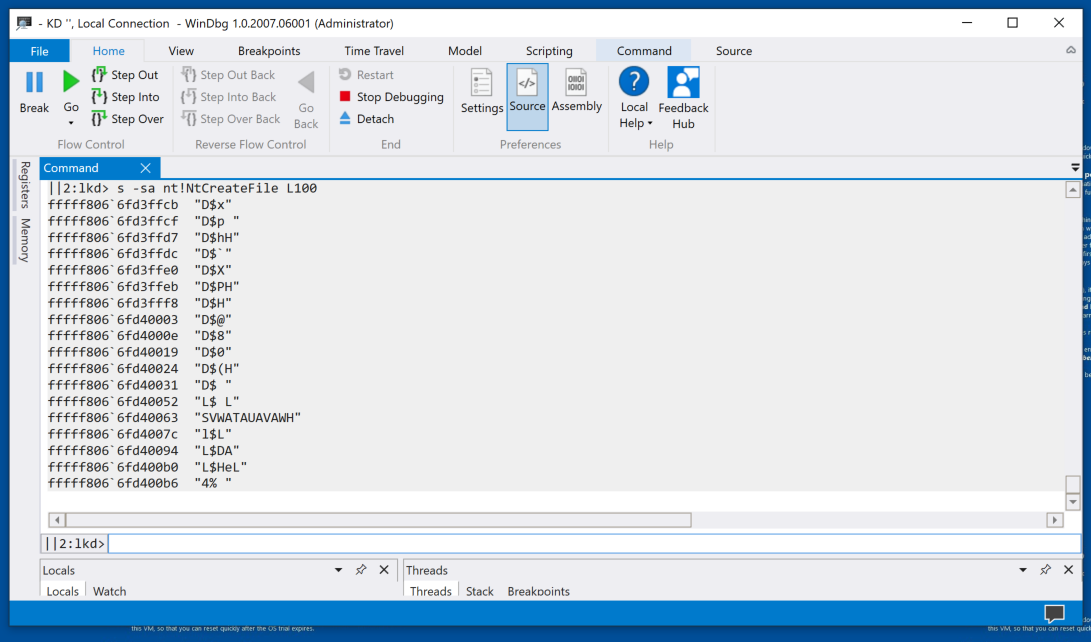
s -sa nt!NtCreateFile L100
In the lower center of WinDbg, execute this command:
s -[l6]sa nt!NtCreateFile L100
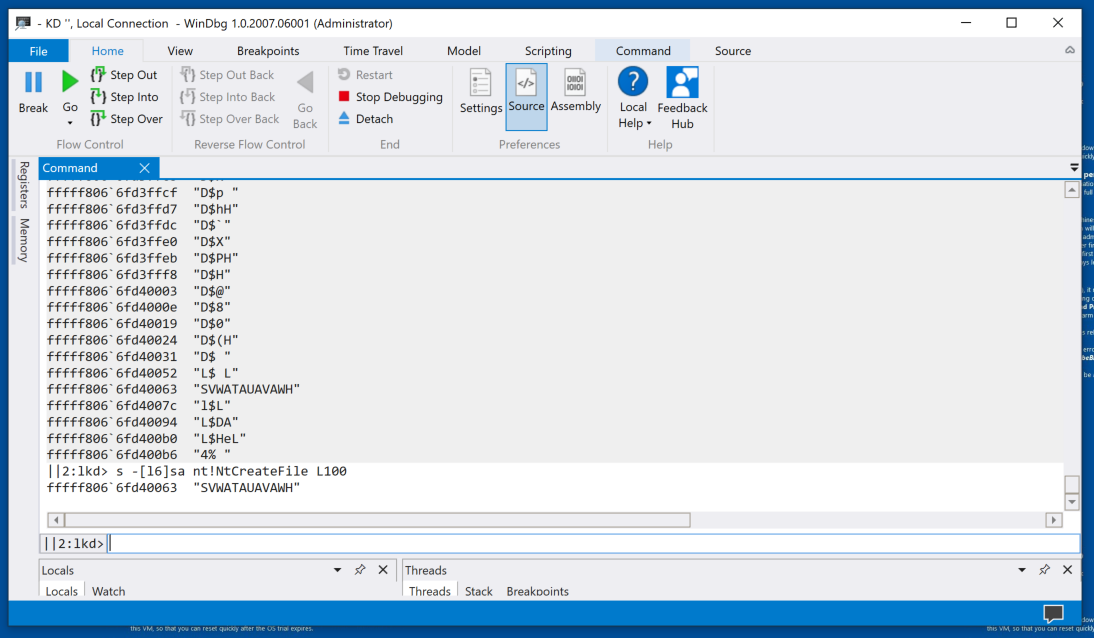
Windows 11 on ARM
If you are using Windows 11 on ARM, change the "L100" portion of the previous two commands to "L1000".You'll find one string with length six or more, as shown below.
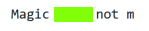
PMA 432.2 Magic (10 pts)
Find the word Magic in nt.The flag is covered by a green box in the image below.
Hints: read the "Local Help" page for the "s" command.
Use Flags of "-a" to search for ASCII strings.
Search through at least 100000 bytes.
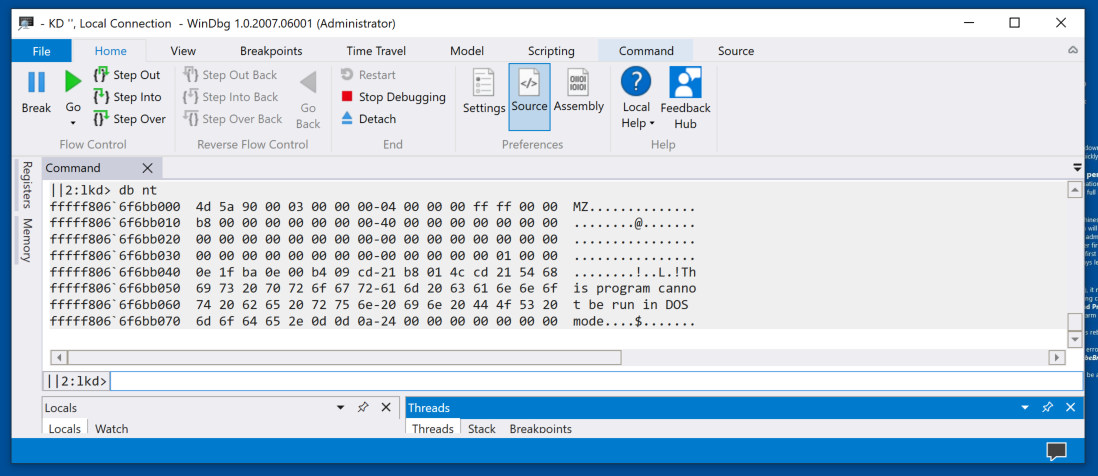
db nt
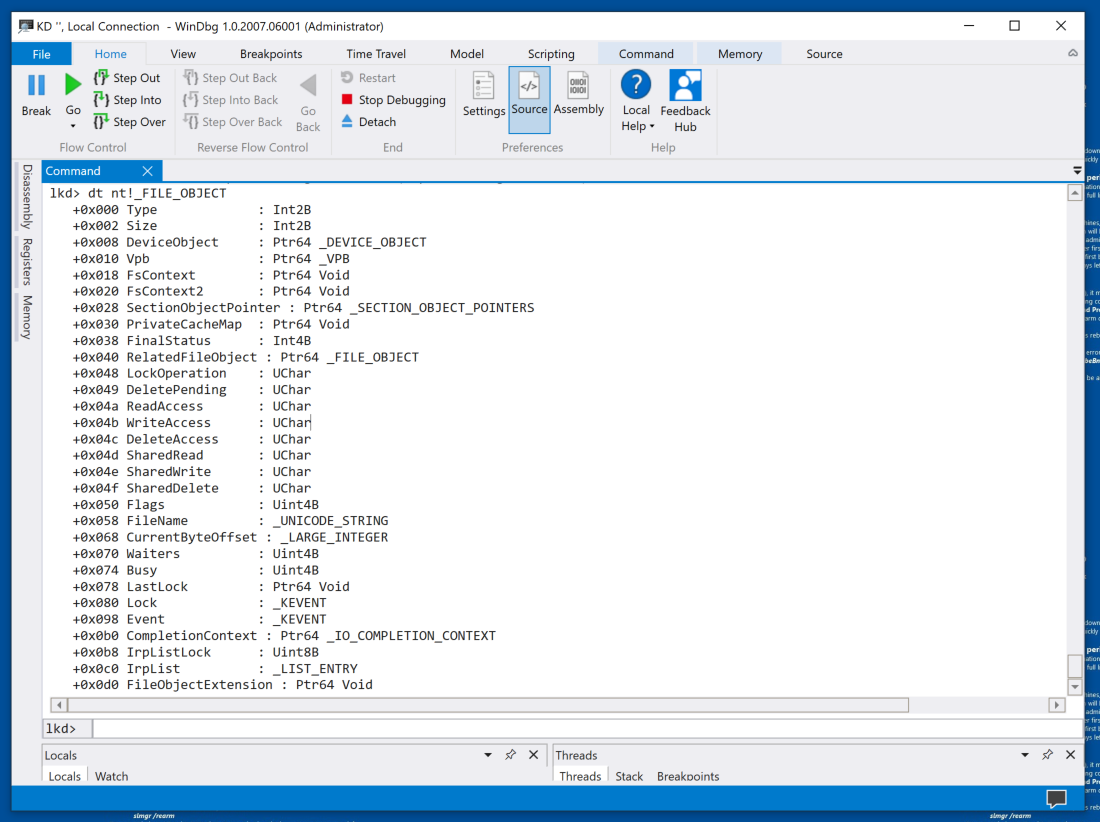
dt nt!_FILE_OBJECT
Notice the permission bytes, such as ReadAccess, and the FileName string, as shown below.
For a more complete explanation of the _FILE_OBJECT structure, see: FILE_OBJECT structure (wdm.h).
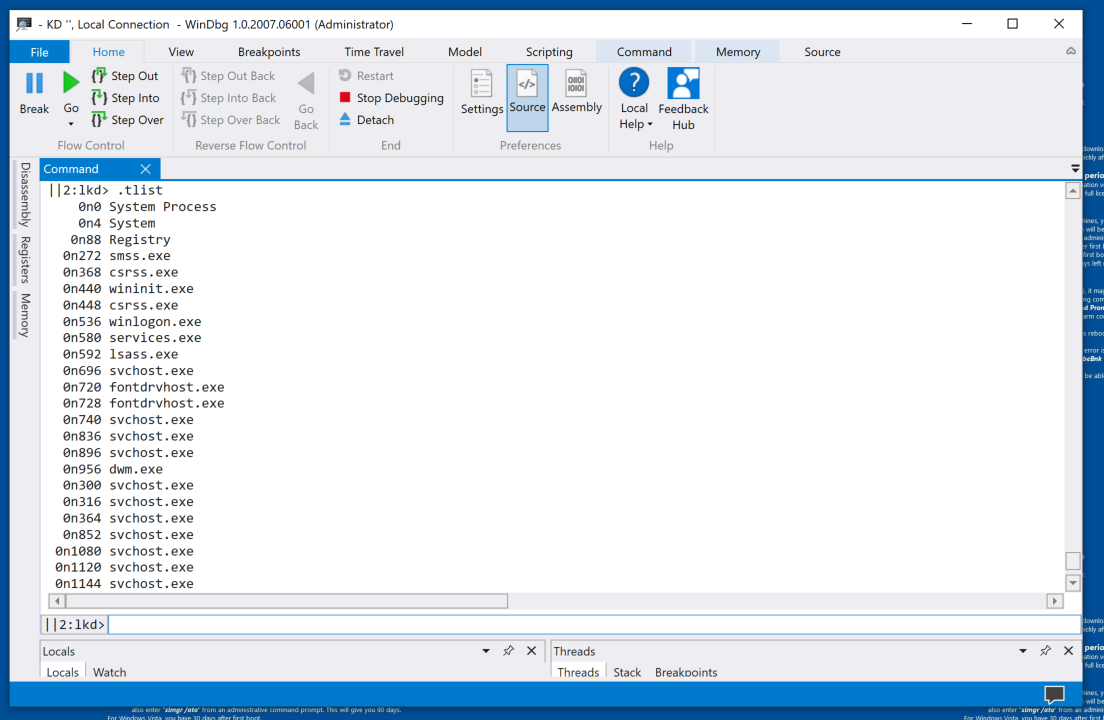
.tlist
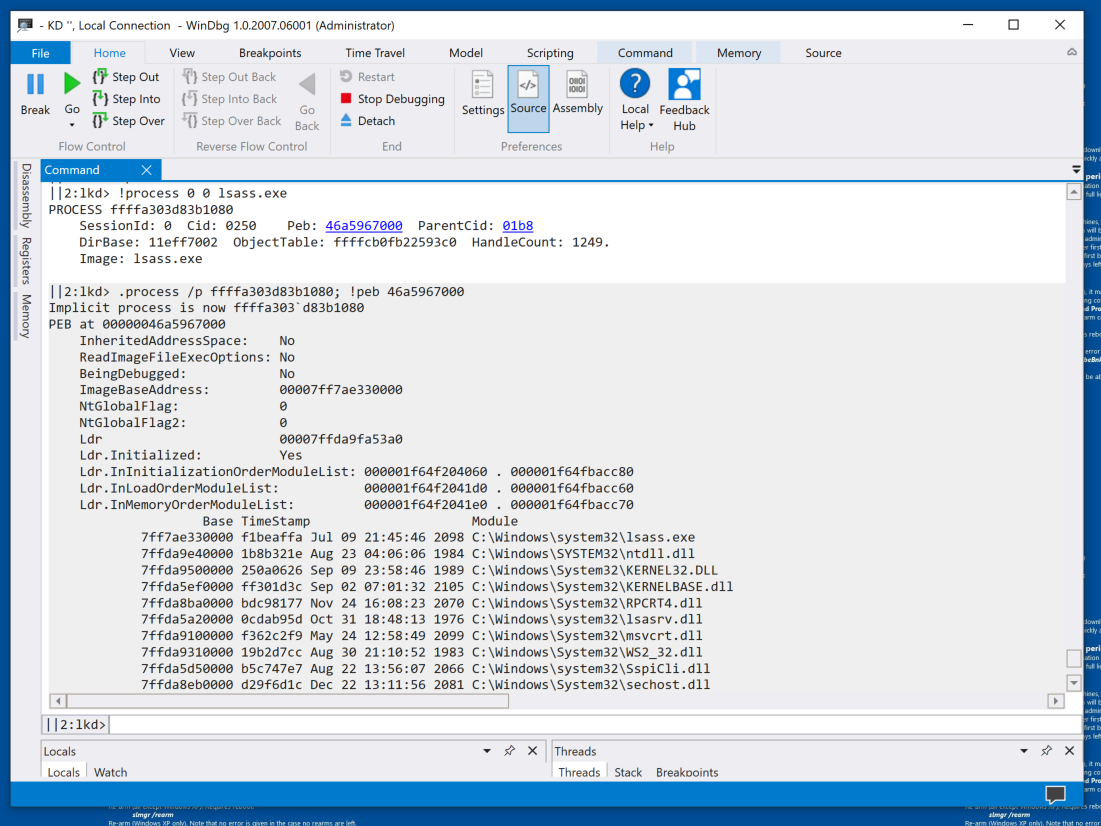
For more details about the "lsass.exe" process, execute this command:
!process 0 0 lsass.exe
Click that blue address for far more information, as shown below.
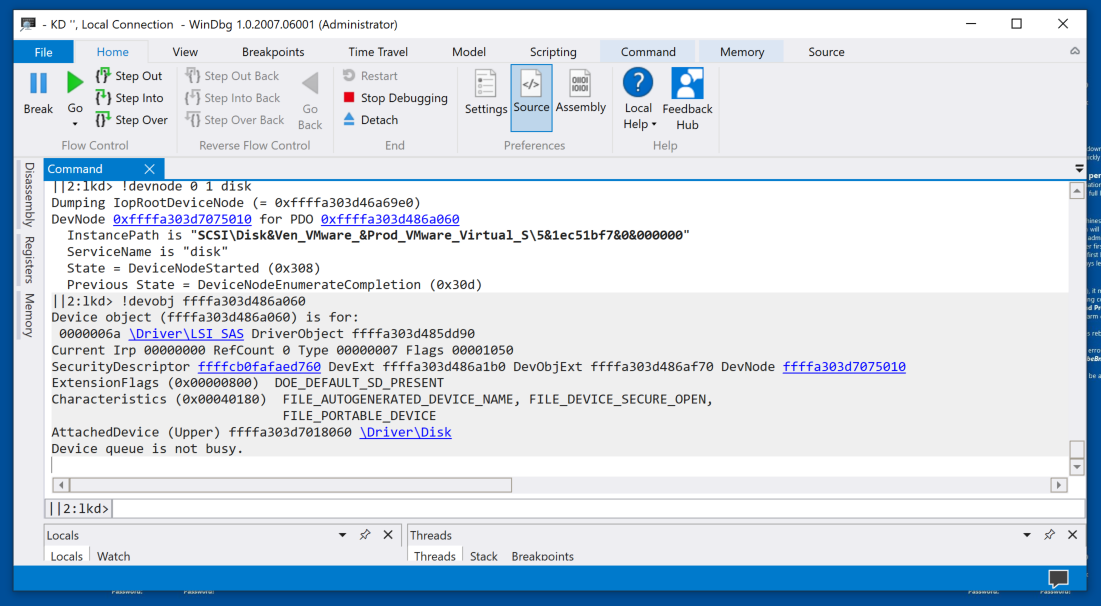
!devnode 0 1 disk
Click that blue address for more information, including the InstancePath, which shows that I am using a VMware disk, as shown below.
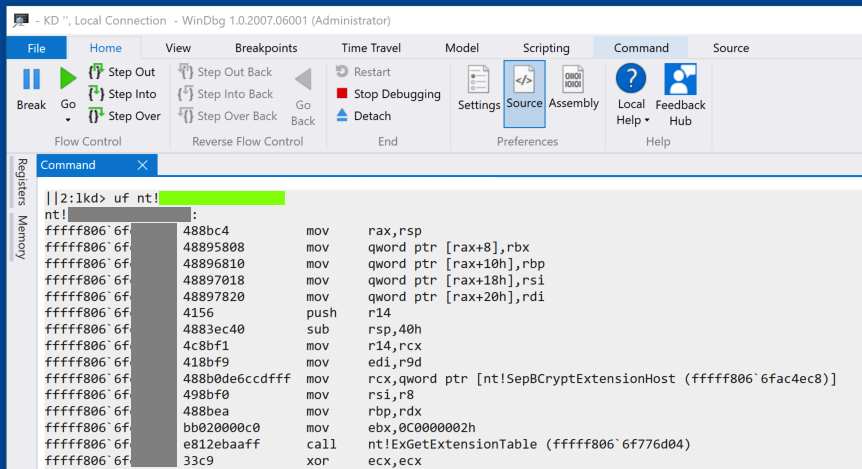
PMA 432.3 Module (20 pts extra)
If you are using an Intel-compatible processor, find the code shown below. The flag is covered by a green rectangle.Hints:
- You need a x86_64 processor.
- Search through at least 1000000 bytes for the byte pattern highlighted in red in the image below
- View memory near that byte sequence. Find the start of a function.
- Unassemble from the start of the function.
PMA 432.4 Module (20 pts extra)
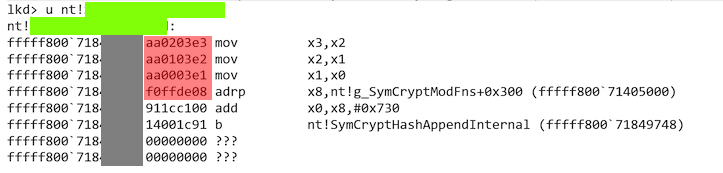
If you are using Windows 11 on ARM64, find the code shown below. The flag is covered by a green rectangle.Hints:
- You need a, ARM64 processor.
- Search through at least 1000000 bytes for the byte pattern highlighted in red in the image below.
- Warning: bytes appear in reverse order in words in WinDbg on ARM64.
- View memory near that byte sequence. Find the start of a function.
- Unassemble from the start of the function.
Execute this command:
bcdedit /debug off
Posted 10-17-20
Minor updates 4-13-2021
Reference to FLARE-VM removed 11-9-21
"Preview" removed, hints added 4-22-24
"windbgx" command added 7-17-24
Flag 432.4 added 3-10-25
Flag 432.5 added 4-23-26