Use Internet Explorer, and go to :
https://developer.microsoft.com/en-us/windows/downloads/windows-10-sdk
In the "Getting started" section, click "DOWNLOAD THE INSTALLER", as shown below:
Run the installer.
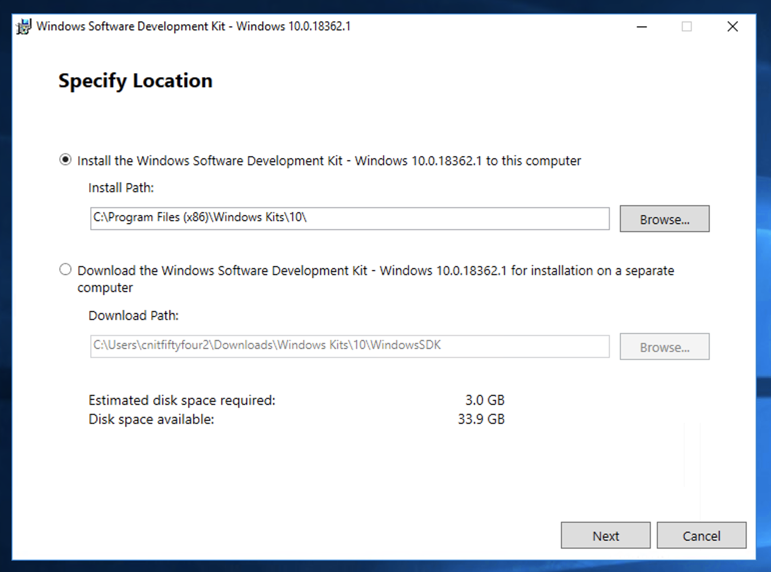
At the "Specify Location" screen, accept the default options and click Next, as shown below:

At the "Windows Kits Privacy" screen, accept the default options and click Next.
At the "License Agreement" screen, click Accept.
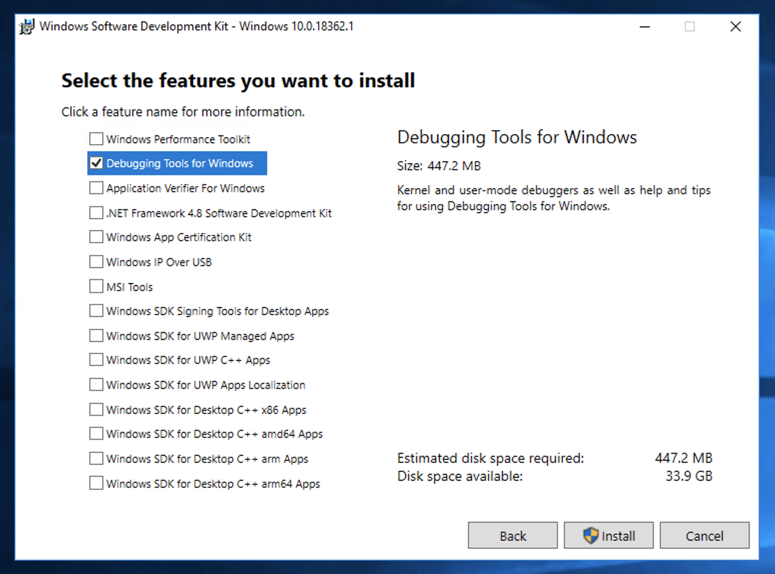
At the "Select the features you want to install" screen, check the "Debugging Tools for Windows" box and clear all the other boxes, as shown below.
Click Install.
If you don't have an Install button, but a Download button, click that. The Downloaded files appear in a "Windows Kits" folder in your Downloads folder. You need to run the installer for 64-bit debuggers.
In the User Account Control box, click Yes.
When you see the "Welcome to the Windows Software Development Kit" message, click Close.
Click "Command Prompt (Admin)" or "Windows PowerShell (Admin)",
In the User Account Control box, click Yes.
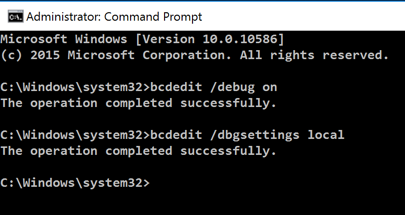
In the Administrator Command Prompt window, execute these commands:
bcdedit /debug on
bcdedit /dbgsettings local
Right-click the Start button.
Point to "Shut down or sign out". Click Restart. Click Continue.
Reconnect to your server via RDP.
If you are using some other machine, in Internet Explorer, go to
https://technet.microsoft.com/en-us/sysinternals/bb897415.aspx
Click the "Download LiveKd" link. Click Save.
Click "Open Folder".
Right-click LiveKD.zip and click
"Extract All...",
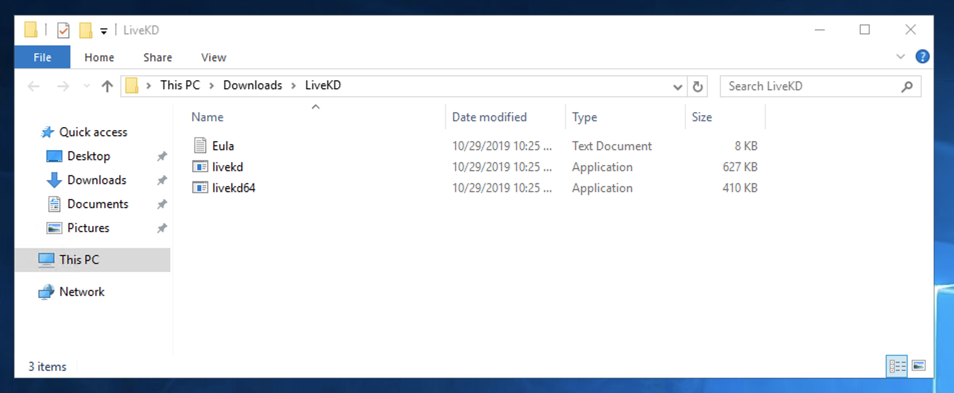
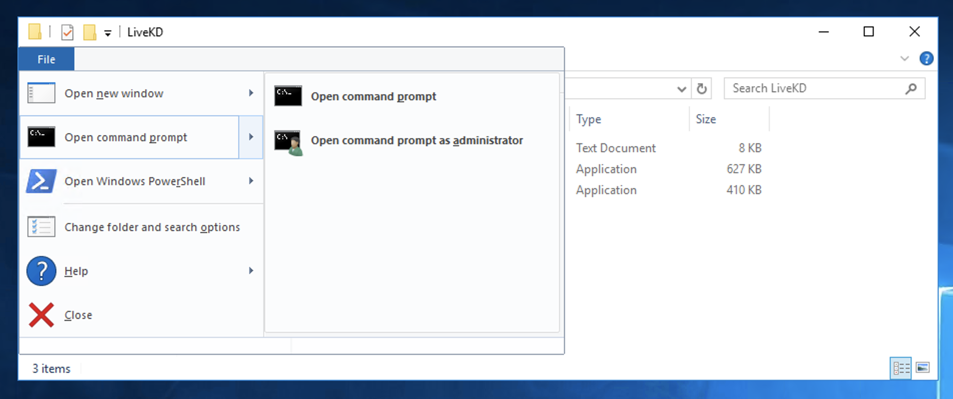
A LiveKd window opens, showing two files, as shown below.
In the top left of the window, click
File,
"Open command prompt",
"Open command prompt as administrator",
as shown below.
In the User Account Control box, click Yes.
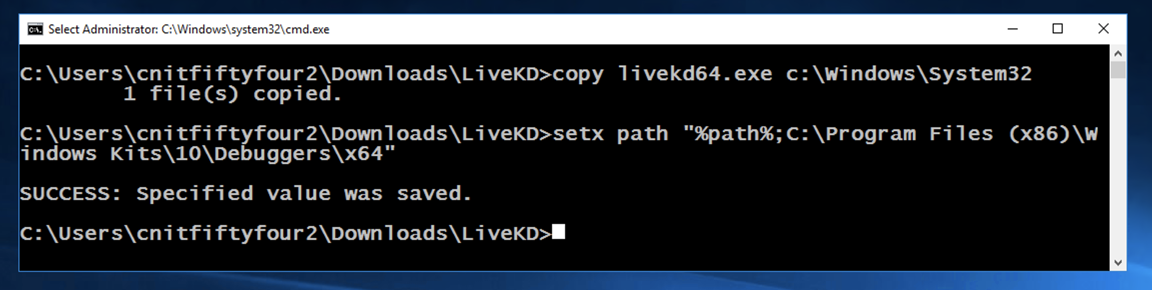
In the Administrator Command Prompt window, execute these commands,
as shown below.
Right-click the Start button.
Click "Command Prompt (Admin)",
In the User Account Control box, click Yes.
In the Administrator Command Prompt window, execute
one of these commands, depending on which machine you
are using:
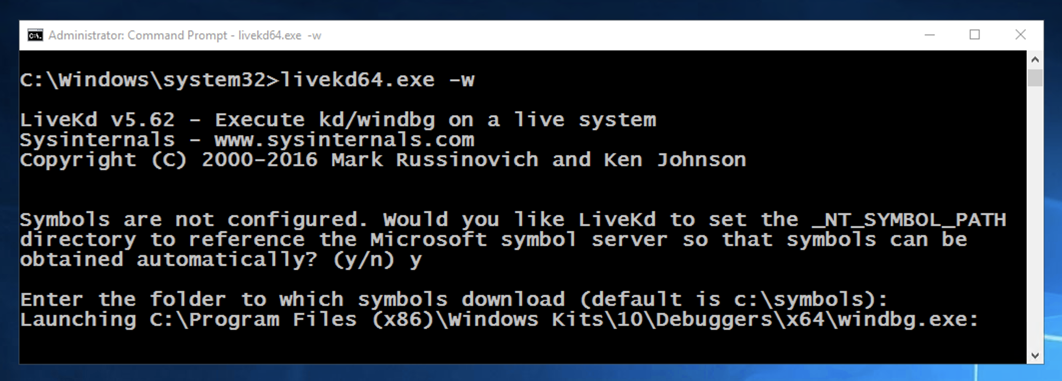
When Livekd starts, it asks you
whether to set the _NT_SYMBOL_PATH
automatically, as shown below.
Type y and press Enter.
Livekd asks "Enter the folder to which symbols download". Press Enter to accept the default option,
as shown below.
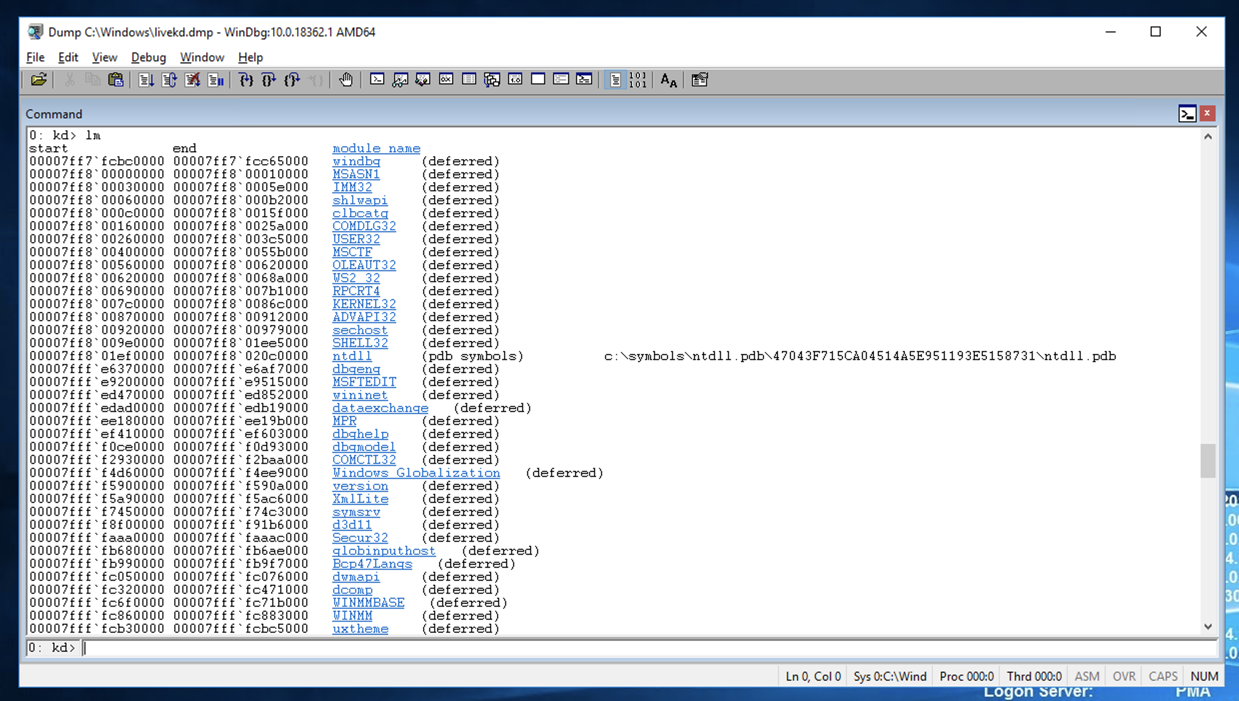
Windbg launches, as shown below.
Maximize the Command window.
This is a strange combination of a GUI and
command-line, like the other debuggers we've used.
Commands are typed into the box at the bottom and the results
appear in the large top pane.
At the bottom of the Command window,
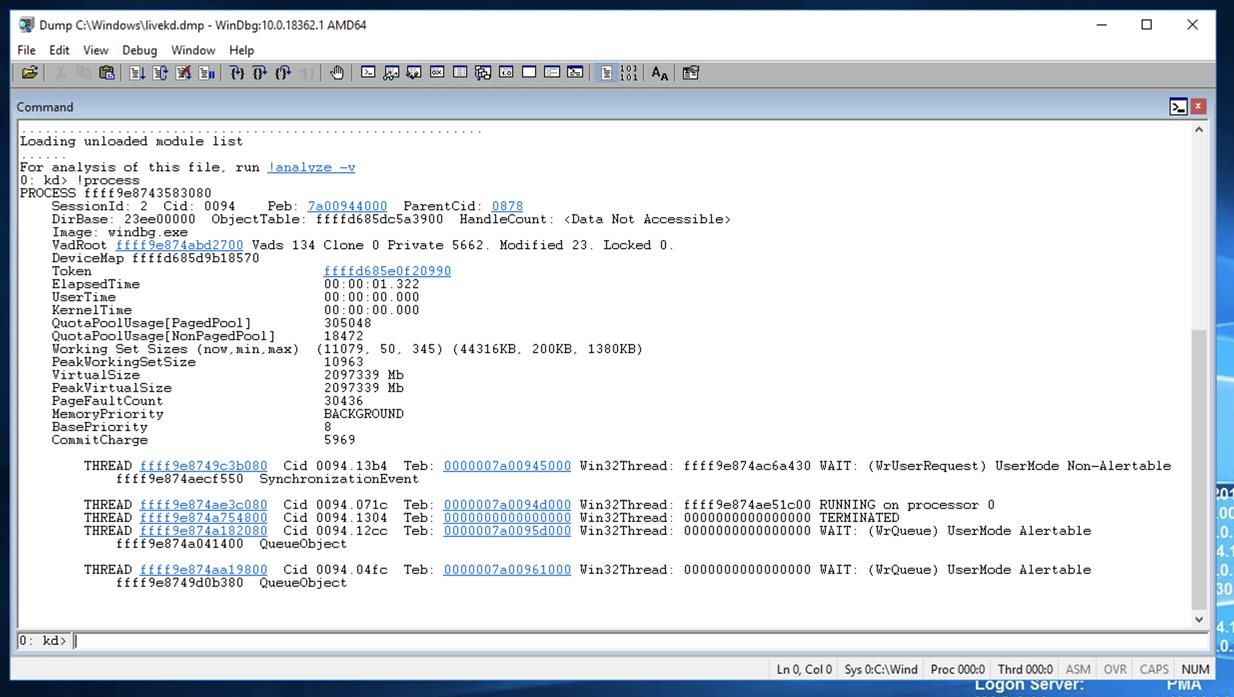
in the command bar, execute this command:
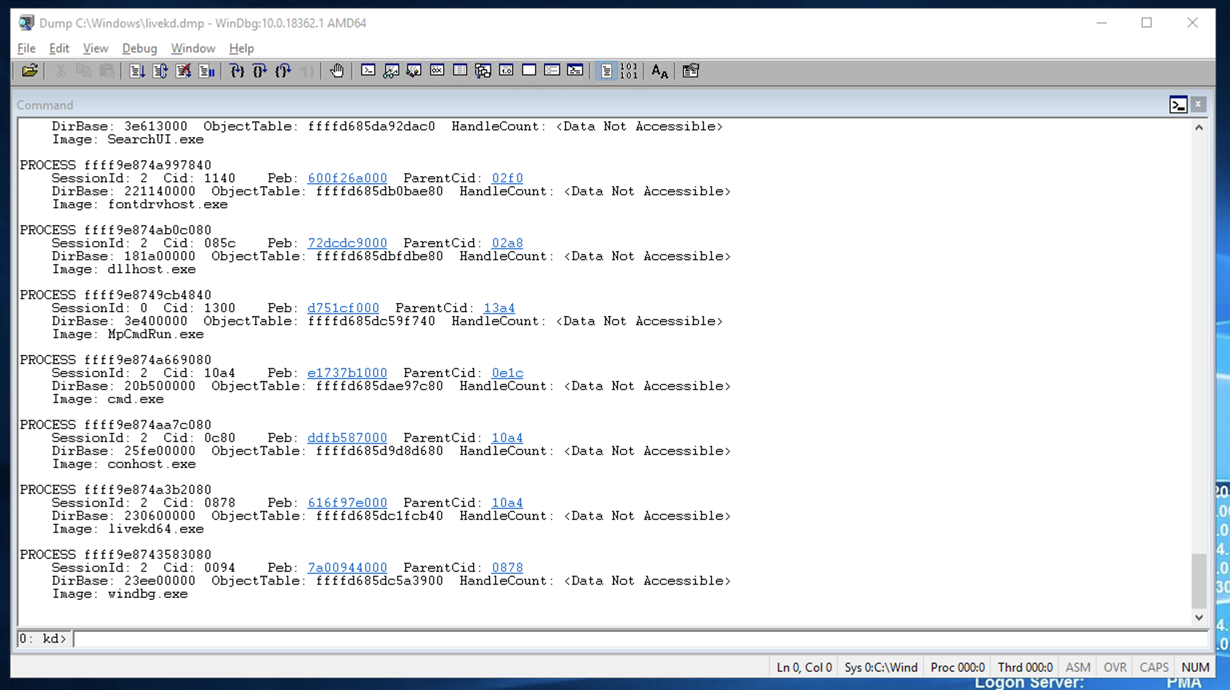
When I did it, the Cid was 0094 in hexadecimal,
which is 9*16 + 4 = 148.
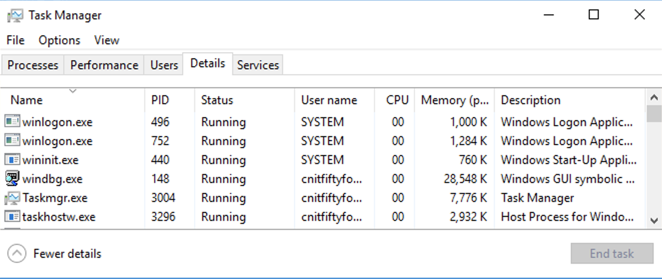
In Task Manager, click
"More details".
Click
the Details tab.
Find the windbg.exe process, and its PID,
as shown below. It should match the Cid from
Windbg.
Close Task Manager.
In Windbg,
at the bottom of the Command window,
in the command bar, execute this command:
At the bottom of the Command window,
in the command bar, execute this command:
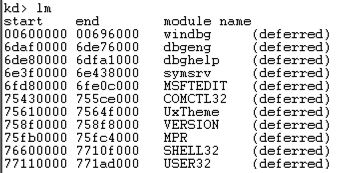
Scroll back to see the lm
command you entered, and the first few
loaded kernel modules, as shown below.
Scroll down to find the module named
ntdll,
or nt for short,
as shown below.
It's easy to spot because it'e one of the
few modules that shows a Symbols path.
This is Ntoskrnl, the main kernel
module.
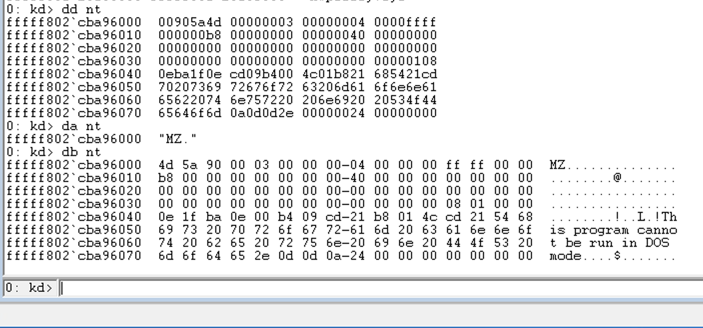
dd nt
You see the first several bytes of
Ntoskrnl.exe, as shown below.
This may be more familiar in
ASCII.
In WinDbg, execute this command:
da nt
You see the characters "MZ" --they
are at the start of every EXE file.
In WinDbg, execute this command:
db nt
This displays the bytes on the left,
and the ASCII on the right.
Now you can see the message
"This program cannot
be run in DOS mode",
which appears at the start
of many EXE files.
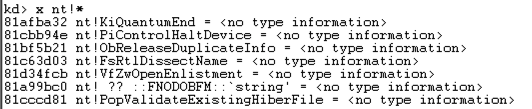
x nt!*
This finds all the functions in Ntoskrnl.
There are a lot of them,
as shown below. It may take a minute
or so to show them.
In WinDbg, execute this command:
x nt!*Create*
This finds all the symbols in Ntoskrnl
that contain the word "Create".
There are a lot of them, too.
In WinDbg, execute this command:
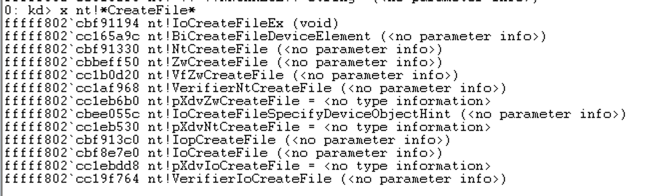
x nt!*CreateFile*
This finds all the symbols in Ntoskrnl
that contain the word "CreateFile".
There are only about ten of those,
including "nt!NtCreateFile",
as shown below:
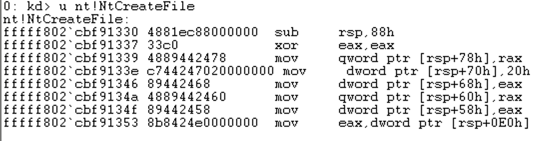
u nt!NtCreateFile
This shows the first few bytes of the
function, disassembled,
as shown below:
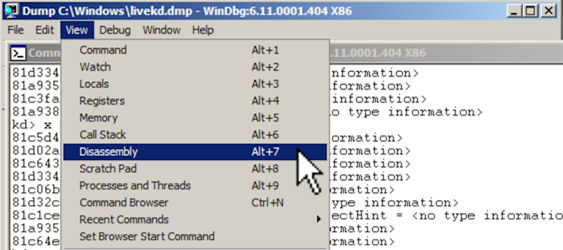
To see more of this function,
it helps to use the
WinDbg Disassembly window.
If the Command window is maximized,
make it smaller.
From the WinDbg menu bar, click
View, Disassembly,
as shown below:
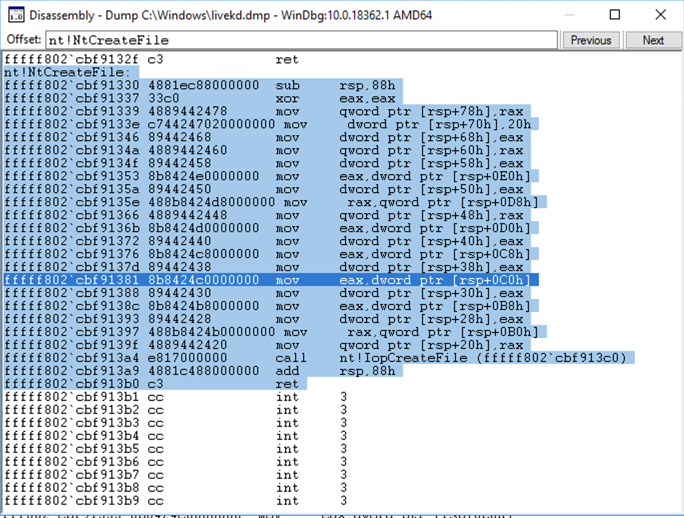
In the Offset bar at the top,
enter
nt!NtCreateFile
This shows the assembly code before
and after the start of the NtCreateFile
function.
By resizing the window,
clicking in it, and using the up-arrow
and down-arrow keys,
it is possible to see the entire
assembly code for this
function, as shown below:
Close the Disassembly window.
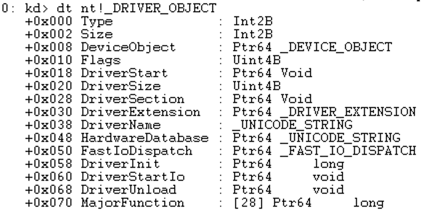
dt nt!_DRIVER_OBJECT
This shows the first few lines of
a driver object structure, which
stores information about a kernel
driver,
as shown below. Notice the DriverStart
pointer--this contains the location of the
driver in memory.
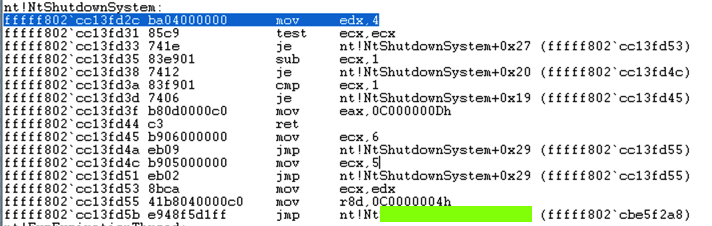
Find the text covered
by the green box
in the image below. That's the flag.
copy livekd64.exe c:\Windows\System32
setx path "%path%;C:\Program Files (x86)\Windows Kits\10\Debuggers\x64"
Using LiveKd
Close the Administrator Command Prompt window.
or
livekd64.exe -w
A "SYSINTERNALS SOFTWARE LICENSE TERMS" box pops up.
Click the Agree button.
livekd.exe -w
You should see the "kd> !process" command,
and its output, showing information
about the windbg process, including
its Cid number,
as shown below.
!process
Viewing Processes with Task Manager
At the bottom of the desktop, point to an unused portion
of the taskbar and right-click. Click
"Task Manager".
You see a long list of processes,
as shown below.
!process 0 0
Online Help
At the bottom of the Command window,
in the command bar, execute this command:
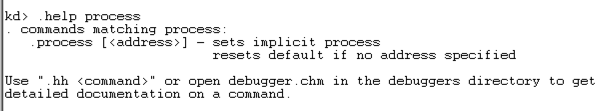
You see a brief help message about the
"process" command,
as shown below.
.help process
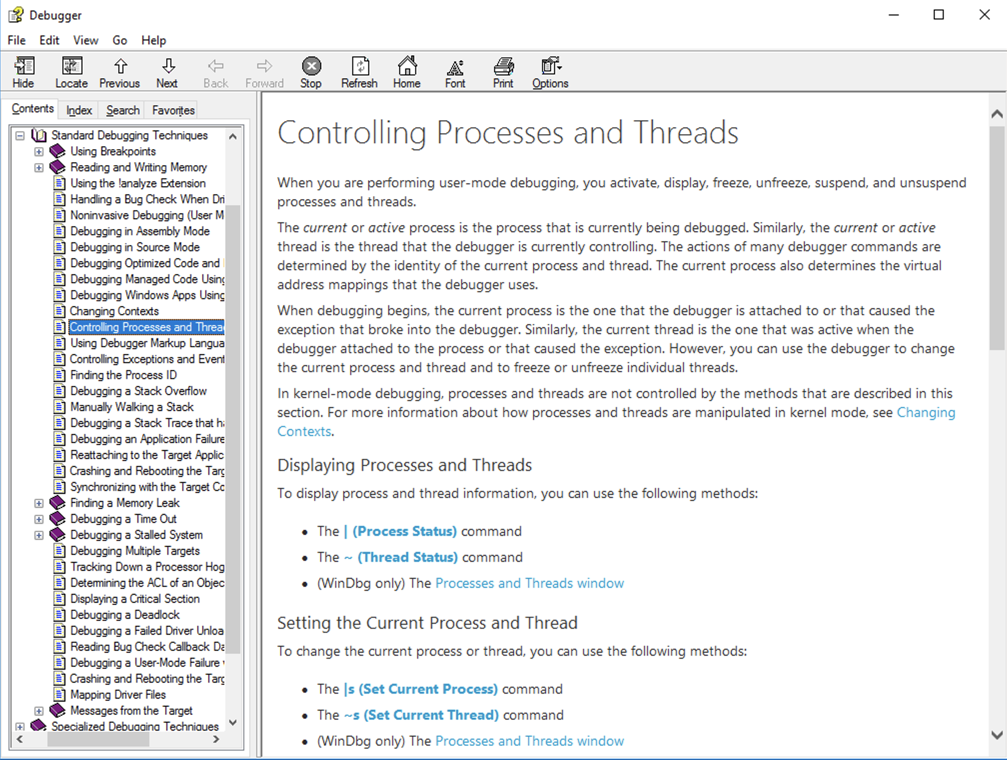
You see a much more complete help
window,
as shown below.
.hh process
Listing Modules with lm
At the bottom of the Command window,
in the command bar, execute this command:
A long list of all loaded modules scrolls
by.
lm
Viewing Memory
Here are some commands that display memory:
In WinDbg, execute this command:
dd Display dwords (32-bit values)
da Display ASCII text
db Display Bytes and ASCII text
dt Display Type: Information about a variable, data type, or structure
Examining Symbols
The x command examines
symbols, which include function names.
Searching for Functions
In WinDbg, execute this command:
Unassembling a Function
In WinDbg, execute this command:
Viewing Type Information for a Structure
In WinDbg, execute this command:
Flag PMA 410c.1: Function Name (5 pts)
Find the Windows kernel function that
has a name fitting this pattern:
two characters, RegistryKey,
then six more letters, like this:
That's the flag.
--RegistryKey------
Flag PMA 410c.2: nt!NtShutdownSystem (10 pts)
Disassemble the nt!NtShutdownSystem module.
References
Common WinDbg Commands (Thematically Grouped)
!process
Ported to Google Cloud 10-29-19
Note about Download button added 5-4-2021