We will use these three programs to see what the malware does:
If your virtual machine is in "NAT" networking mode, there shouldn't be a lot of traffic.
It's best to start Process Monitor last, so you can exclude all the harmless processes the other tools are using.
Launch Process Monitor. If a Security Warning box pops up, allow the software to run.
Agree to the license.
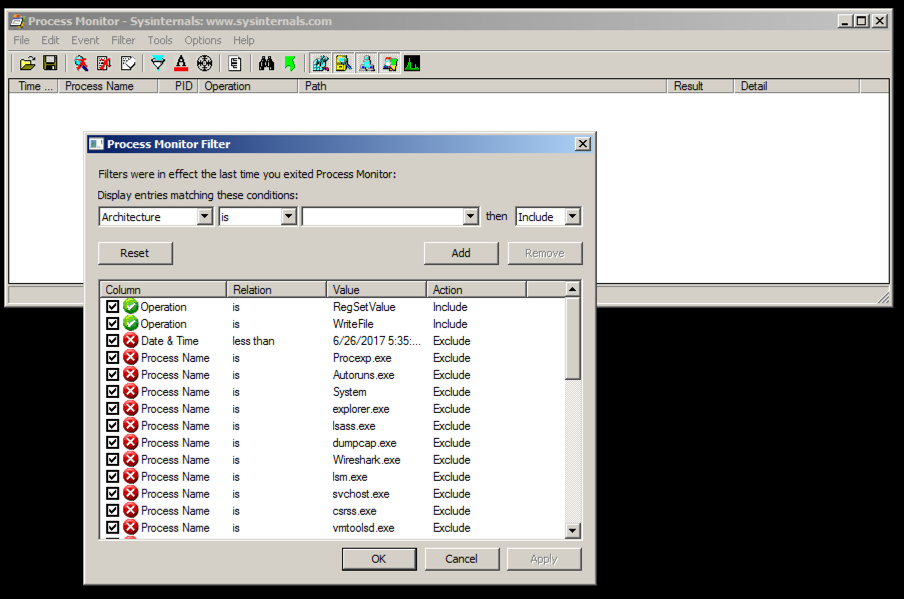
You see Process Monitor, with no visible events, as shown below.
The "Process Monitor Filter" box shows the events that are being excluded, which is why the box is empty before the malware runs.
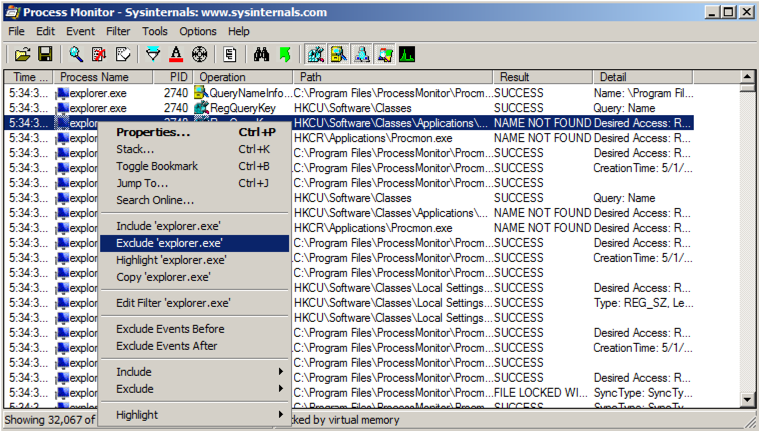
In Process Monitor, right-click the name of one of the visible processes, such as explorer.exe, and click "exclude 'lsass.exe'", as shown below:
Repeat the process until all current processes are hidden, as shown above. There were a lot of processes to ignore, perhaps 20 or 30.
Troubleshooting
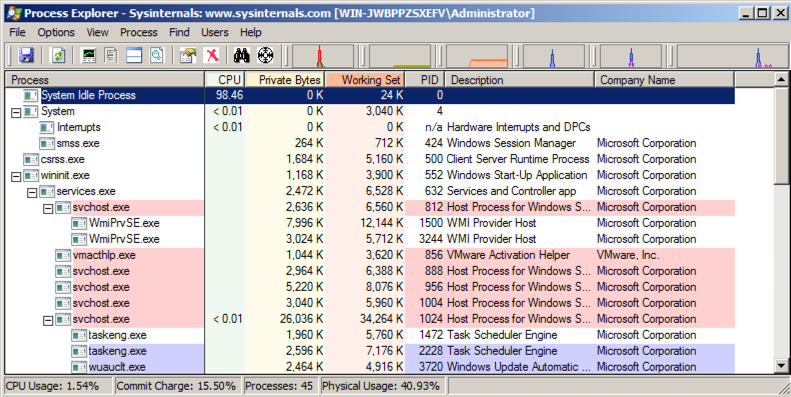
If the Lab03-01.exe process does not appear in Process Explorer, that probably means that the malware has already been run on this VM.To make the malware run properly again, open Process Explorer and kill the vmx32to64.exe process. Then delete this file:
C:\Windows\System32\vmx32to64.exe
In Process Explorer, click View, "Lower Pane View", Handles.
You see the WinVMX32 mutant, as highlighted below. A mutant, also called a mutex, is used for interprocess connunication. A wonderful explantion of mutexes in terms of rubber chickens is here.
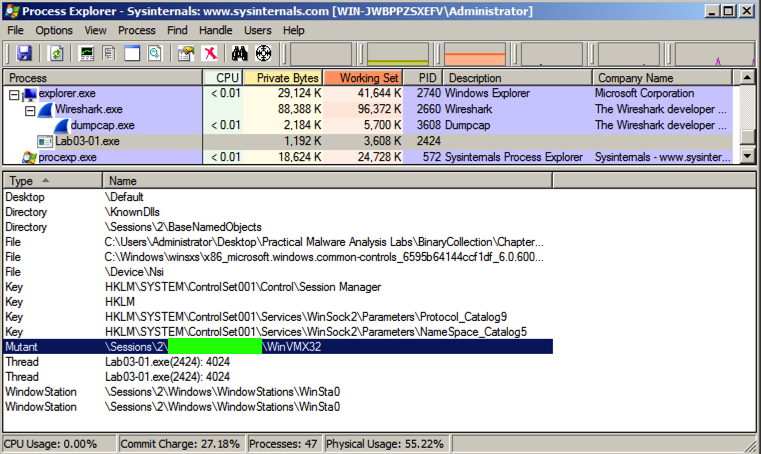
A folder name is covered by a green box in the image above. Enter that name into the form below.
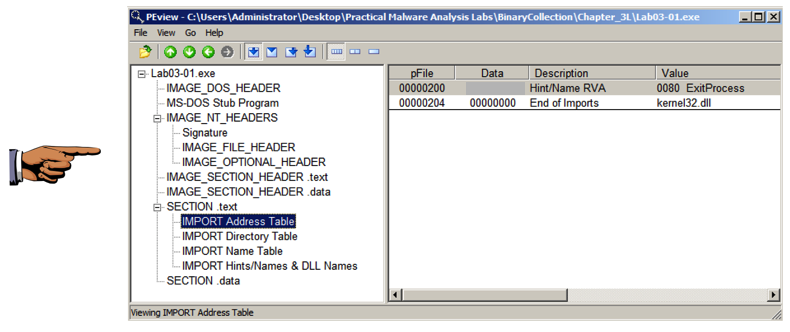
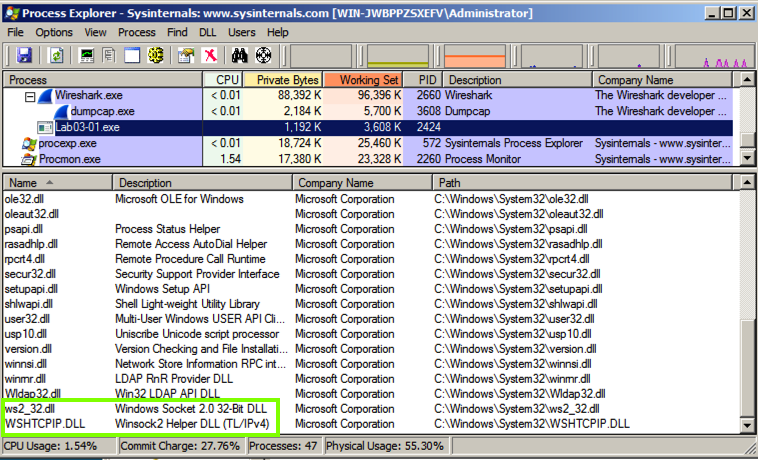
Scroll to the bottom to find ws2_32.dll and WSHTCPIP.DLL, as shown below. This shows that the malware has networking functionality.
In Process Monitor, click Filter, Filter. Enter a Filter for "Process Name" is Lab03-01.exe, Include, as shown below.
Click Add to add the filter.
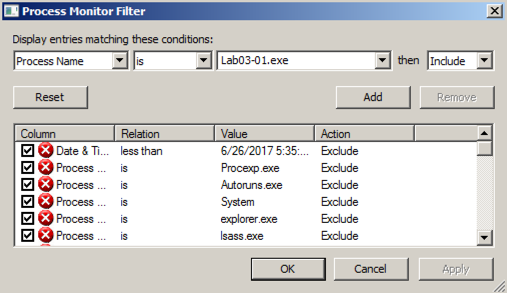
Add two more filters:
You end up with the two events shown below.
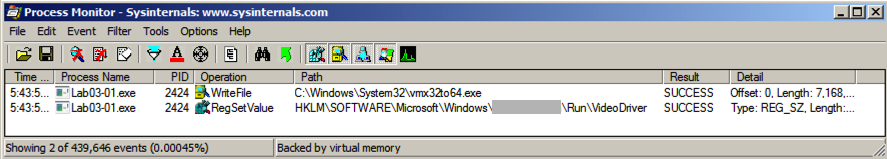
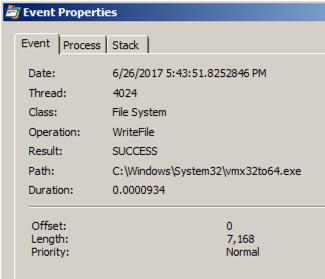
Double-click the event with a Path ending in vmx32to64.exe. The Properties sheet shows that this event creates a file named vmx32to64.exe, as shown below.
The malware wrote 7,168 bytes--the same size as Lab03-01.exe itself. The malware copied itself to a file named vmx32to64.exe, so that filename is a useful Indicator of Compromise.
Double-click the event with a Path ending in VideoDriver.
This event creates a new a Run key in the registry named "VideoDriver" with a value of "C:\WINDOWS\system32\vmx32to64.exe" -- this is a persistence mechanism, to re-launch the malware when the machine restarts.

A folder name is covered by a green box in the image above. Enter that name into the form below.
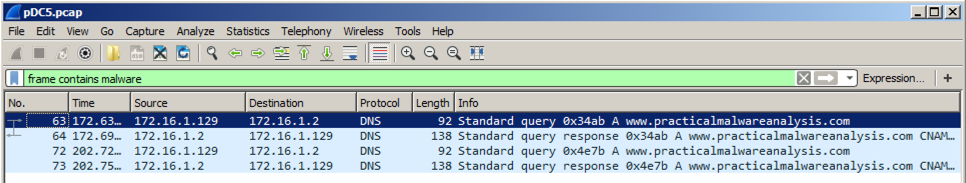
At the top left of the Wireshark window, in the Filter bar, type a filter of
frame contains malware
Every 30 seconds, the malware performs a DNS lookup for the domain "www.practicalmalwaresnalysis.com".
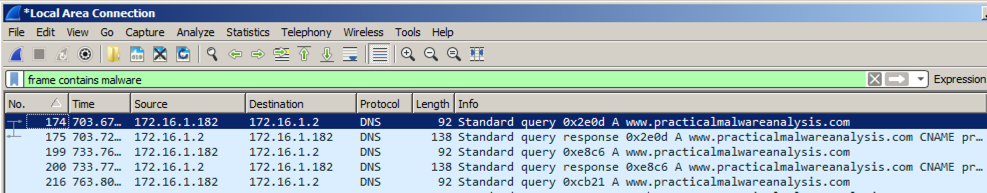
Click the line showing the first DNS request for www.practicalmalwareanalysis.com -- in the example above, it is packet 174.
In the top right of Wireshark, in the green filter bar, click the X button, or the Clear word in some versions of Wireshark, to clear the filter.
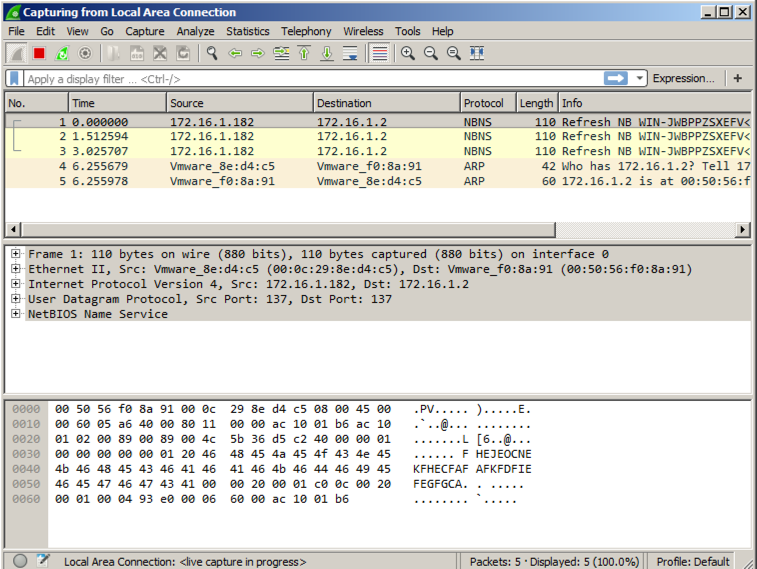
The packets following the DNS request appear, as shown below. Notice these items:
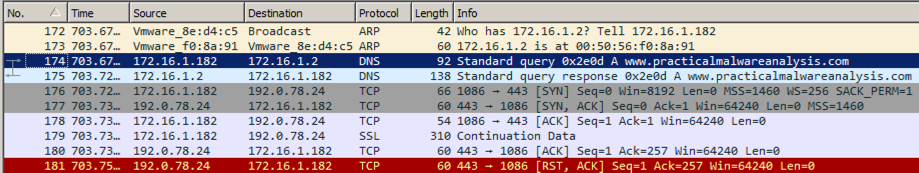
This is intended to fool a firewall into thinking it's HTTPS traffic, but there is no actual encryption or key exchange. A real HTTPS connection contains many more packets, such as "Client Hello", "Server Hello", and "Change Cipher Spec".
Find the SYN packet sent to the https port, which may be marked "443". In the example above, it is packet 176. Right-click it and click "Follow TCP Stream".
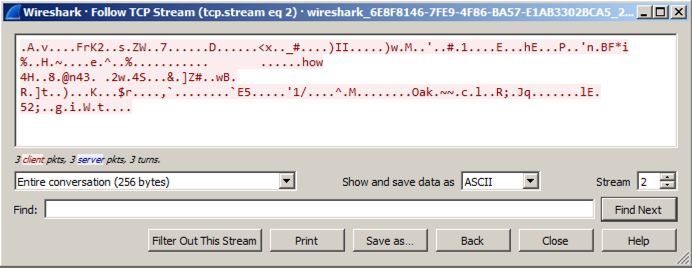
You see 256 bytes of random data, as shown below. These are beacons and are used by malware to notify the Command and Control server that the machine is infected and ready to use.
The file contains two malware beacons, as shown below.
Follow the TCP stream in the second beacon. You should see random bytes, as shown below.
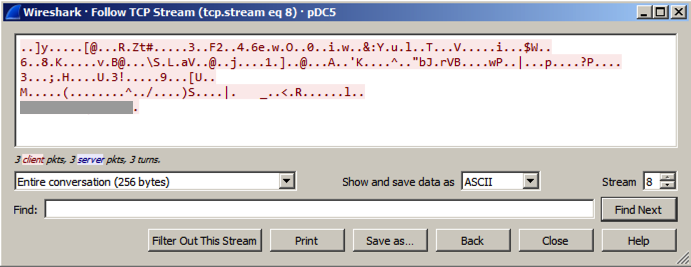
The last line of the beacon contains six readable characters, which are redacted in the image above. Enter those six characters into the form below to record your success.