
http://splunk.force.com/SplunkCloud?prdType=SplunkCloud
On the right side, click "Splunk Enterprise Security" box, as shown below.
The screen scrolls down. Click FREE as shown below.

The screen scrolls down. Click Continue as shown below.

On the next page, create an account. Use an email address you can receive mail at.
After a few seconds, a page appears saying "Your Splunk Enterprise Security Sandbox Is Ready!", as shown below.

Click "View My Instance".
Accept the terms and click OK.
The main Splunk Enterprise Security page appears, as shown below.

The Security Posture dashboard opens, as shown below.
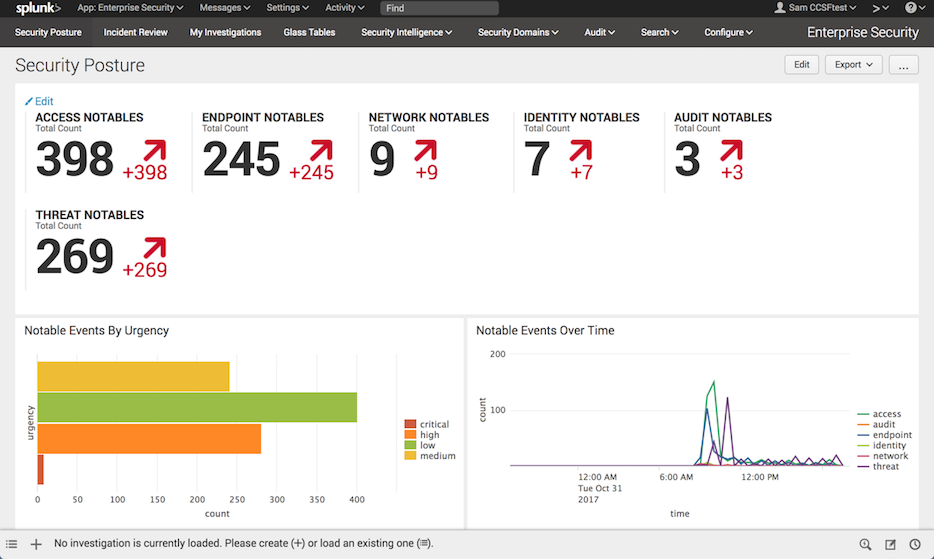
The top section has counts of "NOTABLES". In "IDENTITY NOTABLES", click 7.
You see the raw Splunk query that created this number, as shown below.
This doesn't seem to be useful.

In your browser, click the Back button to return to the Security Posture dashboard.
An "Incident Review" page appears, as shown below.
Notice the list of eight events at the bottom, with useful titles.

In your browser, click the Back button to return to the Security Posture dashboard.
At the lower left find, "Top Notable Events" as shown below.

Click "Activity from Expired User Identity".
The user identities that tried to log in appear, as shown below.

In your browser, click the Back button to return to the Security Posture dashboard.
Save a FULL DESKTOP image with the filename Proj 4x from Your Name.