Download from Splunk: http://docs.splunk.com/images/Tutorial/tutorialdata.zip
Alternative download: tutorialdata.zip
localhost:8000
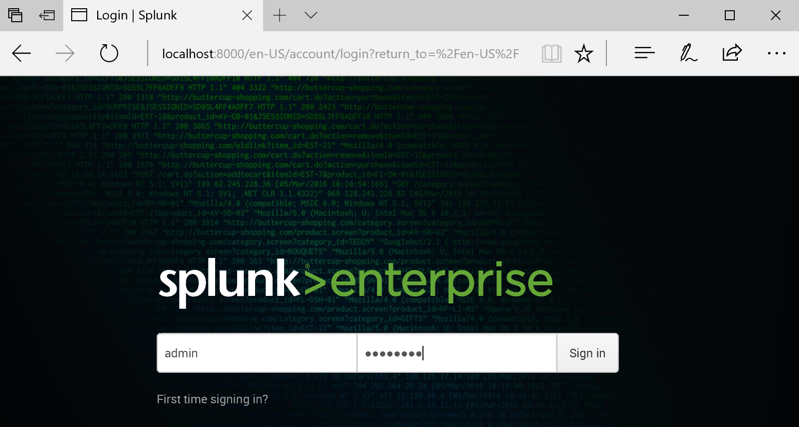
A Splunk login page appears, as shown below.
Log in. If you followed the steps in the previous tutorial, your credentials are admin and P@ssw0rd
Under Explore Splunk Enterprise, click "Add data".
On the next page, click upload.
Drag the tutorialdata.zip file and drop it onto the "Select Source" page.
The filename appears as a "Selected File" as shown below.
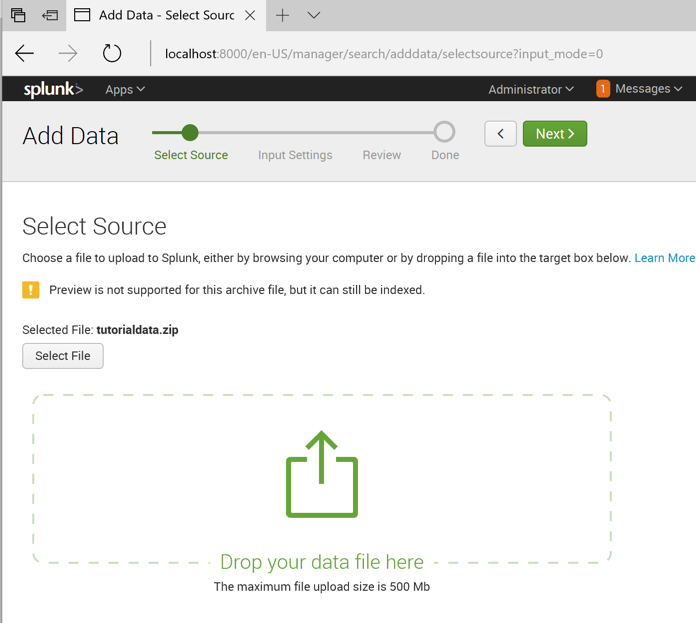
In the top right of the window, click Next.
We need to tell Splunk how to find the hostname in this data.
In the "Input Settings" page, in the center, click "Regular expression on path".
Enter a "Segment number" of
\\(.*)\/
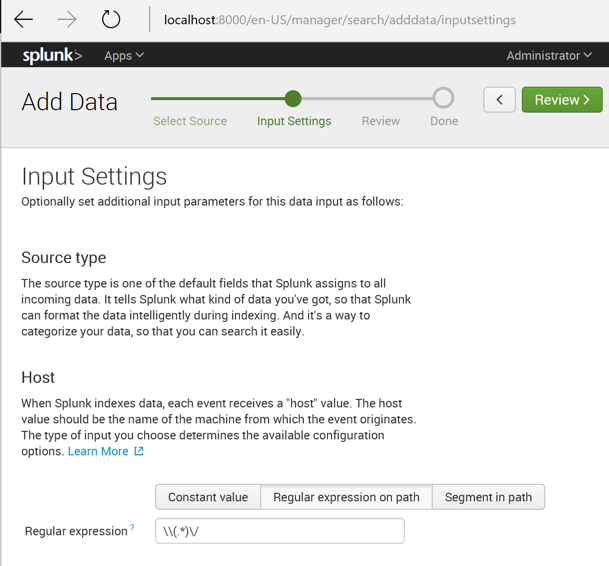
In the top right of the window, click Review.
Click Submit.
Click "Start Searching".
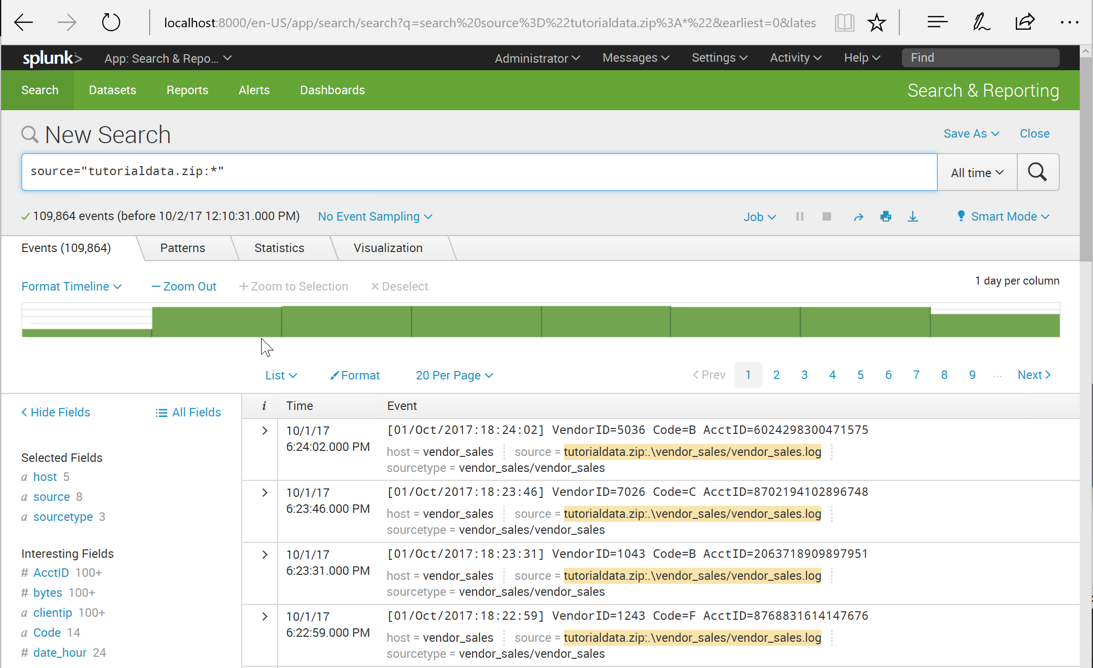
The "New Search" page loads, and populates with data. as shown below.
Just below the search bar, on the left side, it tells you that there are 109,854 events.
The whole point of Splunk is to make it easy to search through large data sets. Splunk is often described as "Google for log data".
Click "Search & Reporting".
The Search app opens, as shown below.

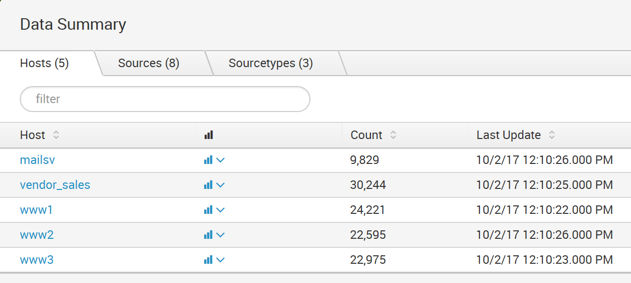
On the right side, in the "What to Search" panel, click the "Data Summary" button.
The Hosts tab shows five hosts in this dataset, as shown below.
These are the computers that were monitored to collect this data.
Click the Sources tab to see the eight sources shown below, all of which are log files.

Here are the three source types that are in the tutorial data:
Click tutorialdata.zip:./www1/access.log
A new search runs. The events that match the search appear in the lower portion of the screen, as shown below.
There are GET and POST requests logged here.

At the top right of the New Search window, expand the date range as needed to see data. On 12-11-17, you need to choose one that goes back a month to see data.
At the top center of the window, the Timeline is visible, showing a green bar for every hour of data.
Move the mouse to hover over a bar. A black pop-up box shows the number of events in that hour, as shown below.
Click the green bar. The data are filtered to show only the events during that hour, as shown below.

In the Search field, type
butter
In the suggestion list, click buttercupgames.

On the right side, click the magnifying glass icon to run the search.
Splunk shows the matching records, highlighting the search term in the results, as shown below.

Save a FULL DESKTOP image with the filename Proj 3x from Your Name.
buttercupgames AND error
The keyword AND is not needed. If multiple items are in the search, Splunk connects them with AND by default.
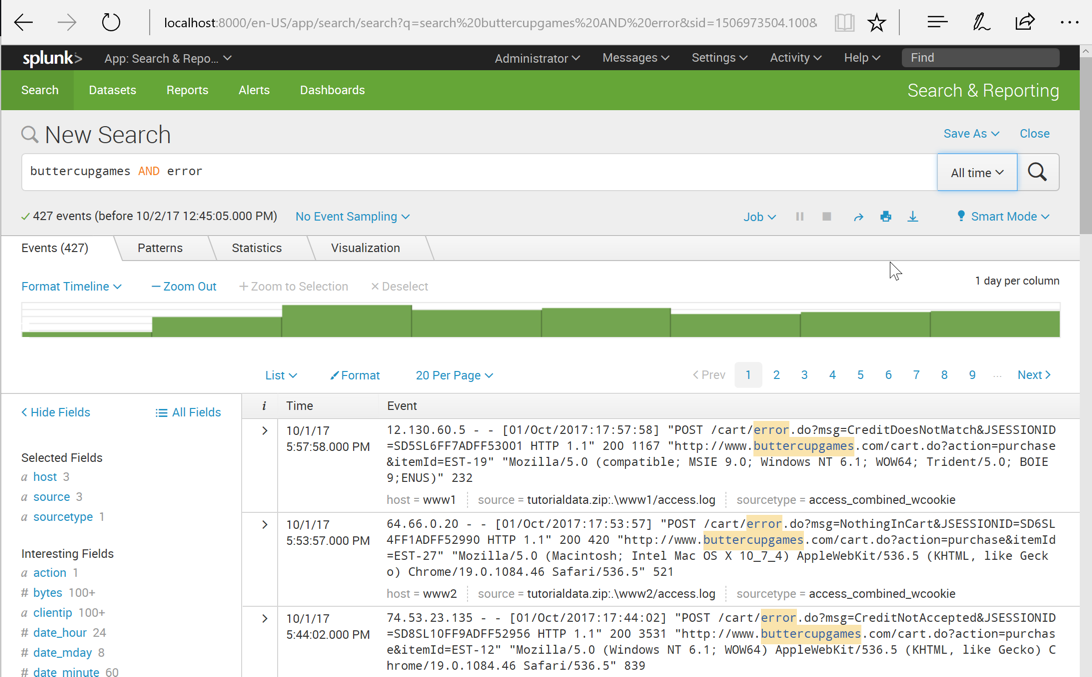
Change the search to
buttercupgames error
Splunk finds 427 results, as shown below.
