
Logstash is an open source tool for collecting, parsing, and storing logs for future use. Kibana is a web interface that can be used to search and view the logs that Logstash has indexed. Both of these tools are based on Elasticsearch, which is used for storing logs.
Create a new virtual machine and install it. The procedure is the same as you used to install Security Onion.
On your server, in a Terminal window, execute these commands:
sudo apt update
sudo apt install openssh-server -y
ifconfig
If you are using a PC, you probably don't have an SSH client, so use PuTTY.
ssh student@172.16.1.192
Now you can copy and paste commands into the SSH client, which will make the process much easier.
sudo apt install software-properties-common -y
Execute these commands:
sudo add-apt-repository -y ppa:webupd8team/java
sudo apt update
sudo apt -y install oracle-java8-installer
wget -qO - https://packages.elastic.co/GPG-KEY-elasticsearch | sudo apt-key add -

echo "deb http://packages.elastic.co/elasticsearch/2.x/debian stable main" | sudo tee -a /etc/apt/sources.list.d/elasticsearch-2.x.list

sudo apt update

sudo apt -y install elasticsearch
sudo nano /etc/elasticsearch/elasticsearch.yml
network.host: localhost
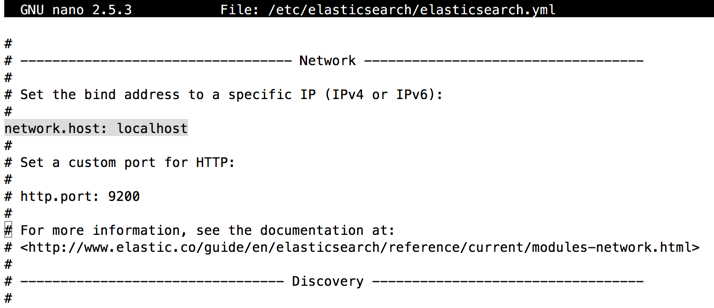
Press Ctrl+X, Y, Enter to save the file.
Execute these commands:
sudo systemctl restart elasticsearch
sudo systemctl daemon-reload
sudo systemctl enable elasticsearch
sudo netstat -pant
If you do not, wait 1-2 minutes and try again--Java is slow to start.

echo "deb http://packages.elastic.co/kibana/4.5/debian stable main" | sudo tee -a /etc/apt/sources.list

sudo apt-get update

sudo apt install kibana
sudo nano /opt/kibana/config/kibana.yml

Press Ctrl+X, Y, Enter to save the file.
Execute these commands:
sudo systemctl daemon-reload
sudo systemctl enable kibana
sudo systemctl start kibana
sudo netstat -pant

echo "deb http://packages.elastic.co/logstash/2.3/debian stable main" | sudo tee -a /etc/apt/sources.list

sudo apt-get update
sudo apt-get install logstash
First create the input file with this command:
sudo nano /etc/logstash/conf.d/02-beats-input.conf
input {
  beats {
    port => 5044
    ssl => false
  }
}

Press Ctrl+X, Y, Enter to save the file.
This specifies a beats input that will listen on TCP port 5044.
Create the filter file with this command:
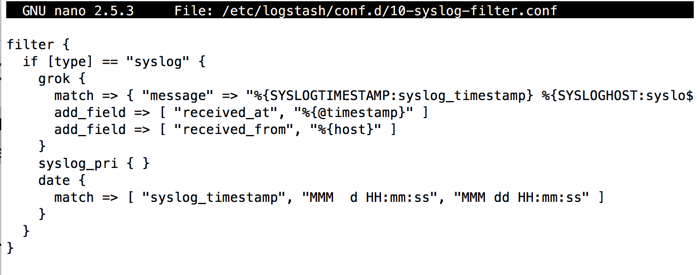
sudo nano /etc/logstash/conf.d/10-syslog-filter.conf
filter {
  if [type] == "syslog" {
    grok {
      match => { "message" => "%{SYSLOGTIMESTAMP:syslog_timestamp} %{SYSLOGHOST:syslog_hostname} %{DATA:syslog_program}(?:\[%{POSINT:syslog_pid}\])?: %{GREEDYDATA:syslog_message}" }
      add_field => [ "received_at", "%{@timestamp}" ]
      add_field => [ "received_from", "%{host}" ]
    }
    syslog_pri { }
    date {
      match => [ "syslog_timestamp", "MMM  d HH:mm:ss", "MMM dd HH:mm:ss" ]
    }
  }
}
Press Ctrl+X, Y, Enter to save the file.
This filter looks for logs that are labeled as "syslog" type (by Filebeat), and it will try to use grok to parse incoming syslog logs to make it structured and query-able.
Create the output file with this command:
sudo nano /etc/logstash/conf.d/30-elasticsearch-output.conf
output {
  elasticsearch {
    hosts => ["localhost:9200"]
    sniffing => true
    manage_template => false
    index => "%{[@metadata][beat]}-%{+YYYY.MM.dd}"
    document_type => "%{[@metadata][type]}"
  }
}

Press Ctrl+X, Y, Enter to save the file.
Execute this command to test your configuration files:
sudo /opt/logstash/bin/logstash --configtest -f /etc/logstash/conf.d/

If there are errors, check these three files for mistakes:
/etc/logstash/conf.d/02-beats-input.conf
/etc/logstash/conf.d/10-syslog-filter.conf
/etc/logstash/conf.d/30-elasticsearch-output.conf
Execute these commands:
sudo systemctl restart logstash
sudo /lib/systemd/systemd-sysv-install enable logstash
sudo netstat -pant | grep 5044

cd ~
sudo apt install curl -y
curl -L -O https://download.elastic.co/beats/dashboards/beats-dashboards-1.2.2.zip

sudo apt-get -y install unzip

unzip beats-dashboards-*.zip
cd beats-dashboards-*
./load.sh


cd ~
curl -O https://gist.githubusercontent.com/thisismitch/3429023e8438cc25b86c/raw/d8c479e2a1adcea8b1fe86570e42abab0f10f364/filebeat-index-template.json
curl -XPUT 'http://localhost:9200/_template/filebeat?pretty' -d@filebeat-index-template.json

The server is now ready. Next we need to configure clients to send log files to the server.
Execute these commands:
Note for Other Servers
These commands (or equivalent commands) have already been executed on your ELK server, but to gather data from other Ubuntu servers, you'd need to execute these commands now:scp /etc/pki/tls/certs/logstash-forwarder.crt user@client_server_private_address:/tmp sudo mkdir -p /etc/pki/tls/certs sudo cp /tmp/logstash-forwarder.crt /etc/pki/tls/certs/ echo "deb https://packages.elastic.co/beats/apt stable main" | sudo tee -a /etc/apt/sources.list.d/beats.list wget -qO - https://packages.elastic.co/GPG-KEY-elasticsearch | sudo apt-key add - sudo apt-get update
wget https://download.elastic.co/beats/filebeat/filebeat_1.3.1_amd64.deb
sudo dpkg -i filebeat_1.3.1_amd64.deb
sudo nano /etc/filebeat/filebeat.yml

Now scroll about 7 pages down to the Elasticsearch as output section, as highlighted in the image below.

Scroll down several pages to find the end of this section, as highlighted in the image below.

You need to delete the entire Elasticsearch as output section, which is too large to see in a single screen.
To do that, scroll back up to the top of the Elasticsearch as output section, place the cursor in the first line, which contains elasticsearch:.
Then press Ctrl+K to delete that line.
Your screen should look like the image below:

Press Ctrl+K many more times, until the entire Elasticsearch as output section is gone, as shown below.
Don't delete the "### Logstash as output" line.

Below the "### Logstash as output" line, find the #logstash: line and delete the # to uncomment it, as shown below.

Two lines later, find the line that says
#hosts: ["localhost:5044"]

This configures Filebeat to connect to Logstash on your ELK Server at port 5044 (the port that we specified a Logstash input for earlier). Press Ctrl+X, Y, Enter to save the file.
Now execute these commands to restart Filebeat to put our changes into place:
sudo systemctl restart filebeat
sudo systemctl enable filebeat
sudo filebeat -c /etc/filebeat/filebeat.yml -configtest
Execute this command to see the Filebeat index:
curl -XGET 'http://localhost:9200/filebeat-*/_search?pretty' | more
If you get zero hits, something is wrong with your filebeat configuration file.

Troubleshooting
If you want to see Filebeat messages, edit the /etc/filebeat/filebeat.yml file and change the level to warning, as shown below.
Then restart filebeat and view the syslog with this command, as shown below.
tail /var/log/syslog
You see a page prompting you to configure a default index pattern, as shown below.

On the left side, click filebeat-*, as shown below.

On the next page, at the center top, click the green asterisk.
Troubleshooting
If there is no entry on the left side, click the "Use event times to create index names [DEPRECATED]" button and type in the pattern:[filebeat-[YYYY.MM.DD
Save it with a button on the bottom of the page.
At the top left, click Discover.
A histogram appears with green bars, showing the log entries for the last 15 minutes, as shown below.

Capture a whole-desktop image and save it as "Proj 1x from YOURNAME".
YOU MUST SEND IN A WHOLE-DESKTOP IMAGE FOR FULL CREDIT
Send a Cc to yourself.
Last Modified: 10-10-17 9:42 pm
Revised with "index pattern" troubleshooting 11-21-17
Revised with more troubleshooting and tests 12-11-17 5 am
Revised fpr installing unanthenticated packates 12-12-17

