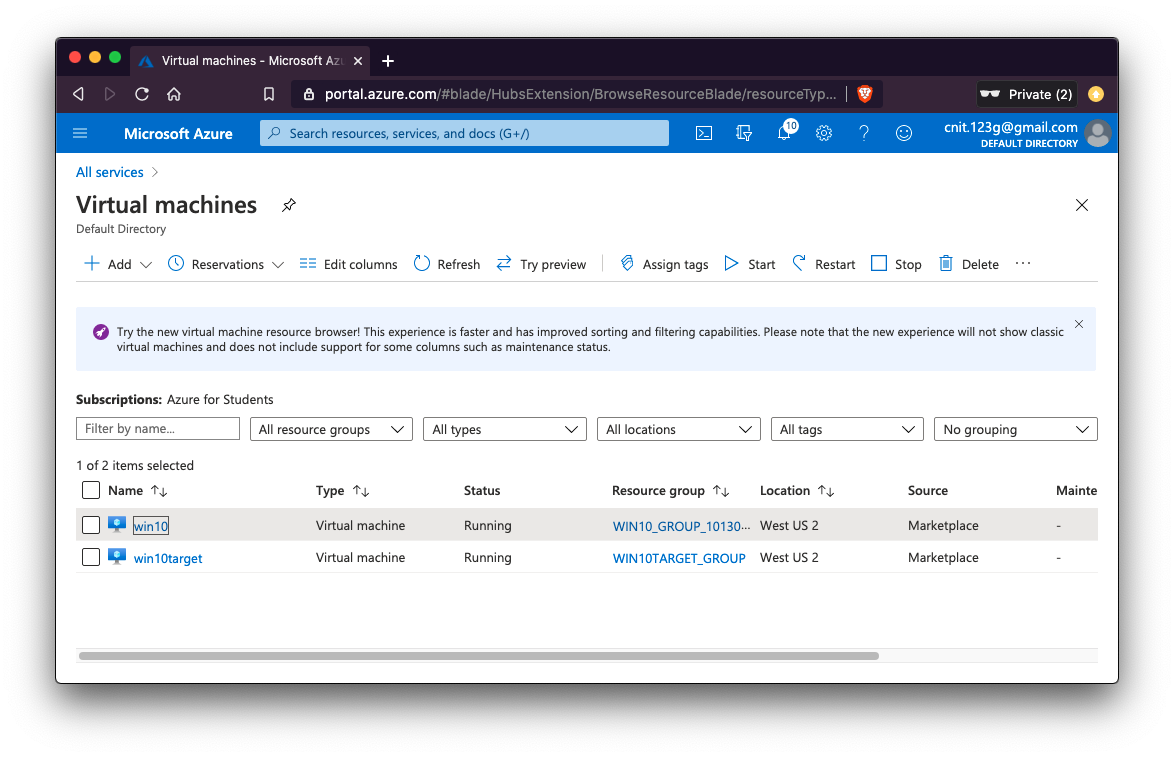
Click one of your machine names. On the next page, examine the "Virtual network/subnet" name, as shown below.
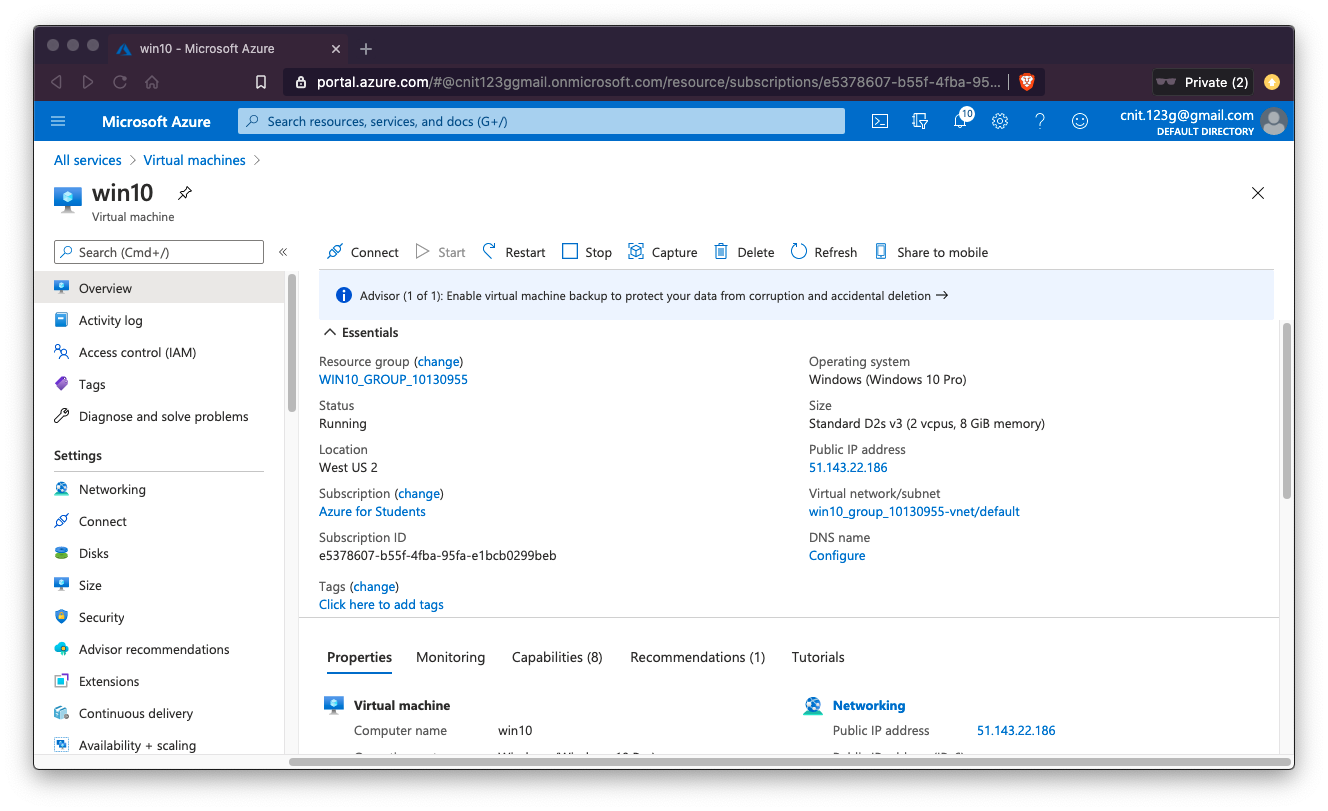
Repeat the process for your other machine. Make sure both machines are in the same "Virtual network/subnet". If necessary, click the name of the "Virtual network/subnet" on one of the machines and change it.
Pick one machine to be the host. The other one is the target.
I used an Azure FLARE-VM as the host and an Azure Window 10 VM as the target.
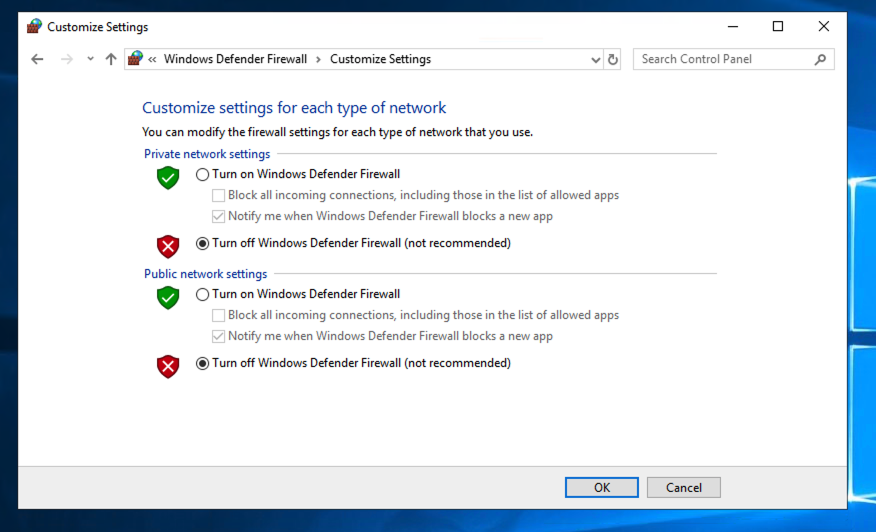
Click "Windows Defender Firewall".
In the left pane, click "Turn Windows Defender Firewall on or off".
Click both "Turn off..." buttons, as shown below.
Then click OK.
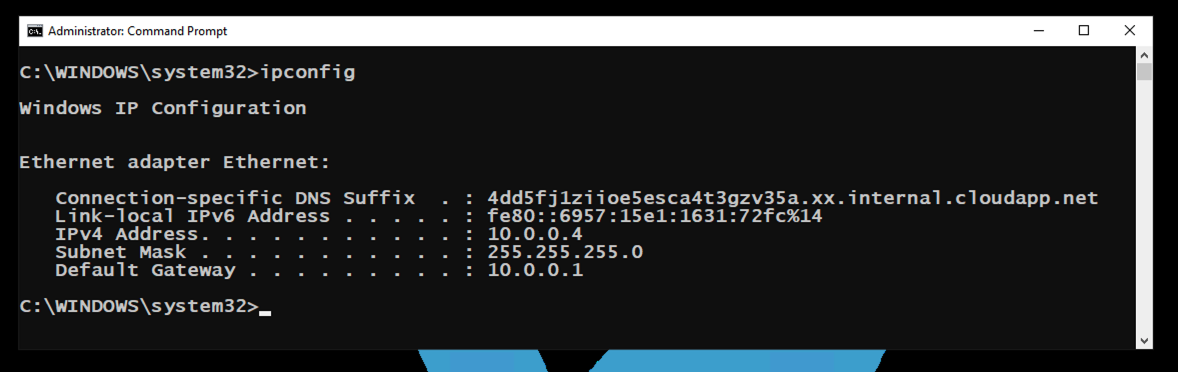
In the Command Prompt, execute this command:
ipconfig
On my system, it was 10.0.0.4, as shown below.
On the target computer, click the Start button and type CMD. Right-click "Command Prompt" and click "Run as Administrator".
If a User Account Control box pops up, click Yes.
In the Administrator Command Prompt, execute this command:
ipconfig
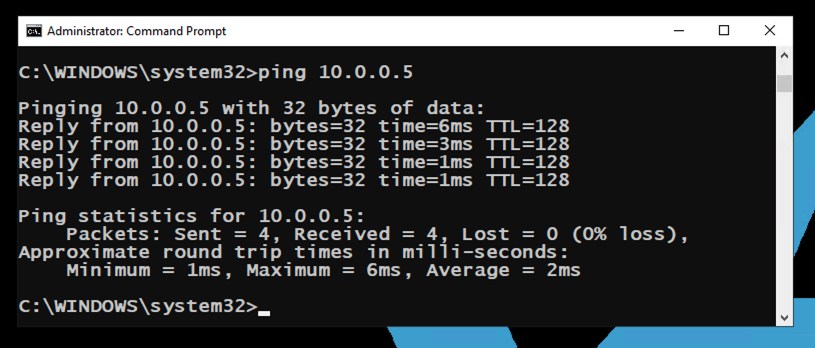
On my system, it was 10.0.0.5. On the host computer, in the Command Prompt and execute this command, replacing the IP address with the IP address of your target computer.
ping 10.0.0.5
On the target computer, in the Administrator Commmand Prompt, press Ctrl+C to stop ncat.
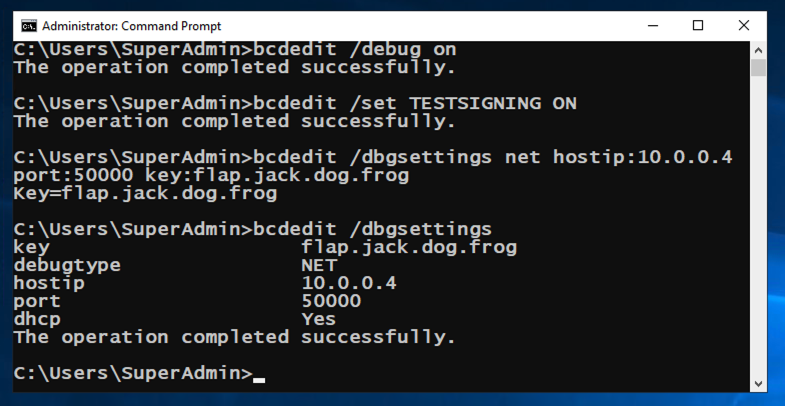
Then execute these commands, replacing the IP address with the IP address of your host computer.
bcdedit /debug on
bcdedit /set TESTSIGNING ON
bcdedit /dbgsettings net hostip:10.0.0.4 port:50000 key:flap.jack.dog.frog
bcdedit /dbgsettings
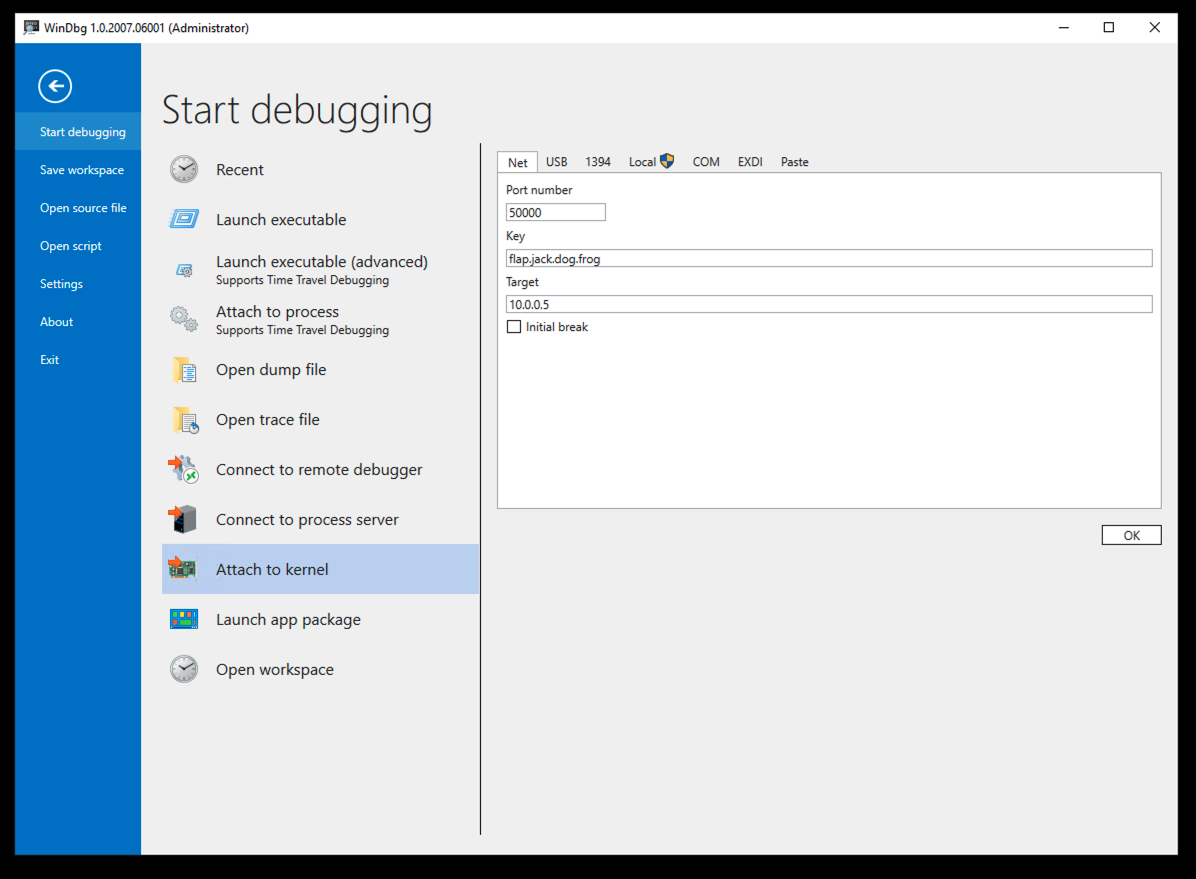
In the right pane, on the Net tab, enter these values, replacing the IP address with the IP address of your target computer.
At the lower right, click the OK button.
shutdown -r -t 0
Wait a minute or two and reconnect it.
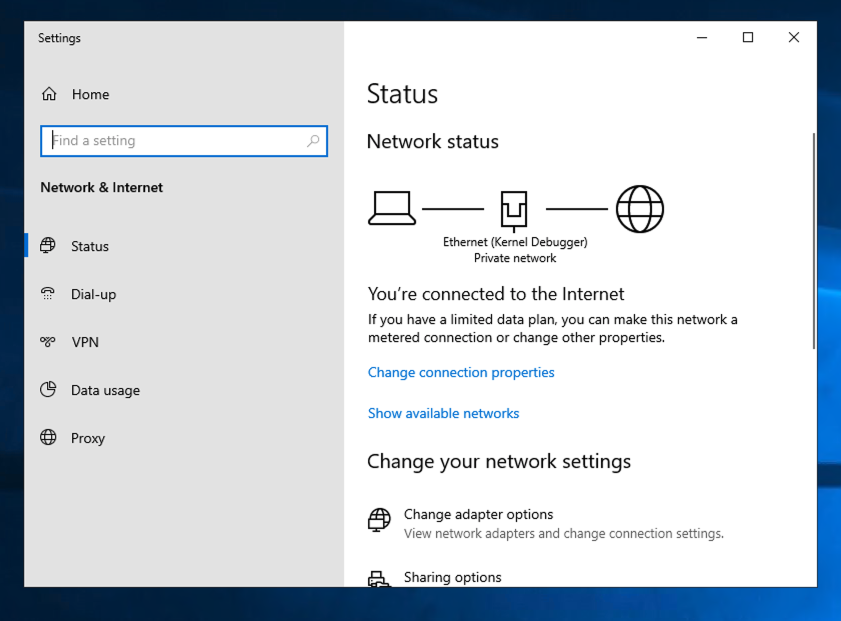
In the "Status" page, click "Change adapter options".
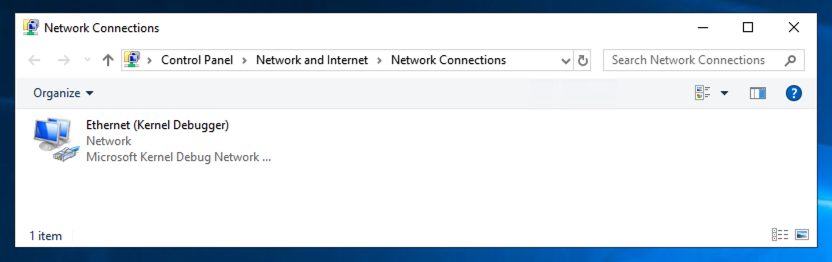
The name of your network adapter is now "Ethernet (Kernel Debugger)", as shown below.
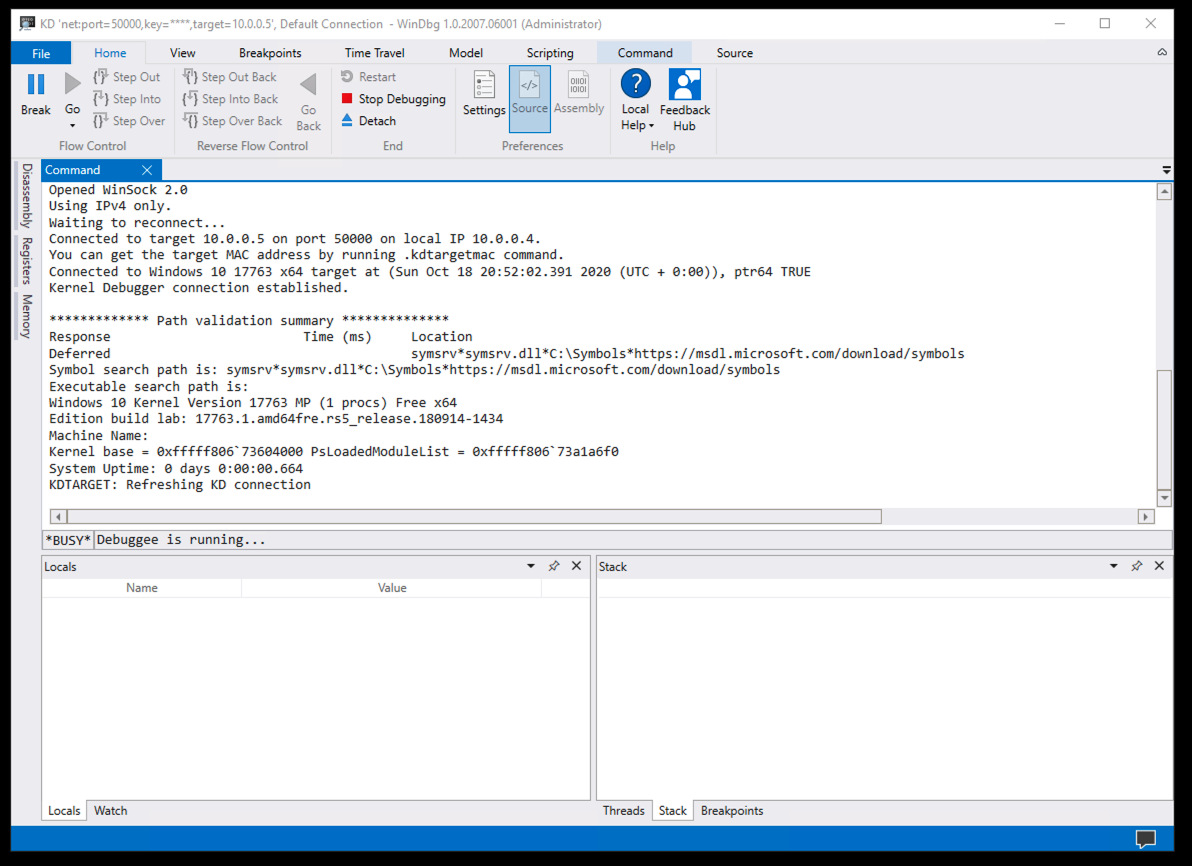
At the top left of WinDbg, click Break.
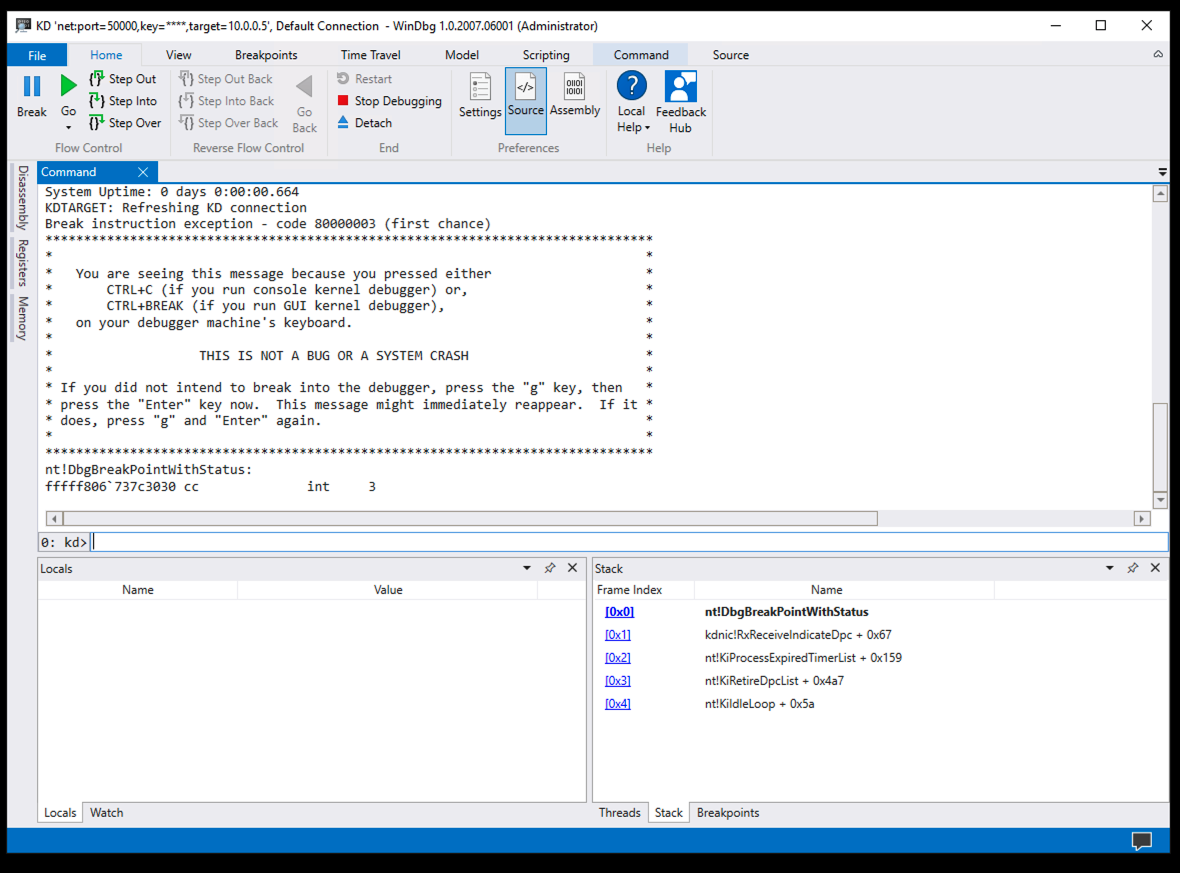
Try clicking your target computer's desktop. There is no response, and RDP loses the connection. The target computer has stopped at a breakpoint, as shown in WinDbg, as shown below.
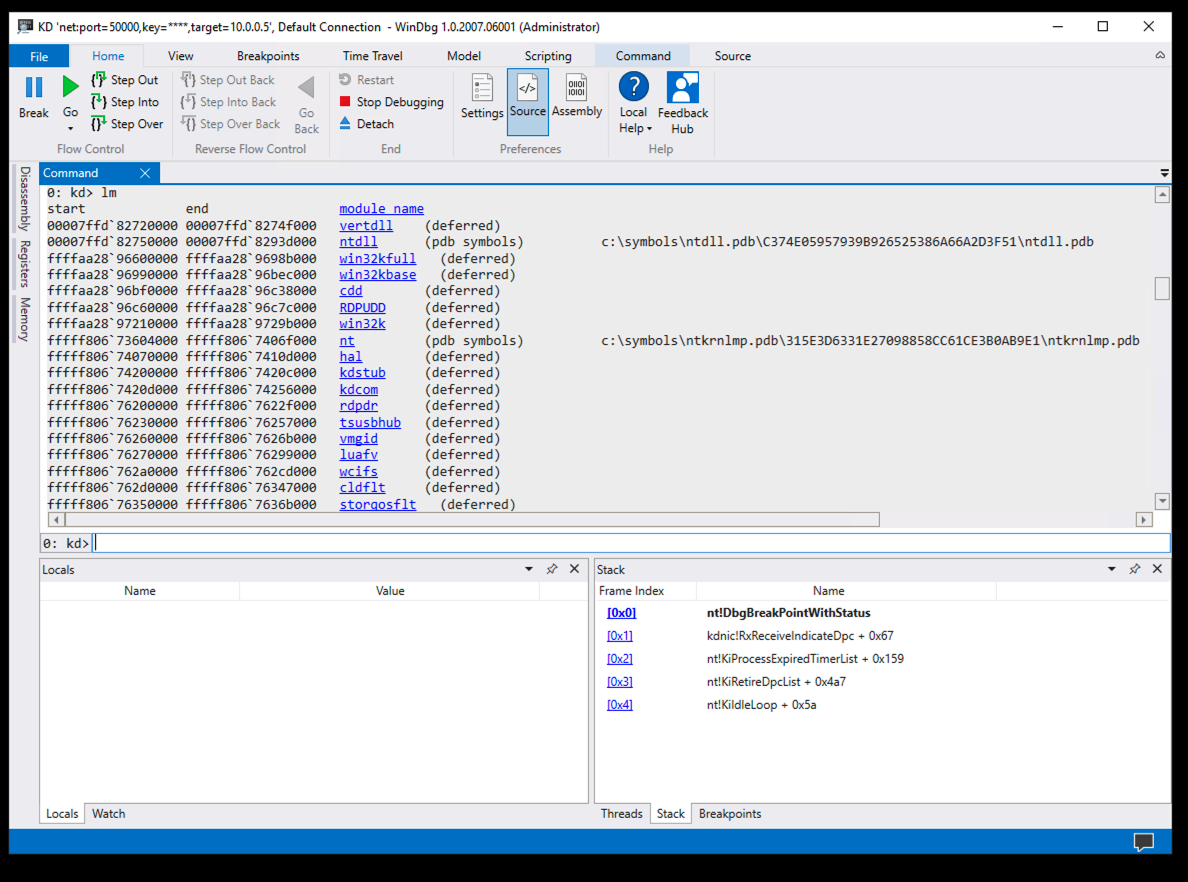
lm
However, most of them don't have symbols.
!sym noisy
.reload /f
lm
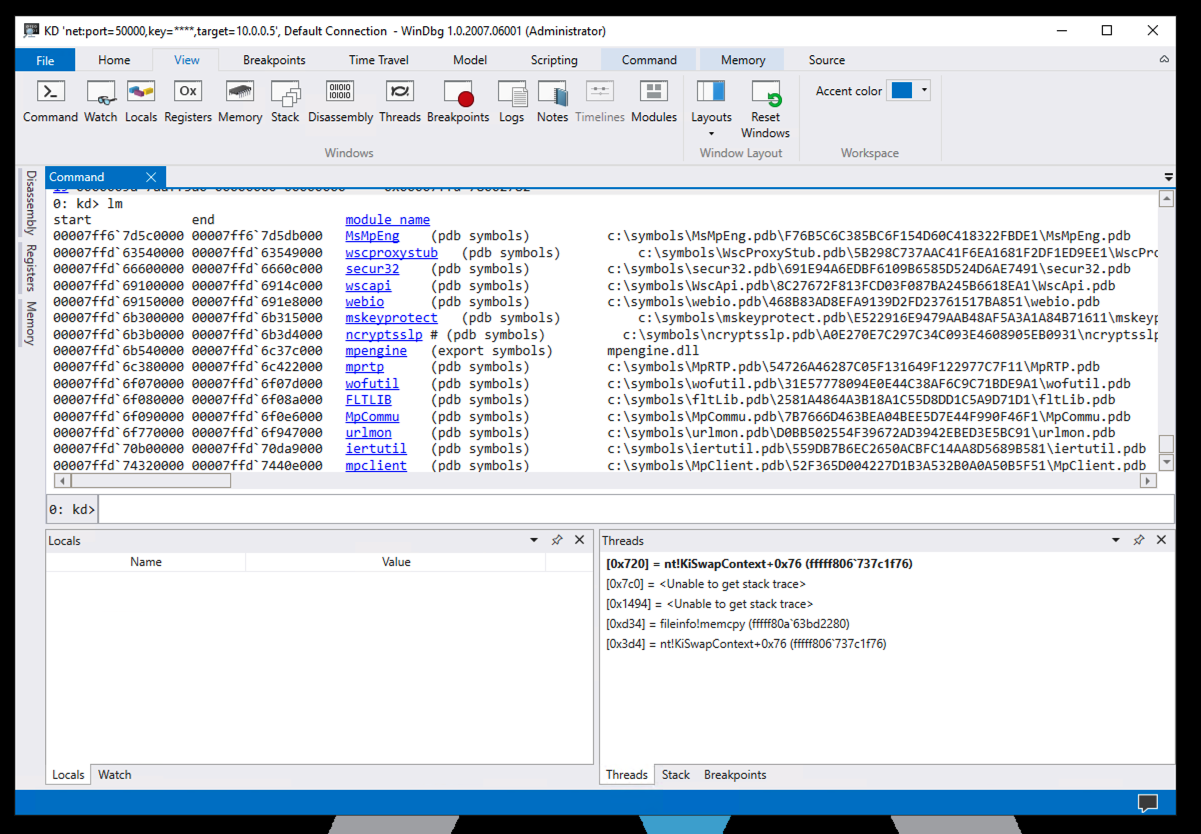
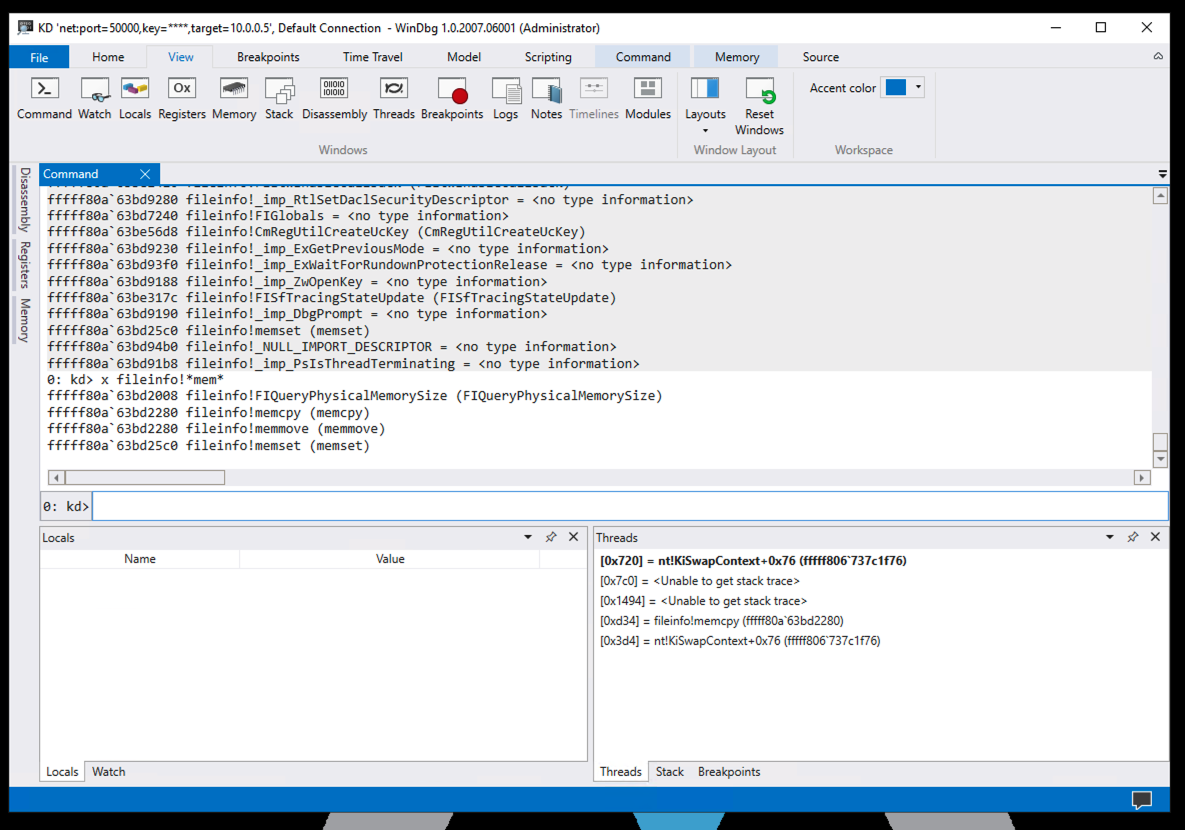
x fileinfo!*
In the lower center of WinDbg, execute this command:
x fileinfo!*mem*
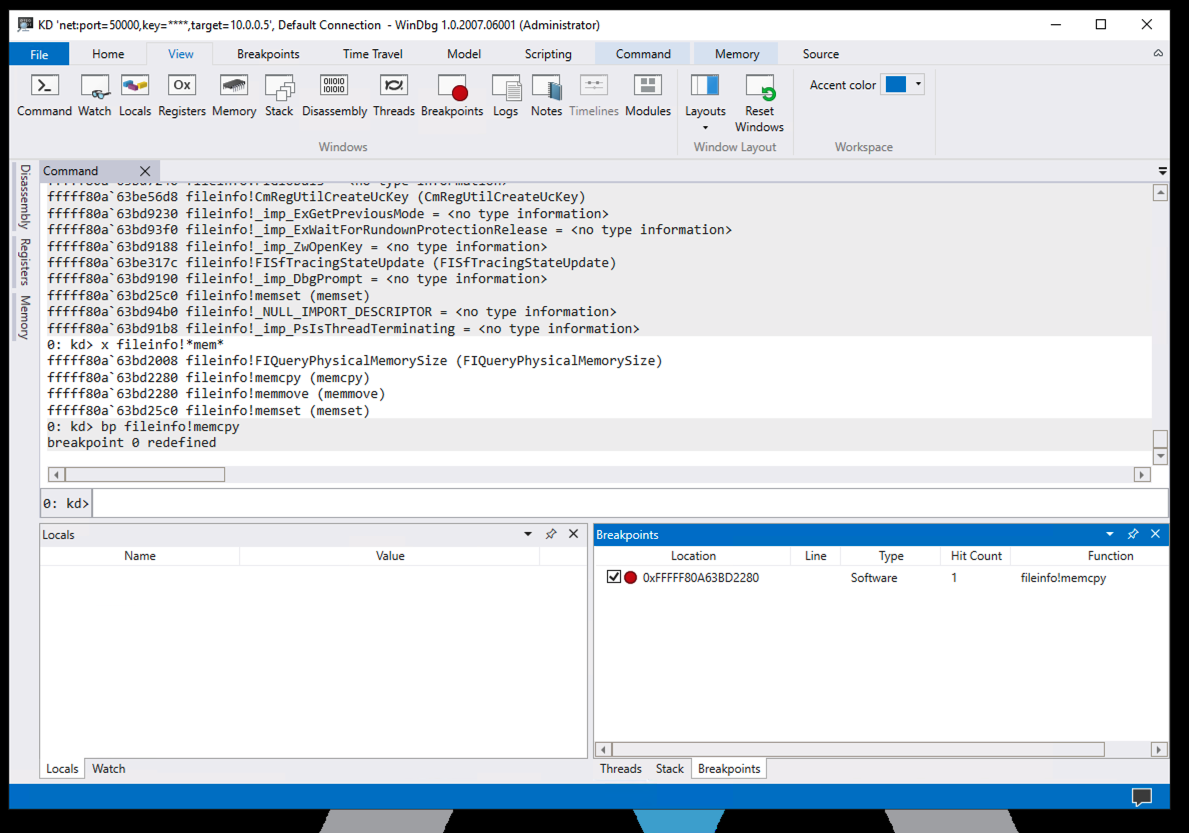
bp fileinfo!memcpy
Click the Breakpoints button.
The breakpoint is shown in the lower right pane, as shown below.
Click the Go button.
The breakpoint is hit immediately.
In the lower center of WinDbg, execute this command:
k
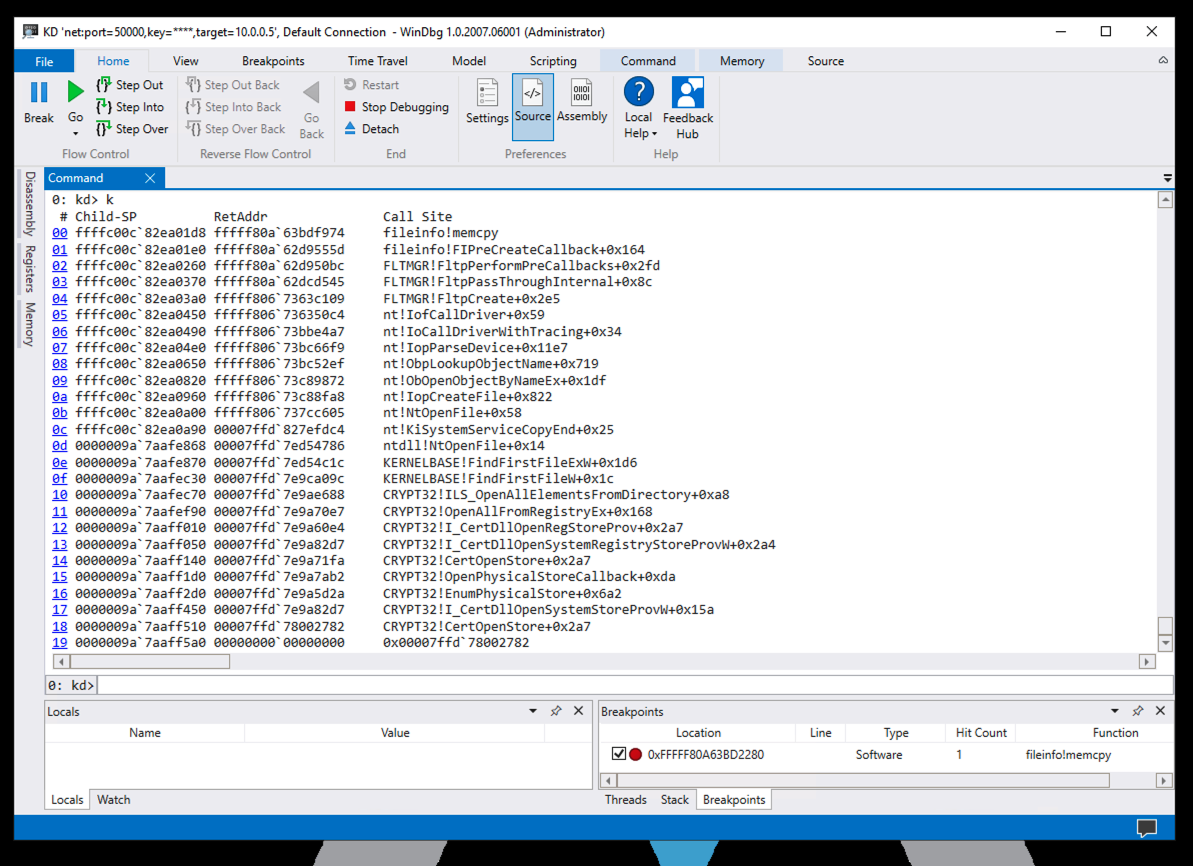
Reading from the bottom, in frame 19 (in the image above) some unnamed process called a CRYPT32 library function.
The CRYPT32 library function called several other functions in CRYPT32, and then called KERNELBASE, which called ntdll.
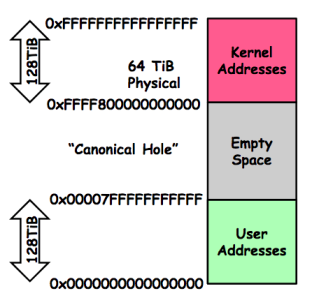
All these calls happened in userland, with addresses starting with 0000, as shown in the diagram below.
ntdll made the jump to kernelmode, calling a module in nt, with an address starting with ffff.
Several functions in nt were called, including nt!NtOpenFile, nt!IopCreateFile, and nt!IofCallDriver.
nt then called FLTMGR, which called fileinfo, ending up in fileinfo!memcpy, at our breakpoint.
(Image from here.
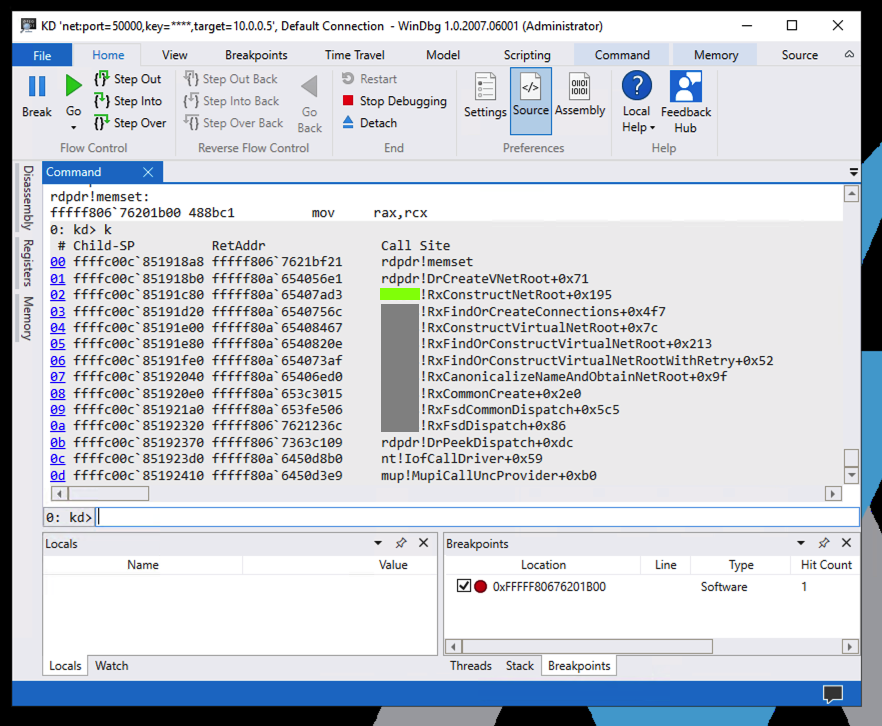
bp rdpdr!memset
Click the Go button.
PMA 433.1 Module (15 pts)
Connect to your target machine in your RDP client.WHen the connection starts, the breakpoint is hit.
In the lower center of WinDbg, execute this command:
Find the module name covered by a green box in the image below. That's the flag.
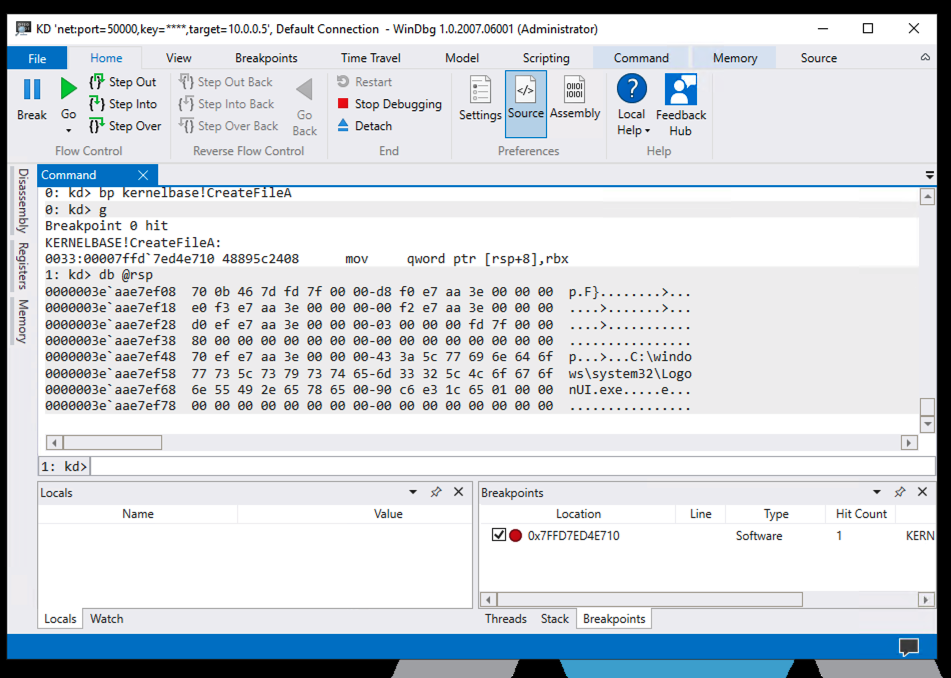
bp kernelbase!CreateFileA
g
In the lower center of WinDbg, execute this command:
db @rsp
In the lower center of WinDbg, execute these commands:
g
da @rsp+48
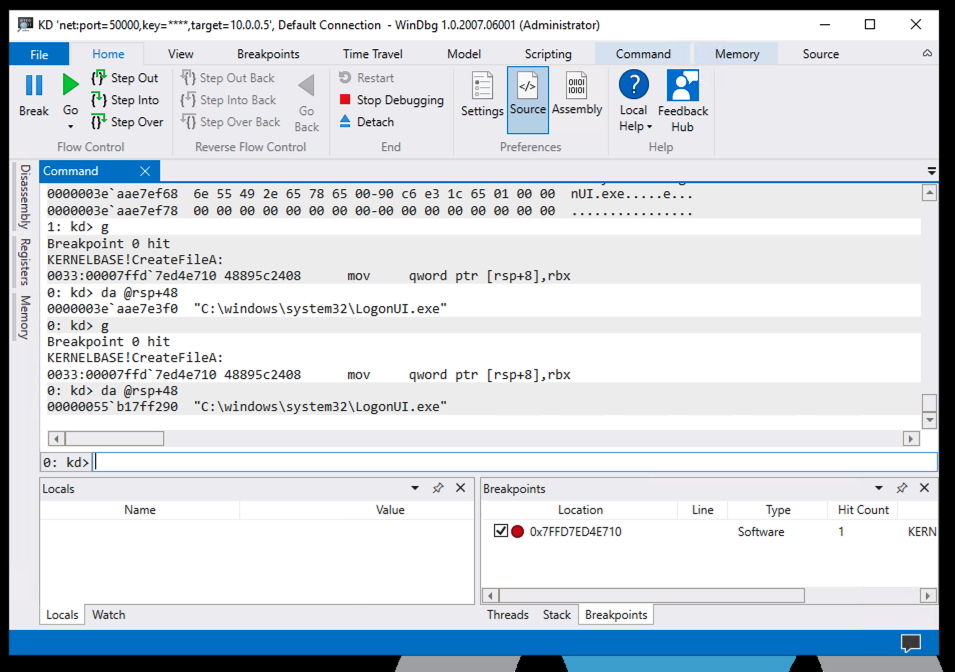
bp kernelbase!CreateFileA "da @rsp+48;g"
g
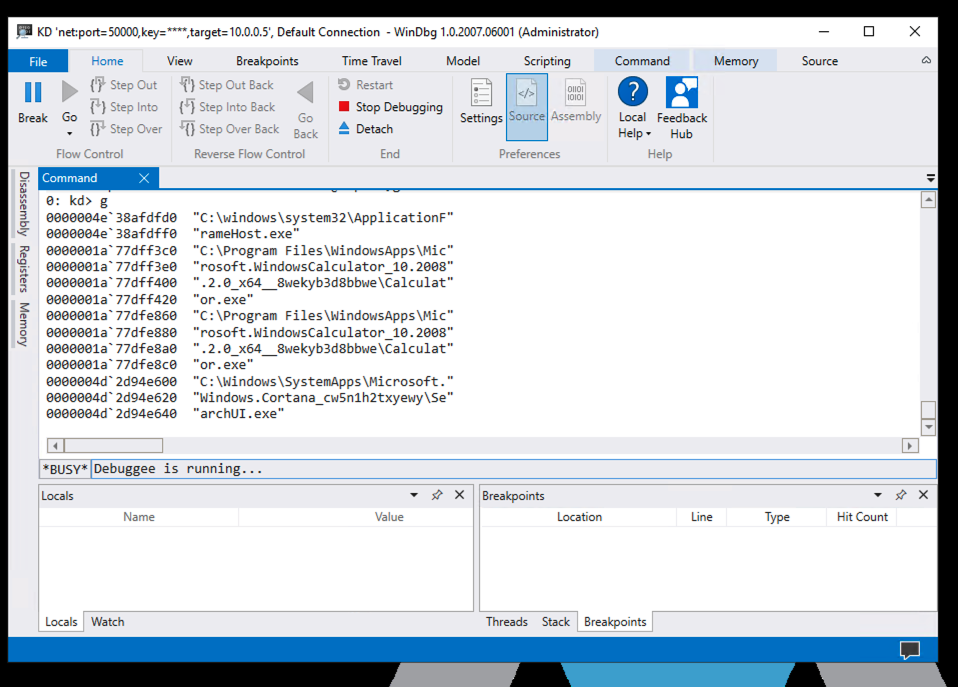
Click Start. Type CALC. Click Calculator.
You see the various files open, as shown below.
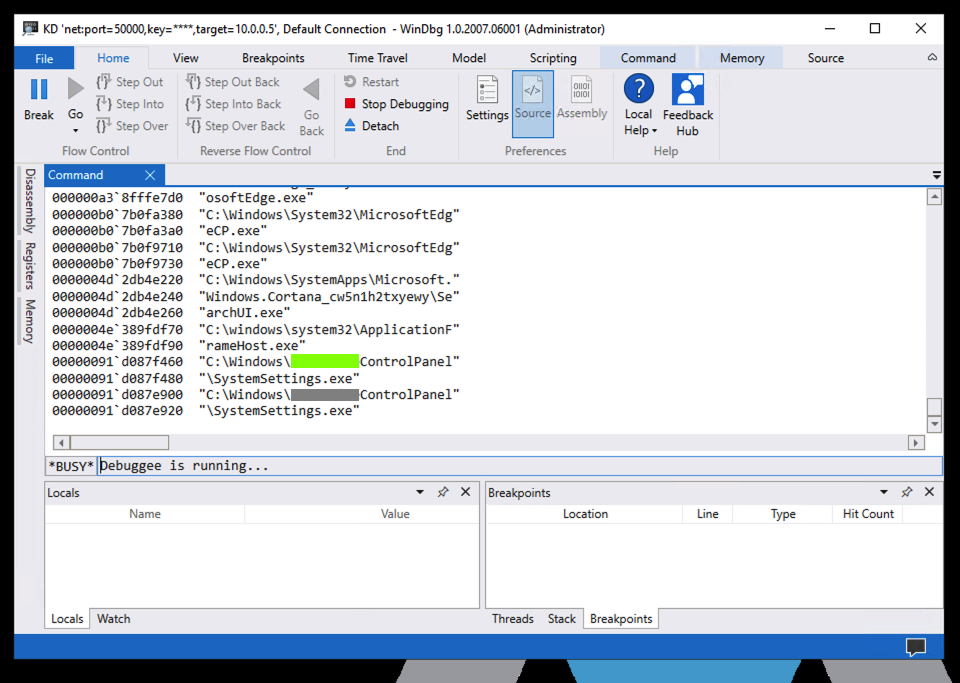
PMA 433.2 Module (15 pts)
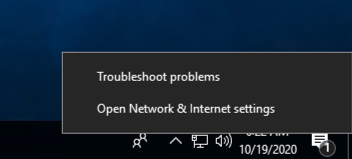
On your target computer, in the lower right corner, right-click the Network icon (it looks like a monitor).Click "Open Network & Internet settings", as shown below.
The "Network status" page opens, as shown below.
In WinDbg, the flag appears, covered by a green box in the image below.
bcdedit /debug off
Posted 10-18-20
IPCONFIG image fixed 10-22-20
Name changed to include Azure 5-4-2021