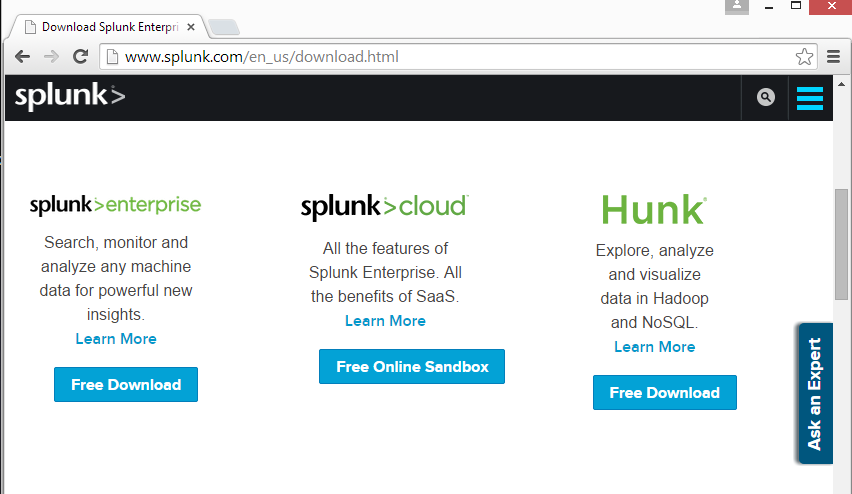
In the "splunk>enterprise" section, click the "Free Download" button, as shown below.
If you are using Windows, click Windows, as shown below.

In S214, we're using 32-bit Windows 7, so click the link for the x86 version, as shown below.


Log in with the default credentials admin and changeme
On the next page, enter a new password into both boxes. For this project, I recommend P@ssw0rd

The "Add data" page opens, as shown below.
Click monitor.

On the left side, click "Local Performance Monitoring", as shown below.

In the right pane of the page, make these selections, as shown below:

At the top of the page, click the green Next button.
In the "Input Settings" page, click the green Review button.
In the Review page, click the green Submit button.
A page appears saying "Local performance monitoring input has been created successfully", as shown below.

Click "Add more data".
Click monitor.
On the left side, click "Local Event Logs".
In the right pane, select these three logs, as shown below:

At the top of the page, click the green Next button.
In the "Input Settings" page, click the green Review button.
In the Review page, click the green Submit button.
In the "New Search" page, enter a search string of splunk as shown below.
At the top right, click the magnifying glass to perform the search.
You should see results, showing events about "splunk", as shown below.

Make sure you can see at least one result, showing an event about "splunk".
Save a FULL DESKTOP image with the filename Proj 13 from Your Name.